Introduction
Coordination polymer is a general term used to indicate a periodic array composed of metal ions which are bridged by organic ligands. This is a general term that incorporates a wide range of architectures including simple one-dimensional chains with small ligands to large mesoporous frameworks. Generally, the formation process of such compounds proceeds spontaneously and, therefore, is called a self-assembly process [1].
In general, the structural diversity of such crystalline materials depends on many factors, such as the nature (hardness or softness, oxidation number) of the metal ion, the template agents, the metal-ligand ratio, the pH value, the counter-anion, the available number of coordination sites, and the various coordination modes generated by the organic ligands [1]. Among the strategies of synthesis for these structures, the rational selection of organic ligands or co-ligands according to their length, rigidity, and functional groups is important for the assembly of structural controllable products, and a great deal of important investigations have been carried outin this way [2]. Recently, studies on the synthesis of coordination polymers (CPs) have become a trendy topic in coordination chemistry because of their interesting molecular topologies and potential applications in catalysis, molecular selection, medical problems, non-linear optics, ion exchange technology, microelectronics, separation chemistry and gas storage devices [3].
Trithiocyanuric acid (ttc), also referred as trimercaptotriazine, has a symmetric structure characterized by the presence of sulphur and nitrogen atoms in a ring (Fig. 1). All of these are a-donor atoms which can coordinate in a monodentate or bidentate fashion, and are able of generating discrete complexes or polymeric/network structures [4].
Trithiocyanuric acid bears three sets of N, S donor atoms. Each N, S donor set of ttc can display a great versatility of coordination, because it has the potential to coordinate to a metal through either the nitrogen or the sulfur atoms, or even in a chelating η2-fashion via the SH-C=N group. Thus, the availability of multiple a-donor atoms allows the possibility of forming a variety of polynuclear complexes. Henceforth, the capability of ttc to act as a bridging ligand is used commonly, and it has been observed in several reported polymeric compounds [5-6].
The aim of the present study was to obtain a new copper coordination polymer using ttc as ligand. For this purpose, various late transition metal salts were employed but no ligand coordination was evidenced. A conventional direct synthesis methodology was applied to generate finally the Cu(I) complex and ttc. The final chemical structure of the resulting product has been inferred from MALDI-TOF MS spectra, vibrational spectroscopy (FTIR), thermal analysis (DSC-TGA), UV-Vis spectroscopy and magnetic susceptibility measurement. This structure was validated by quantum chemical computational methods.
Material and methods
All reagents were obtained from commercial sources and used without further purification: Trithiocyanuric acid, 95.0 % (Sigma-Aldrich), Copper(II) perchlorate hexahydrate, 98.0 % (Sigma-Aldrich), N,N-Dimethylformamide, 99.9 % (Fisher Chemical). The solvent employed, N,N-Dimethylformamide (DMF), was dried with molecular sieves. Colorimetric analyses were made with a Color Reader CR-10 of Konica Minolta. The samples were measured in a Laser Time-of-flight Mass Spectrometer equipped with Delayed Extraction and Ion Mirror. A Nitrogen laser was used to ionize the samples. At least sixty individual spectra were averaged in each case. Spectral resolution was enough to separate isotopic components at the mass of the complex. UV-Vis spectra were recorded on a Thorlabs CCS200 spectrometer. FTIR spectra were recorded on a Perkin Elmer GX2000-FTIR Spectrometer using KBr pellets. To investigate the thermal stability of compound, DSC-TGA analysis were performed on a SDT Q600 (TA Instruments, New Castle DE, V8.3 Build 101) under N2 flow of 100 mL/min with a heating rate of 20 °C/min from room temperature to 800 °C. Magnetic susceptibility measurements were measured using a Squid Quantum Design MPS XL. Computational calculations were performed using the Gaussian09® and AIMAII® software packages.
Synthesis of [Cu(ttc)3]
The complex was synthetized by a sedimentation method as reported in the literature [7]; 1 mmol of Copper(II) perchlorate hexahydrate in DMF and 1 mmol of trithiocianuric acid (ttc) in DMF were combined in a 100 mL beaker and mixed well by continuous agitation. A yellow-brown precipitate was formed immediately. The reaction was defined as finished when there was no further color change; this usually occurred overnight, yet the solution was allowed to continue stirring for 2 to 3 additional days. After this time, the color of the solid remained even after washing with cold methanol, and drying in an oven at 60 °C. Its objective color (L*:34,7; a*:+57.9; b*:+29.3) was determined in the CIELAB (L*, a*, b*) color space [8]. Furthermore, completion of the reaction was also determined by IR spectroscopy because the absorption pattern obtained from the product of several trials was identical, which is an indicator that no changes were taking place in the product. The product was weighted, and the yield was calculated at 72% (1.44 mmol).
Computational method
The calculations of geometrical parameters in the ground state were performed with the Gaussian09® and AIMAII® programs. The structural properties and vibration spectra of the Cu(I) complex and ttc were determined using a DFT formalism, with the RB3LYP functional (Becke’s three-parameter hybrid model using the Lee-Yang Parr correlation) and both 6-31G and Alhrich-TZV basis sets [9-15]. Time Dependent Density Functional Theory (TD-DFT) using the same hybrid functional and basis sets was carried out to obtain vertical excitation energies and oscillator strengths at the optimized ground state equilibrium geometries [16]. The molecular electrostatic potential and HOMO-LUMO energies for the complex were evaluated at the same level of theory for the optimized structure. Finally, the analyses of Atoms in Molecules (AIM) were carried out with the AIMAII® software package.
Results and Discussion
The structure of the complex was explored by powder X-ray diffraction analysis but it presented a characteristic pattern of an amorphous material (Fig. 2), whose peaks (Table 1) did not reveal any periodic:
All attempts to grow single crystals from the product were futile; thus, the synthesized complex was characterized by the combination of alternative instrumental analysis techniques. The molecular structure of the synthetized complex has been proposed from similar studies reported in the literature [17-20].
Mass Spectrometry
A small amount of the precipitate was dissolved to saturation in a mixture of Acetone: EtOH: Water (ultra pure) in a 6:1:1 ratio. The Universal MALDI Matrix from Sigma-Aldrich was used for the MS, and was dissolved in the same solvent at a 10 g/l concentration. An additional solution of MALDI matrix was made in acetone at 10 g/l. This last solution was used as a seed layer on top of which identical aliquots of both the analyte and the matrix were mixed together and let dry.
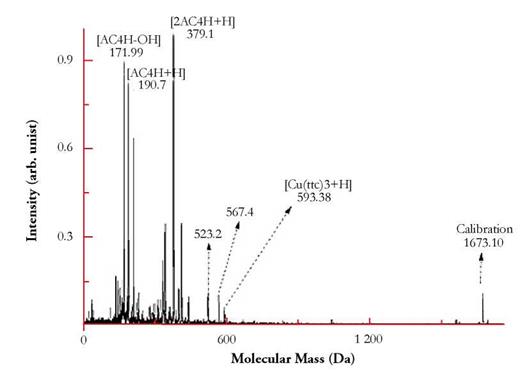
The matrix in MALDI-MS usually leaves many low mass (< 400 Da) peaks in the spectra. Particularly, alpha-cianno-4-hydroxy cinnamic acid (AC4H, C10H7NO3, nominal monoisotopic mass 189.043 Da), a well-known MALDI matrix, which is part of the so-called Universal MALDI matrix used, leaves easily identifiable fragments or adducts in the spectrum: [AC4H+H]+ = 190.70 Da, [AC4H-OH]+ = 171.99 Da, among others. Some of these peaks can and were used to perform internal calibrations in the spectra. The masses of the ions were determined with an error of less than 0.03 % in a 640 Da mass.
A spectrum of the complex measured is shown in Fig. 3. The main result is the identification of the molecular species [[Cu(ttc)3]+H]+ with a mass (chemical) of 593.38 Da (Calcd. 593.34 Da).

Figure 3 MALDI TOF-MS Spectrum of the complex. The signature MALDI mass corresponding to the molecular ionic species of the complex [M+H]+ is easily detected. Other multiple fragments can be seen in the spectrum at lower masses.
Thermogravimetric analysis
The DSC-TGA analysis (Fig. 4) for the synthetized complex was carried out under a N2 atmosphere. The spectrum showed a weight loss of 24.07 % at 63 °C ~ 165 °C which corresponds to the loss of two solvent DMF molecules and four H2O non coordinated molecules (Calcd. 24.00 %). Further decomposition occurred in the range of 165 °C ~ 673 °C, which is attributed to the elimination of three ttc ligands (Obsd. 58.46 %, Calcd. 58.50 %). The thermal decomposition of ttc had three points of inflexion at 267 °C, 303 °C, and 346 °C and occurred with an exothermic peak at 256 °C. The remaining product is thought to be CuO (Obsd. 17.47 %, Calcd. 17.50 %) [21,22].
Molar magnetic susceptibility
Molar magnetic susceptibility measurements were performed in a Squid Quantum Design MPS XL from 300 K to 2 K temperature range in 0.1 Tesla magnetic field (Fig. 5). In the whole range of temperature, the molar magnetic susceptibility was found to be negative and constant, which is characteristic of diamagnetic behavior of the Copper trithiocyanuric complex and is indicative of Cu(I) d10 diamagnetic ion (or state or configuration)
In order to confirm the observed diamagnetic behavior two magnetization experiments were performed: magnetization versus magnetic field from 0 to 1 Tesla at 5K and at 298 K (Fig. 6).
Figure 6 shows that at 5 K (Fig. 6a) the magnetization is positive and increases with the magnetic field increasing. This is consistent with a paramagnetic impurity adsorbed on the complex (can be remnants of Cu2+, paramagnetic), but being so small the amount of impurity is only seen at the temperature of 5 K. In contrast, at 298 K (Fig. 6b), the magnetization is negative and decreases with the magnetic field increasing. This behavior at 298K can be attributed to the diamagnetic Cu+ ion (d10 electronic state).
Optimized structure
Based on the DSC-TGA data and the information provided by references 7 through 10, a proposed structure was constructed with the Gaussview5® package (Fig. 7) and its geometry was optimized using a DFT formalism/RB3LYP method with the 6-31G and Alhrich/TZV basis sets. The Gaussian Calculation Summaries for the complex is showed in Table 2.
The optimized structural parameters (bond lengths and bond angles) of the complex calculated with 6-31G basis set are given in Table 3 and Table 4, respectively.
Fig. 8 shows the molecular system of the complex calculated by the AIMAII® software package from the molecular wave function data provided for Gaussian09®.
Vibrational analysis
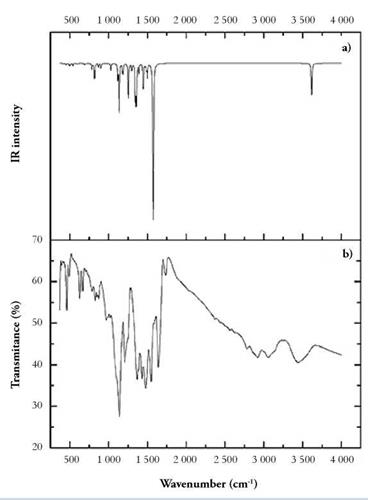
The experimental FTIR spectrum of ttc was consistent with that reported in the literature [24] [25]. Small differences were noticeable between the experimental and calculated FTIR spectra of ttc. These changes in frequencies can be attributed to the fact that the theoretical calculations correspond to a single molecule in the gaseous state, while the experimental results correspond to molecules in the solid state; therefore, the DFT-calculated harmonic vibrational frequencies are usually larger than those observed experimentally [23,24].
The principal bands observed at 1 532 (s), 1 120 (m), and 746 (w) cm-1 in the FTIR spectrum correspond to the characteristic vibrational and bending modes of the nonaromatic, trithione group forming the triazine ring.
Specifically, the band at 1 120 (m) cm-1 is assigned to -SH stretching vibrations coupled with in-plane scissoring. The peaks at the position of 2 908 ~ 3 146 (m) cm-1 are attributed to -NH stretching vibrations [25]. Since both absorptions (SH and NH group at 1120 (m) cm-1 and 2 908 ~ 3 146 (m) cm-1) are observed in the spectrum, the implication is that both tautomeric forms of the ttc ligand are present in the solid state. The assignment of -NH vibration is consistent with reported literature values, and it is conceived that this low frequency shift (compared with non-amide type N-H vibrations) is due to the proximity of neighboring thiocarbonyl moieties and electron delocalization about the ring [26].
After coordinative reaction of ttc, both of peaks at 2 908 ~ 3 146 (m) and 1120 (m) cm-1 disappear in the FTIR spectrum; in contrast, characteristics peaks of the trithiocyanurate [27-29], appear in the FTIR spectrum (Table 5).
Additionally, a broad peak is observed at 3 440 (w) cm-1, which is considered to be from an -OH stretching vibration of water molecules of crystallization. Finally, a peak appears at 207 (w) cm-1, corresponding to the Cu-N-C-S in-plane scissoring vibrational mode. This result is indicative of a successful coordination of the ligand ttc to the Cu(I) ion. The vibrational bands have been assigned according to the computed frequencies (Fig. 9).

Figure 9 (a) Theoretical with 6-31G basis set and (b) Experimental FT-IR spectra of the Cu(I) complex and ttc.
The correlation graphics between the calculated and experimental IR vibrational frequencies of the compound are presented in Fig. 10 and the correlation coefficient obtained was 0.988 4.
UV-vis spectroscopy
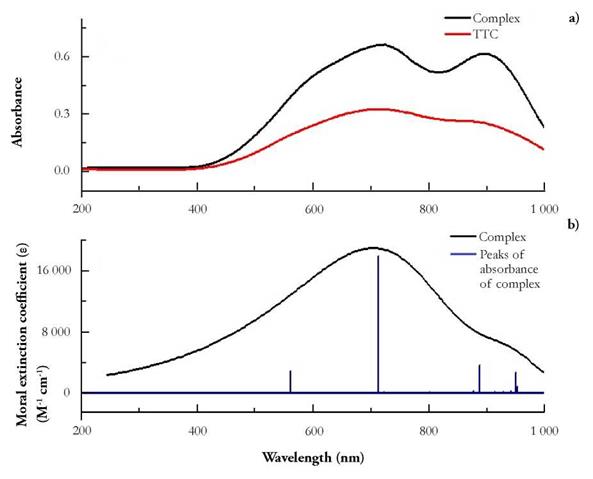
UV-vis electronic absorption spectra of the Cu(I) complex and ttc were recorded in the 200 - 1000 nm range at room temperature in DMF solutions using 1 cm path-length quartz cells. The maximum absorption wavelength was 725 nm, showing a bathochromic shift with respect to the maximum absorption at 720 nm of free ligand (Fig. 11 .a). The molar extinction coefficient (e) to the Cu(I) complex and ttc at a concentration of 2.44x10⁻⁹ mM was calculated to be 22 886.14 M-1cm-1. Based on the proposed geometry of the complex, this strong absorption band is assigned to a metal ligand charge-transfer (MLCT) state, as it is described later on in this work [30,31].

Figure 11 (a) Experimental UV-Vis spectrum of the Cu(I) complex and ttc and (b) Theoretical with 6-31G basis set spectrum of the Cu(I) complex.
Given the strong absorbance observed in the spectrum, it was impossible to identify any Laporte forbidden d-d transitions, possibly they were buried under other absorptions because of their low extinction coefficient. Finally, as with Laporte forbidden transitions, observation of any n→ π* transitions was not obvious because of their minuscule extinction coefficient. However, it is believed that the observed absorbance is due to a mixture of π → π* and MLCT excitations.
The UV-Visible spectrum was simulated (Fig. 11b). The number of states exited was increased until finding the highest strongly permitted state, which occurred at 713 nm with an oscillator force of 0.40. The number of excited states necessary to obtain the permitted level was 100. The absorbance recorded corresponds to a charge transfer between the metal and the ligands.
As shown in figure 11.b, there is adequate agreement between the theoretical results of maximum absorbance and the ones obtained experimentally. The displacement of the maximum absorption band, compared to the experimental results, possibly is due to the fact that the TD-DFT calculations do not evaluate the spin-orbit coupling; plus, the solvent interactions were ignored; the values presented by the software are averages [32]. The absorbance recorded at 560, 890 and 950 nm are thought to correspond to π → π* transitions from the triazine rings that are part of the molecular structure of the ttc.
Frontier Molecular Orbitals (HOMO-LUMO)
The frontier molecular orbitals, HOMO (highest occupied molecular orbitals) and LUMO (lowest unoccupied molecular orbitals), are the main orbital participating in chemical reactions and they are also used for predicting the most reactive position in n-electron systems [33]. The HOMO energy describes the ability of electron donating orbitals, while the LUMO describes the ability of electron acceptance, and the energy gap between HOMO and LUMO describes the molecular chemical stability [34]. HOMO and LUMO energies and chemical stability were also calculated with the same level of theory and the results obtained are listed in Table 6.
As can be seen from Table 6, the magnitude of the energy separation between the HOMO and LUMO is 0.84 eV. These low HOMO-LUMO gap values help explain the eventual charge transfer interactions taking place within the molecule [23]. The distributions and energy levels of the frontier molecular orbitals are shown in Fig. 12. It is likely that there exists an efficient electron transfer between ligands, from an S atom of the HOMO to the other S atom of the LUMO when an electronic transition occurs. The HOMO for the computed system exhibits very little metal character and it is localized mainly at the S atoms and the triazine ring from one of the ligands, whereas the LUMO is found to possess a strong metal character, and it is located mainly at the inner S atoms from another, different ttc ligand. This result suggests that there is an evident intramolecular charge transfer (ICT) from HOMO0 to LUMO0, which occurs through a -conjugated path. This intramolecular charge transfer is common in low valence metal complexes with accessible orbitals from the ligands [23].
Molecular Electrostatic Potential
Molecular Electrostatic Potential (MEP) maps of the Cu(I) complex and ttc were calculated with the optimized geometry. The positive (blue) regions in the MEP are related to nucleophilic reactivity and were mainly localized over the amino groups of each coordinated ttc ligand (Fig. 13).
Conclusions
The analytical and physico-chemical analyses provided important evidence that supports the proposed structure of the complex, [Cu(ttc)3], from Cu(I) ion and trithiocyanuric acid. The oxidation state of copper is diamagnetic Cu(I) d10. The product was obtained in high yield. The coordination sphere of the compound can be best described as trigonal bipyramidal. In the diamagnetic complex, two ttc molecules act as bidentate ligands that coordinate to the metal ion through their N-S atoms. The ttc that acts as monodentate ligand coordinates to the metal ion through its N atom. The optimized geometry, harmonic vibrational wavenumbers and intensities have been calculated employing a hybrid DFT/RB3LYP method with 6-31G and Alhrich-TZV levels of theory for the first time. The results obtained with both methods were similar. The fundamental vibrational modes of the Cu(I) complex and ttc were studied by FTIR spectroscopy. The theoretical wavenumbers are in good agreement with the observed vibrational wavenumbers. Furthermore, the calculated HOMO and LUMO energies and energy gap analysis suggest that there is an intramolecular charge transfer in donor-acceptor that substituted aromatic ttc ligands through a π-conjugated path. This transition (HOMO0 → LUMO0) is predicted as a π - π* transition.


![Characterization of the mRNA untranslated regions [UTR] of the Trypanosoma cruzi LYT1 isoforms derived by alternative trans-splicing](/img/en/next.gif)


