


 text in
  English (pdf)
 Article in xml format
 Article references
 Send this article by e-mail
 Cited by SciELO
  Cited by Google
  Similars in
SciELO
Similars in
SciELO  Similars in Google
 Permalink
Introduction
The inclusion of honey as a nutritious food in the human diet is historical and continues to this day because it is considered an exceptional natural sweetener (Crane, 1975, as cited in Bogdanov et al., 2008). Furthermore, it represents an excellent source of energy for athletes and children (Bogdanov et al., 2008) and, in small amounts, can be added as an ingredient to healthy and balanced diets (Bobiş et al., 2018; Chepulis et al., 2009). Honey is recognized as an aqueous solution composed of more than 200 substances (Ferreira et al., 2009), supersaturated with different mono- and polysaccharides, among which glucose and fructose predominate (» 95%) (Al-Farsi et al., 2018, as cited in Sakač et al., 2019), and other minor constituents such as minerals, proteins, phenolic compounds, enzymes, vitamins, organic acids, and pigments (Crane, 1975, as cited in Bogdanov et al., 2008).
The literature reports that health-promoting properties (for example, prevention and treatment of gastric and cardiovascular disorders, reduced physiological effects of hepatitis, and radiation therapy for cancer) are achieved through doses between 50 and 80 g per honey serve (Bogdanov et al., 2008). However, the composition, consumer preference, and the different biological effects of honey are associated with several factors, mainly the floral source in the production area and the type of nectar (botanical origin), the type of soil and environmental conditions (geographical origin), and the beekeeping and manufacturing practices that the beekeeper follows (Silva et al., 2017).
Many authors propose the determination of physicochemical parameters as useful markers to define the geographical origin of different honeys, including pH, sugar content, acidity, ash, electrical conductivity (EC), mineral content, and color (Đogo et al., 2020; Laaroussi et al., 2020; Sakač et al., 2019; Scholz et al., 2020).
Honey color is the main attribute that the consumer uses to determine their preference and acceptance and is defined by the pigments (carotenoids, xanthophylls, and flavonoids) in the nectar and pollen collected by the bee (Ciappini et al., 2013; Kirk, 2018) and the type of minerals (metals) contained in honey capable of forming colored complexes with organic acids (Harris, 2014, as cited in Sakač et al., 2019). Worldwide, honey color preferences fall into a wide range of hues that go from water white to dark amber, according to the Pfund scale (White, 1984), since the perceptual attributes differ qualitatively from one person’s vision to another (Al-Rasheed, 2015).
The minerals come directly from the soil in floral honey and represent a low percentage of its composition (< 0.2%) (Silva et al., 2017). The most representative metal is potassium (K) and is preceded by sodium (Na), calcium (Ca), and magnesium (Mg). Some trace elements such as iron (Fe), copper (Cu), zinc (Zn), and manganese (Mn) are also present at intermediate or trace levels. Depending on the agroecological management of soil, the presence of toxic metals, such as lead (Pb), cadmium (Cd), arsenic (As), mercury (Hg), and chromium (Cr) can be identified (De Andrade et al., 2014; Đogo et al., 2020; Laaroussi et al., 2020; Rosa et al., 2015; Sakač et al., 2019).
Geographical and climatic conditions favor beekeeping production in Colombia (Chamorro-García et al., 2013; Chamorro et al., 2017; Salamanca et al., 2017; Zuluaga et al., 2014). The most recent sectoral figures report an annual honey production of 3,372 tons (t) in 2018 and an increase of 28% in the last ten years; the Cauca department is the seventh producer nationwide (136 t) (Consejo Nacional CPAA & Comités Departamentales, 2018).
Different types of honey are produced in Colombia (Chamorro et al., 2017; Nates-Parra et al., 2013; Ortega-Bonilla et al., 2016); however, most have not been characterized. Therefore, this study evaluates the physicochemical parameters of commercial honey samples purchased in six municipalities in Cauca. In 24 kinds of honey harvested in 2015 and 2016, we analyzed the following characteristics: free acidity, ash, total phenol content, EC, °Brix, moisture, insoluble material, pH, macro- and micromineral content, and instrumental color (Pfund and CIElab scales).
Materials and methods
Samples
Twenty-four samples of commercial honeys harvested in 2015 and 2016 were purchased in Caldono, La Vega, Paispamba (municipal seat of Sotará), Silvia, and Totoró through the Cauca Cooperative of Beekeepers (Cooapica). Samples were stored at 20 °C and away from sunlight until analysis.
Physicochemical analysis
pH, EC, free acidity, and insoluble matter
These parameters were determined by applying Bogdanov’s (2002) methods. The pH of aqueous honey solutions (10 g/75 mL) was measured with a combined electrode, equipped with a pH meter (Mettler Toledo®), and the EC was measured at 20°C using a conductivity meter (Bante®, model DDS-12DW); the results were expressed in milliSiemens per centimeter (mS/cm). Free acidity was estimated from an acid-base titration. The aqueous honey solution was titrated with 0.1 N NaOH in the presence of phenolphthalein until reaching a pH of 8.3; the results were expressed in milliequivalents of acid/kg of honey (meq/kg) (Bogdanov, 2002). The insoluble matter was determined based on the weight gain experienced by a crucible with fine pores (15-40 microns) after filtering a honey solution (20 g of honey and 200 mL of water) and keeping it in an oven at 135°C for one hour; subsequently, the crucible was cooled in a desiccator and weighed to a constant weight. The result was expressed as grams of insoluble matter per 100 grams of honey (%).
Moisture, Brix degrees (°Brix), and ash
Moisture and °Brix were determined by refractometry (Brixco ATC, Model 3090) at 20°C from the reading recorded by the equipment upon placing a couple of drops of the honey sample on the prism. The ashes were calculated from the weight of the inorganic residue remaining after carbonizing the sample at 600°C to constant weight (Terrinogen, Model F2ACP); the results were expressed in grams of total ash per 100 grams of honey (%) (Association of Official Analytical Chemists [AOAC], 1990).
Total phenolic compounds (TPC)
These compounds were determined by spectrophotometric analysis using Singleton and Rossi’s (1965) Folin-Ciocalteu method with some modifications. A volume of 1 mL of honey solution (0.1 g/10 mL) was mixed with 2 mL of 2 N Folin-Ciocalteu phenolic reagent and 8 mL of 0.7 M Na2CO3 solution. The reaction mixture was incubated for two hours in the dark at 20.0 ± 0.2°C, and the absorbance was measured at 764 nm. Each sample’s total content was expressed as milligrams of gallic acid equivalent/100 g of honey (mg GAE/100 g).
Mineral content
The mineral elements were obtained by the calcination method using atomic absorption spectroscopy (AAS) with flame (Thermo Electron Corporation, S4 AA System Series), with all the wavelength, bandwidth, and gas flow parameters established by the manufacturer for Na (589.0 nm, 0.2 nm, and 1.1 L/min, respectively), K (766.5 nm, 0.5 nm, and 1.2 L/min, respectively), Mn (279. 5 nm, 0.2 nm, and 1.1 L/min, respectively), Fe (248.3 nm, 0.2 nm, and 1.0 L/min, respectively), Ca (422.7 nm, 0.5 nm, and 4.0 L/min, respectively), Zn (213.9 nm, 0.2 nm, and 1.0 L/min, respectively), Pb (217 nm, 0.5 nm, and 1.1 L/min, respectively), and Cu (324.8 nm, 0.5 nm, and 1.0 L/min, respectively). Five milliliters of 1 N nitric acid were added to the ashes obtained from each honey sample; then, the mixture was stirred until completely dissolved and filtered through a 0.45 nm nitrocellulose membrane.
The filtrate with its respective aqueous washings was transferred to a 50 mL volumetric flask to determine macroelements (or 10 mL for microelements), where it was diluted with ultrapure water and stored at 4°C until later analysis. For its analysis, an air/acetylene flame (or nitrous oxide/acetylene for Ca analysis) was used as entrainment vapor and hollow cathode lamps of Na, K, Mn, Fe, Ca, Zn, Pb, and Cu. The quantitative determination was carried out using the external calibration curve method with at least five standard solutions with different metal concentrations, prepared from the 1,000-ppm standard in 0.5 M HNO3. Calibration curves within a linear range (R > 0.998) were used. All samples were analyzed in triplicate.
Color evaluation
The color evaluation was carried out by the spectrophotometric method from the CIELab and Pfund scale parameters. The color and luminosity parameters (L*) a* and b* were determined using a spectrophotometer (Macherey Nagel, Nanocolor). The a* value ranges from red (positive) to green (negative), and the b* value ranges from yellow (positive) to blue (negative) (Anupama et al., 2003). The spectrophotometric measurement of honey solution at 50% (m/v) was performed on the same equipment with an absorbance reading at 635 nm. The absorbance obtained was used to estimate the color in mm Pfund with the following algorithm: mm Pfund = -38.7 + 371.39 × absorbance, and White’s (1984) Pfund scale. The color measurements in the analyzed honeys were carried out in triplicate.
Statistics
The results were expressed as mean value (X) ± standard deviation (SD) of the triplicate analyses for all measurements. The variations in the parameters observed between the samples were analyzed through the analysis of variance (ANOVA) and the correlations between the physicochemical parameters utilizing the Pearson correlation coefficients (r) at a significance level of 95% (p < 0.05). Principal component analysis (PCA) was used to study the potential correlations between the measured variables. All data were statistically processed using XLSTAT, version 2014.5.03 (Addinsoft Inc., New York, N.Y, USA).
Results and discussion
Different types of honey are produced annually in Colombia, where honey production is still a secondary but increasing artisan practice in several regions (Consejo Nacional CPAA & Comités Departamentales, 2018; Erasso-Arango & Montoya, 2013; Salamanca et al., 2017). In this context, it is crucial to examine various honeys existing in Colombia to promote quality processes in their production and favor marketing aspects related to their composition.
The measurements of free acidity, ash, TFC, EC, °Brix, moisture, insoluble material, and pH in four honey samples from the municipalities of Caldono (C), La Vega (LV), Paispamba (P), Silvia (S), Timbío (Ti) and Totoró (To) are shown in table 1.
Table 1. Physicochemical characteristics of the analyzed commercial honeys from Cauca, Colombia
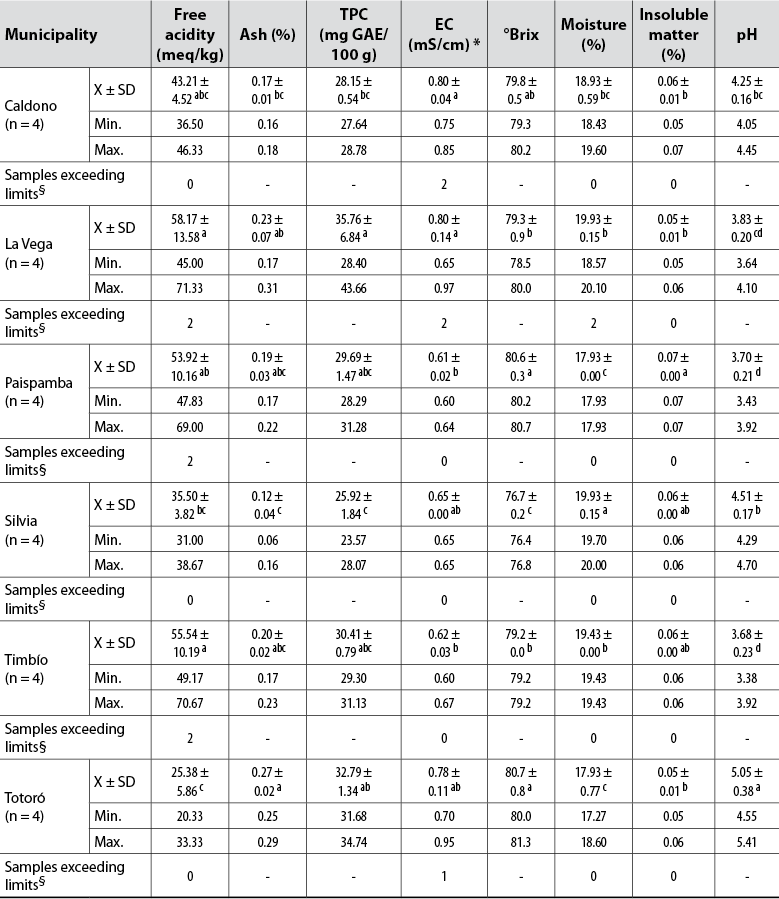
Note.Average values in the same column followed by the same letter do not differ statistically (p ≤ 0.05) by Tukey’s multiple range test. Min.: Minimum value; Max.: Maximum value; *Parameter compared to the limits defined in Codex Alimentarius Commission (2001); §Limits established by the Colombian Technical Standard NTC-1273 (Instituto Colombiano de Normas Técnicas y Certificación [Icontec], 2007).
Source: Elaborated by the authors
By nature, honey is acidic due to the coexistence of organic acids, lactones, esters, vitamin C, and proteins that can donate H+ to the environment (Álvarez-Suárez et al., 2018; Karabagias et al., 2018; Sakač et al., 2019). Free acidity, in particular, is due to the presence of gluconic acid, derived from the activity of glucose oxidase (GOx) during honey extraction and glucose conversion (Đogo et al., 2020), which may be in equilibrium with their relevant internal lactones or esters, and the presence of some inorganic ions, such as phosphate, sulfate, and chloride (Silva et al., 2020).
Both free acidity and pH are useful parameters to identify the degree of deterioration of honey and the development of unwanted fermentative processes since they affect the honey texture, stability, and shelf life (Silva et al., 2017). The pH and free acidity values of the samples analyzed vary from 3.38 (Ti) to 5.41 (To) and 20.33 (To) to 71.33 (LV) meq/kg, respectively. Also, significant differences (p < 0.05) were found between the samples according to their origin.
The pH values are similar to those estimated in Colombian commercial honeys (Aguas et al., 2010; Méndez et al., 2010; Ortega-Bonilla et al., 2016; Salamanca et al., 2017) and multifloral honeys (Álvarez- Suárez et al., 2018; Ciulu et al., 2018; Đogo et al., 2020; Dżugan et al., 2020; Fernandes et al., 2020; Laaroussi et al., 2020; Sakač et al., 2019; Scholz et al., 2020). Values which are less than 7.3 are considered acceptable to avoid microorganism proliferation (Sakač et al., 2019). These pH variations are due to multiple factors, particularly geographic and botanical origin and climatic conditions (Acquarone et al., 2007).
The free acidity of 75% of the samples complies with national and world legislation (50.00 meq/kg) (Codex Alimentarius Commission, 2001; Icontec, 2007). The levels detected in a pair of samples from LV, P, and T do not meet the allowed limit, suggesting that fermentation processes associated with improper handling in the apiary evolve in these honeys, and the transformation of alcohol increases the levels of acid. These findings coincide with those reported by Méndez et al. (2010), who found levels of 150.5 meq/kg for Colombian commercial honeys.
Concerning moisture, the permissible limit value is 20% and is a parameter related to honey preservation and storage. Two of the samples from LV slightly exceed this limit, which is associated with the fermentation phenomenon identified from free acidity. In general, the moisture of these honeys ranges between 17.9 and 20.0%.
The °Brix values, indicators of the sugar content in the studied samples (76.4-81.3), are comparable to those reported for Colombian honeys (77.4-80.0) (Méndez et al., 2010; Salamanca et al., 2017) and other countries (73.8-83.4) (Silva et al., 2017).
All samples met the regulatory requirements established for insoluble matter percentages (< 0.1%) and ash (< 0.6%). The latter showed significant differences between the samples and the origin, reiterating the importance and differences of the type of soil, edaphoclimatic conditions, and geographic diversity of the areas where bees collect nectar (Laaroussi et al., 2020). On average, the lowest level was observed in S samples, and the highest in To and LV; the latter were very close to those reported by Salamanca et al. (2017).
EC is an approximate measure of the concentration of mineral salts or ashes, organic acids, and proteins in honey and allows discriminating the sample’s floral origin from values of < 0.8 mS/cm (Bogdanov, 2007). The P, S, and Ti honeys and three To samples showed lower values than those regulated by the Codex Alimentarius Commission (2001), indicating that these samples are flower or nectar honeys and the remaining five samples (C, LV, To) honeydew honey. In general terms, a significant correlation was observed between EC and ash (r = 0.4929, p < 0.05), and between EC and TPC (r = 0.5382, p < 0.05).
The average TPC content in the evaluated samples ranged between 25.92 and 35.76 mg GAE/100 g. The values found are congruent with those reported by Ortega-Bonilla et al. (2016) and Salamanca et al. (2017) for honeys from Colombia (12.9-157.0 mg GAE/100 g). These metabolites come directly from nectar and pollen and indicate honey’s potential antioxidant activity (Gašić et al., 2014; Pauliuc et al., 2020).
The content of macro and microelements in honey comes from different sources, mainly from the soil where the plants grow that the bees then visit to collect their food (Da Silva et al., 2016). Meanwhile, toxic metals such as Al, Cd, Cr, Fe, Pb, Mn can be incorporated into honey as a result of pollution processes in the habitat of bees, little control in processing, and even release from metal containers used for storage (Đogo et al., 2020). Because these elements may be bioavailable to humans and affect this product’s quality and safety, monitoring their presence in the samples studied is vital. The average content of each mineral analyzed in the 24 honey samples are shown in table 2.
The LV and To samples showed the highest amounts of total minerals (882.20 and 875.02 mg/kg sample), while those from Si had the lowest concentrations (259.07 mg/kg sample). Due to the concentration ranges determined, we could infer that the analyzed honeys are of floral origin because they are comparable with those reported in previous works (Monggudal et al., 2018; Sakač et al., 2019; Silva et al., 2017). The metal that quantitatively contributed the most to the total mineral content was K (» 77%), as reported by other authors for floral honeys from other countries (Đogo et al., 2020; Imtara et al., 2018; Kolayli et al., 2018; Laaroussi et al., 2020; Sakač et al., 2019; Silva et al., 2020), followed by Na (» 11%), Ca (» 11%), and microminerals with a minimal contribution (< 1%).
Pb was not detected; however, the K, Ca, and Zn levels of the Colombian honeys analyzed are below the levels reported for honeys from Portugal (Silva et al., 2020) and Palestine (Imtara et al., 2018) (812 -2558 mg/kg, 63-376 mg/kg, and 0.13-25.20 mg/kg, respectively). For their part, the Zn and Fe levels exceed those found in honeys from Portugal, Morocco (Laaroussi et al., 2020), and Serbia (Sakač et al., 2019) at least two-fold (0.13-4.02 mg/kg and 0.03-3.07 mg/kg, respectively), as well as Cu levels for honeys from Palestine, Portugal, and Morocco (0.05-1.53 mg/kg), which can be explained by the prevalence of these minerals in acid soils such as those in Cauca (Muñoz et al., 2014).
The Mn levels are comparable to those of Portuguese honeys (3.93-8.75 mg/kg). Significant differences (p < 0.05) were established between the samples and the origin of metals, except for Zn. These results prove the nutritional value of the consumption of this type of honey, even if the contribution of Zn, Cu, and Mn is considered, since they do not exceed the permissible levels per day for a human (Nordberg, 2012). However, altogether with Fe, they guarantee the development of fundamental physiological processes.
Table 2. The mineral content of analyzed commercial honeys from Cauca, Colombia (mg/kg sample)

Note.Average values in the same column followed by the same letter do not differ statistically (p ≤ 0.05) by Tukey’s multiple range test. Min.: Minimum value; Max: Maximum value.
Source: Elaborated by the authors
The color of honey is one of the reference characteristics that the consumer uses to assess its quality (Erasso-Arango & Montoya, 2013). This work assessed the instrumental color through the Pfund and CIELab scales. The parameters measured on the samples are shown in table 3. According to the averages on the Pfund scale, the color of the honey samples is classified into two categories and explains the variability observed between samples: the first one, light amber, varied between 68.10 and 84.47 mm Pfund and includes the C, P, and S honeys; the second category, amber, includes the Ti, To, and LV honeys. However, the mm Pfund values in the LV samples show a high relative standard deviation (18%) because one sample recorded an mm Pfund value for light amber, two for amber, and one for dark amber.
These results are associated with the total mineral content; that is, the light amber sample (73.41 mm Pfund) is the one that contains the least minerals (695.9 mg/kg) (Sakač et al., 2019), and suggests that the bees producing the samples analyzed from this municipality did not collect their nectar in areas with similar edaphoclimatic conditions. It is noteworthy that storage conditions influence honey color: long periods of honey storage or heating processes favor melanoidin formation and darkening (Imtara et al., 2018; Laaroussi et al., 2020).
Table 3. Instrumental color parameters of analyzed commercial honeys from Cauca, Colombia

Note.Average values in the same column followed by the same letter do not differ statistically (p ≤ 0.05) by Tukey’s multiple range test. X: Average; SD: Standard deviation; Min.: Minimum value; Max: Maximum value.
Source: Elaborated by the authors
Color is also affected by the content of phenolic compounds, which is noted in a significant positive correlation between color and TPC (r = 0.9229, p < 0.05). Due to this compound’s ability to form colored complexes with some metals (Sakač et al., 2019), honeys with a higher TPC content tend to be darker, as is the case with LV, Ti, and To samples.
Measurements on the CIELab scale show that the average luminosity (L*) value of the honey samples from Si was the highest (76.24), indicating that it is the brightest honey, while those from To and LV were the darkest, with L* of 69.35 and 69.81, respectively. The red hue was present in all samples (positive value of a*) but predominated in the LV, P, and To honeys. According to the origin, the yellow hue (positive value of b*) did not show significant differences in the honeys.
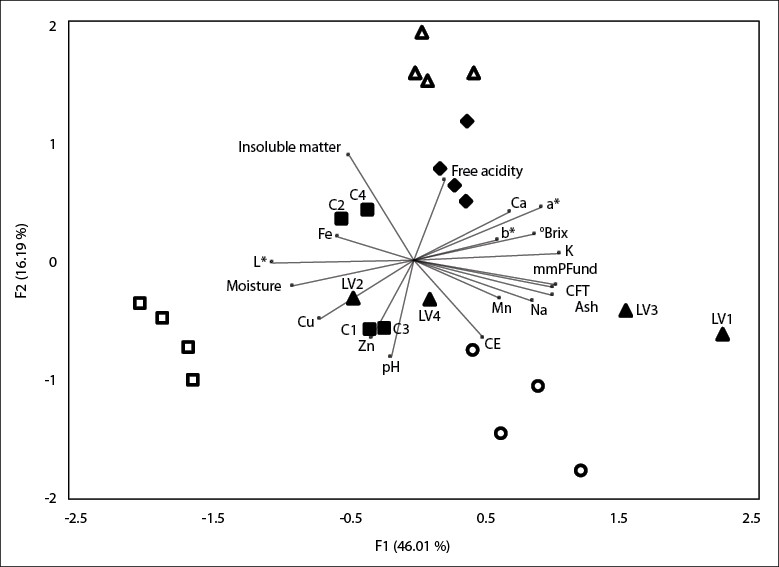
To analyze the similarities of the honey samples collected from different municipalities in Cauca, the PCA was applied by representing the parameters found and the various samples in a two-dimensional diagram. The projection of the physicochemical, mineral, and color parameters of all the honey samples in the plane composed of the two main axes F1 and F2, are shown in figure 1, which represent 62.2% of the total variance. TPC, ash, color expressed in mm Pfund, K, Na, °Brix, and a* made a significant contribution to F1 formation, while free acidity, EC, insoluble matter, pH, and Zn made a significant contribution to F2 formation. Two samples from C (C2 and C4) are projected in the plane formed by the negative axis of F1 and positive axis of F2 due to their high iron and insoluble matter content.
Furthermore, the To, LV1, LV2, and LV3 samples are projected on the positive axis of F1 and the negative axis of F2 given their high EC, high percentage of ash, and high values of Mn, Na, TPC, and color expressed in mm Pfund. Furthermore, P and Ti are projected in the plane formed by the positive axes F1 and F2 and S, C1, C3, and LV2 in the negative axes F1 and F2. This separation is due to the high levels of free acidity and °Brix, high Ca and K content, and higher values of a* and b* exhibited by the P and Ti samples, while the Si samples were characterized by the high content of Cu and higher values of L*. These results coincide with other studies that indicate that it is possible to differentiate between honey samples by PCA, based on their physicochemical parameters, color, and mineral content.
Conclusions
The physicochemical evaluation of samples of commercial honeys harvested in six municipalities in Cauca (Colombia) during 2015 and 2016 was carried out with the following purposes: a) to determine the quality of the samples of honey consumed in the region and b) to establish any similarity and difference that can be attributed to the geographical origin of honey.
All the honey samples from Silvia met the criteria defined by the NTC-1273 (Icontec, 2007) for floral honeys. According to the EC, five honey samples (Caldono, La Vega, Totoró) showed characteristic values of honeydew honeys. Half of the samples from La Vega, Paispamba, and Timbío exceeded the permitted free acidity levels, demonstrating the evolution of unwanted fermentation processes that are justified, in the samples from La Vega, by the high moisture content found. These findings warn of the effects of improper harvesting, post-harvesting, and manufacturing practices by beekeepers.
The honey samples showed variability in their phenolic compound content, mineral content, and color, and the changes in the analyzed parameters seem to be due to geographic differences, climate, soil composition, or nectar sources.
Multivariate analysis was partially adequate to classify honey types of similar origin, such as honeys from Paispamba, Silvia, and Totoró. In conclusion, the mineral, physicochemical, and colorimetric parameters analyzed in this study are sufficient to discriminate between the four sources of honey. However, it is necessary to increase the number of samples to get a better understanding on the variables.

