


 English (pdf)
 Article in xml format
 Article references
 Send this article by e-mail
 Cited by SciELO
  Cited by Google
  Similars in
SciELO
Similars in
SciELO  Similars in Google
 Permalink
Introduction
Nitrogen (N) is considered the most critical limiting factor in crop expansion because of its impact on plant growth and soil fertility (Basu & Kumar, 2020; Gazolla et al., 2022; Miranda et al., 2020). For such reason, chemical fertilizers are indiscriminately used on crops. However, these fertilizers have contributed to the degradation of the soil’s biological, physical, and chemical properties and hydrological cycles (Camelo et al., 2017), decreasing organic matter and soil degradation (Rodríguez et al., 2018). They also affect the edaphic microbial communities that play a crucial role in maintaining soil fertility and are often sensitive to fertilization due to their enormous but transient contribution of inorganic N, which is released after the application of ammonium fertilizers (Ouyang & Norton, 2020).
Additionally, in Colombia, the price of chemical fertilizers has been 45% above the international price, the reason why the use of less expensive inputs is required. In this sense, arbuscular mycorrhizal fungi (AMF) reduces the consumption of fertilizers and lowers production costs since their mutualistic relationship makes it easier for most plants to complement their nutritional requirements (Hernández et al., 2015; Rodríguez et al., 2018). According to Hack et al. (2019), AMF favors the intake and assimilation of mineral nutrients from the soil, being a symbiosis in itself, the majority of terrestrial plants can participate (Moshiri et al., 2019; Turrini et al., 2018), and shows benefits such as boosting plant growth, increasing mineral nutrition (Hack et al., 2019; Seleiman & Hardan, 2021), increasing tolerance to abiotic stress and drought conditions (Chialva et al., 2020; Moreira et al., 2018), and improving the soil’s physicochemical and biochemical conditions so that N2-fixing bacteria have better activity (Oros et al., 2020; Seleiman & Hardan, 2021).
In Colombia, most studies have focused on the benefits of AMF symbioses in which different hosts (cassava, corn, Kikuyu, tomato, coffee they participated, especially regarding plant productivity and nutrition (Acevedo et al., 2017; Gutiérrez et al., 2022; Kumsao & Youpensuk, 2021; Reyes et al., 2020; Urgiles et al., 2021).
Studies related to AMF and coffee have demonstrated the effectiveness in their association with the root system, efficiently stimulating a percentage of 198 % growth more than the control, an increase from 77.45 to 239.31 % in the leaf area, biomass increases between 85.51 and 201.64 % more than non-inoculated plants (Del Aguila et al., 2018; Hernández et al., 2018; Vallejos et al., 2019), yield increase of 17% and 16% in the first and second year respectively (Bustamante et al., 2022), and a percentage lower than 52.61% in the incidence of infections compared to the control (Vallejos et al., 2021).
The functionality of AMF can be enhanced by a better understanding of their interactions with the abundance of edaphic microbial communities involved in N cycling (functional groups of Proteolytic (PRO), Amonifiers (AMO), Ammonium-Oxidizing (AOX), Nitrite-Oxidizing (NOX), and Denitrifying (DEN) microorganisms). These functional groups are fundamental for the maintenance and improvement of the fertility and functionality of agricultural ecosystems (Wang et al., 2017; Xu et al., 2022). In addition, they contribute to the fixation of atmospheric N2 and turn it into assimilable forms for other organisms (Oros et al., 2020). Although there has been a significant advance in comprehending the biodiversity and function of microorganisms and plant species associated with the agroforestry systems, employing fungi, bacteria, and ecological principles to increase productivity (Angelica et al., 2019; Oros et al., 2020; Turrini et al., 2018), a deeper understanding of the information about the relationship between AMF and functional groups of soil microorganisms associated with the N cycle is necessary.
Therefore, the general objective of this research was to evaluate the effects of AMF on the abundance of functional groups associated with the N cycle of soils with coffee plantations in Sasaima, Cundinamarca Department, Colombia. Some specific objectives were set to achieve this goal: i) to evaluate the response of physicochemical parameters of the soil associated with AMF in coffee plantations; ii) to test the abundance of PRO, AMO, AOX, NOX, and DEN microorganisms in soils with coffee plantations, with and without AMF; and iii) to analyze comprehensively the response of the previous parameters in soils, with and without AMF.
Materials and methods
Study area
The study was carried out in the Andean region of Colombia, in the municipality of Sasaima, Cundinamarca, Colombia (04°56′44″N, 74°25′12″W), at 1,119 m a.s.l., an average temperature of 22 °C and a medium-humid and very humid climate, during April 2018 (sampling 0), August 2018 (sampling 4), and December 2018 (sampling 8). According to the general soil study from the Instituto Geográfico Agustín Codazzi [IGAC] (2000), these soils are Typic Hapludands, and the area corresponds to a very humid premontane forest (bmh-PM).
Experimental design and sampling
Four plots with coffee plantations with an area of 25m2 were selected for this study. A different type of AMF was applied to each plot for eight months, with a monthly sampling frequency, as follows:
Plot 1. Commercial liquid AMF [CLM] with AMF-based biological inoculum belonging to the species composition Entrophospora colombiana, Glumus manihotis, Glumus intrarradices, and Glumus etunicatum, 820 spores/g respectively, with a ratio of 75-80 spores/g of water- soluble dry powder. For the solution, 0.05 kg per liter of water was applied, using 180 ml of this solution within the first 10 cm of soil depth around each coffee plant.
Plot 2. Commercial Solid AMF [CSM] containing spores, mycelium, and propagules (colonized roots, free mycelium, and spores) based on AMF, with six species distributed in equal proportion: Glomus fasciculatum, Scutellospora heterogama, Glomus mosseae, Glomus manihotis, Acaulospora rugosa, and Entrophospora colombiana, with a ratio of 300 spores/g in the inoculant; 10 g were applied within the first 10 cm of soil depth around each coffee plant.
-
Plot 3. Native AMF [NM] was obtained by extracting and isolating AMF spores from the soil in the study area. For spore extraction, the method proposed by Gerdeman and Nicolson (1963) and Sieversing (1984), as cited in Sánchez de Prager et al., 2010) was used briefly; a sample of 100 g of dry soil was sieved in moist through superimposed 75, 45, and 25 µm sieves. The soil sample retained in the last sieve was placed into tubes, adding 4 ml of sucrose 70%, and the sample was placed in the centrifuge at 3,500 rpm for 5 min. A dissociation of three phases was perceived: water-sucrose-soil. Then, the sucrose solution containing the spores was removed. Finally, the morphotypes were counted and identified by comparing the morphological characters with the help of a stereoscope: color, shape, and ornamentation.
These characteristics were compared with those detailed in the taxonomic keys (Peterson et al., 2004), obtaining a classification of the genera Acaulospora and Glomus. One hundred and twenty-nine spores were counted and multiplied in the soil of the study area and sown with fodder oat seeds (Avena sativa L.). Finally, a ratio of 25 spores/g of soil was obtained; then, 10 g of this soil was applied within the first 10 cm depth around each coffee plant.
Plot 4. Control [C], corresponding to the plot where AMF was not applied.
Three composite samples of rhizospheric soil were taken in months 0, 4, and 8 of AMF application. Ten sub-samples containing 500 g of rhizospheric soil each were taken from the first 20 cm for each plot, homogenized to form a composite sample per plot. This procedure was repeated three times per plot until obtaining three composite samples. The samples were labeled, transported, and processed in the shortest time (seven days). The samples for analysis of microorganisms were kept at 4 °C.
Physicochemical analysis
The physicochemical analyses of soils were carried out according to the following methods: for humidity, the gravimetric method; for pH, the potentiometer method with a 1:1 ratio of water/soil (v/w); for organic carbon (OC), the Walkley-Black method; for cation exchange capacity (CEC), ammonium acetate 1 N and neutral; and for nitrogen (N), the Kjeldahl method. Finally, t phosphorus (P) was determined by the Bray II method.
The abundance of functional groups of the nitrogen cycle
We used the most probable number (MPN) technique (Cochran, 1950) and the methods and means proposed by Cañón et al. (2012) to determine the abundance of the five functional groups of microorganisms associated with N metabolism. This procedure was performed in triplicate. For each replica, five tubes were used per dilution, performing dilutions of -1 to 10 to find the proper reading dilution. For PRO and AOX, we used the Winogradsky solution as a base (Pochon, 1954) at a rate of 50 ml/L and the trace-elements solution at a rate of 1 ml/L. For PRO, we used gelatin [30 g/L] as the unique source of C and N with an incubation time of 15 days at 28 °C, CaCO3 [1 g/L] as the C source, and (NH4)2SO4 [0.5 g/L] as the N source, with an incubation time of 30 days at 28 °C (Flórez & Uribe, 2011). For AMO, we used bacteriological peptone [2 g/L] as the culture medium and unique source of C and N, with an incubation time of 24 h at 30 °C (IGAC, 2006). We used KNO2 [0.006 g/L], K2HPO4 [1 g/L], FeSO4 ∙ 7H2O [0.03 g/L], NaCl [0.3 g/L], MgSO4 ∙ 7H2O [0.1 g/L], CaCO3 [1 g/L], and CaCl2 [0.3 g/L] as the culture media to isolate NOX, with an incubation time of 96 h at 28 °C (IGAC, 2006). Finally, we used a mixture of two stock solutions, A and B, as the culture medium for the DEN, with the following composition: Solution A: KNO3 [1 g/L], C4H8N2O3 [1 g/L], and C27H28Br2O5S 1% [5 ml] and Solution B: Na3C6H5O7 [8.5 g/L], KH2PO4 [1 g/L], MgSO4 [1 g/L], CaCl2 ∙ 6H2O [0.2 g/L], and FeCl3 ∙ 6H2O [0.05 g/L]. The incubation was 72 h at 28 °C (IGAC, 2006).
To estimate the presence or absence of microorganisms we used gelatin liquefaction (PRO), NH₄⁺ production by Nessler’s reagent (AMO), the production of NO₂⁻ measured with the Griess Ilosvay’s reagent (AOX), the consumption of NO₂⁻ measured with the Griess Ilosvay’s reagent (NOX), and the production of gas with the Durham bells and blue coloration change (DEN). The counts were expressed in CFU/g.
Statistical analysis
First, we evaluated the relationships among the different variables (pH, CEC, OC, N, P, PRO, AMO, AOX, NOX, and DEN) and the assumptions of normality and homogeneity of variances using the Kolmogorov-Smirnov and Bartlett’s tests, respectively. Then, we carried out the Kruskal-Wallis test with a post hoc analysis of Kruskal to determine significant differences. All tests were performed in the stats R package (R Core Team, 2019). Finally, a principal component analysis (PCA) was performed at the facto extra package (Kassambara & Mundt, 2017) to analyze the behavior of the variables under study.
Results
Physicochemical parameters
The humidity percentage of the soils varied from 39.3-56.0%, representing a high content of humidity. In turn, pH varied between 5.1-5.3, indicating a very acidic soil, which is usual for soils with coffee plantations (Rodríguez et al., 2019; Silva et al., 2017). OC was in the range of 6.4-8.1 % showing high availability of carbon in the soil (Rodríguez et al., 2016). N was 0.5-0.6%, reflecting the high content of this element in the ground. CEC ranged between 25.9 and 28.5 cmol*ckg-1, which implies a soil with good fertility (Dai et al., 2018). Finally, P varied from 1 to 1.6 ppm, meaning deficient levels of this element are present in the soil under study (Ticona, 2018).
According to the information in Table 1, which relates the physicochemical parameters with the study plots, moisture and pH did not show statistically significant differences concerning the treatments under study, while the percentage of OC increased significantly in plot NM compared to plot C. There were also increases in the content of OC in plots CLM and SM compared to plot C. However, N and CEC did not show significant changes. On the other hand, P content (Table 1) showed a statistically significant increase in plot NM compared to plot C.
Table 1. Physical-chemical parameters of all sampling cycles of the soils analyzed in each plot
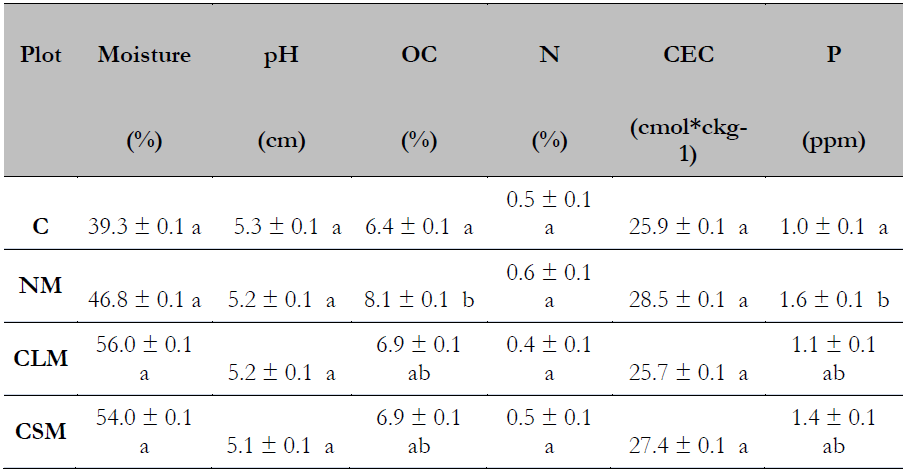
Note.Data with different letters showed statistically significant differences, and data with the same letters showed no statistically significant differences (P ≤ 0.05). Each determination corresponds to the mean of the triplicate of months 0, 4, and 8.Abbreviation: C: Control plot - no AMF application, NM: Plot with Native AMF application, CLM: Plot with Commercial liquid AMFapplication, CSM: Plot with Commercial Solid AMF application, OC: Organic carbon, N: Total nitrogen, CEC: Cation exchange Capacity, and P: Phosphorus.
Source: Elaborated by the authors.
Functional groups of the nitrogen cycle in the soil
The results presented in Table 2 show no statistically significant differences in the abundance of functional groups associated with the N cycle over the months of treatment, both for the control plot and for the plots with AMF inoculate application. However, the PRO microorganisms increased significantly in plot C between months 0 and 8, and the NOX decreased in plot NM during months 0 to 8.
Table 2. Functional groups associated with the edaphic nitrogen metabolism in all the plots of soil analyzed by month
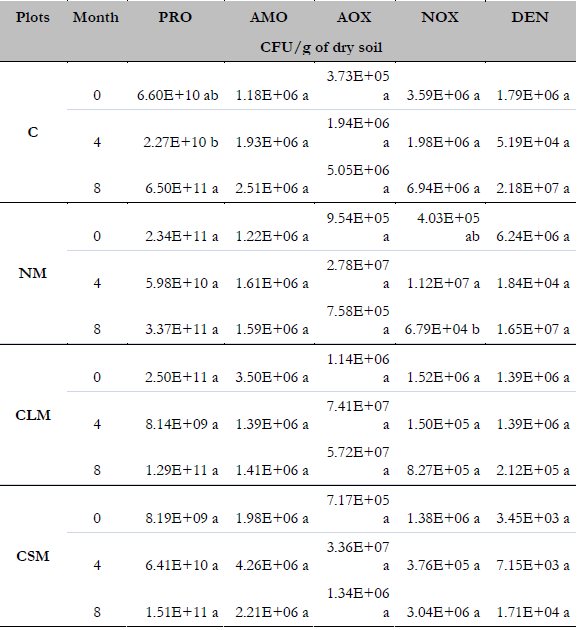
Note.Data with different letters showed statistically significant differences, and data with the same letters showed no statistically significant differences (P ≤ 0.05).Abbreviation: C: Control plot - no AMF application, NM: Plot with Native AMF application, CLM: Plot with Commercial Liquid AMF application, CSM: Plot with Commercial Solid AMF application, PRO: Proteolytic, NOX: Nitrite-oxidizing, AOX: Ammonium-oxidizing, AMO: Ammonifying bacteria, and DEN: Denitrifying bacteria
Source: Elaborated by the authors.
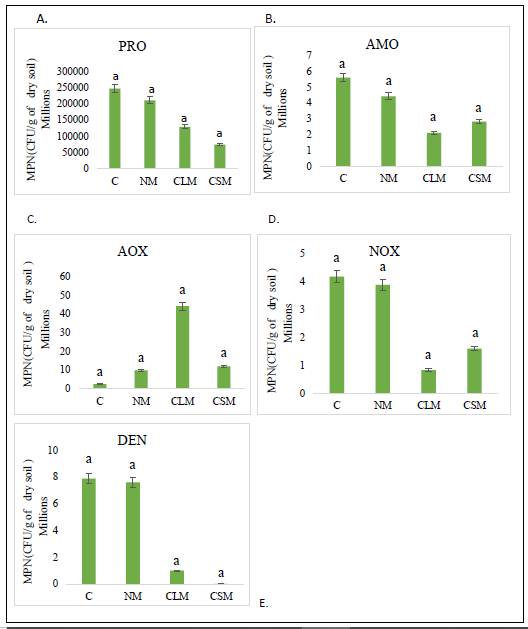
As shown in Figure 1, there were no significant differences between the abundance of the functional groups of microorganisms in the N cycle and the treatments used. Greater abundance is observed in PRO, AMO, NOX, and DEN in plot C, followed by plot NM; however, these differences were not statistically significant. The lowest abundance of AMO and NOX microorganisms is found in plot CLM. As for PRO and DEN, the lowest abundance was registered in plot CSM. On the other hand, AOX shows the highest abundance in plot CLM and the lowest in plot C. All these differences were not statistically significant.
Principal component analysis
The cumulative variance for the PCA is 86.5%, indicating a relatively good representation of the respective data. There was a correlation with OC, N, CEC, and P parameters in plot NM (Figure 2). As for plots CLM and CSM, there is a more significant correlation with humidity, AOX, and AMO parameters. On the other hand, plot C reflects a more significant correlation with pH, while the functional groups PRO, DEN, and NOX show an inverse correlation with plots CLM and CSM.
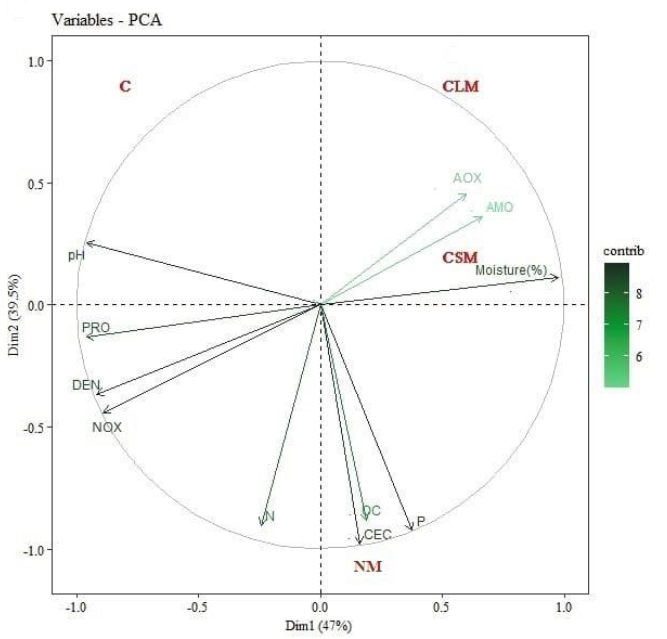
Source: Elaborated by the authors.
Figure 2. Principal component analysis. Abbreviations: Proteolytic (PRO), ammonifying bacteria (AMO), ammonium-oxidizing bacteria (AOX), nitrite-oxidizing bacteria (NOX), denitrifying bacteria (DEN), control (C) without AMF application, native AMF application (NM), commercial liquid AMF application (CLM), and commercial solid AMF application (CSM).
Source: Elaborated by the authors.
Figure 1. Abundance of functional groups in the nitrogen cycleNote. data with different letters showed statistically significant differences, data with the same letters showed no statistically significant differences (P ≤ 0.05).Abbreviation: A. Proteolytic (PRO) B. Ammonifying Bacteria (AMO). C. Ammonium Oxidizing (AOX). D. Nitrite oxidizing (NOX). E. Denitrifying Bacteria (DEN). In all the graphs, the names of the plots go on the x-axis (C: Control without AMF application, NM: Native AMF application, CLM: Commercial AMF in suspension application, and CSM: Commercial Solid AMF application).
Discussion
The application of AMF to the soil under study showed a significant increase in the percentage of OC, which is consistent with the study by Yang et al. (2017), who reported that AMF has a significantly positive correlation with OC in the soil. Additionally, Martínez et al. (2008) and Fofana et al. (2022) mentioned that AMF could contribute to the content of organic carbon due to the mass of mycelia and glomalin production being insoluble and resistant to decomposition. Xu et al. (2019) also claimed that glomalin produced by AMF improves the physicochemical properties of the rhizosphere soil. The results reflect a significant increase in P in the soils with AMF application, coinciding with Turrini et al. (2018), Sbrana et al. (2022), and Zhao et al. (2021), who indicated that AMF contributes to the nutrition of plants, particularly P uptake, which in turn increases the P content available in the soil (Viera et al., 2017). According to Vallejos et al. (2019), this happens because the hyphae system allows the plant to better capture and absorb low available nutrients such as P. The formation of AMF favors the growth and reproduction of P-solubilizing microorganisms, which subsequently increase the content of organic P in the soil (Xu et al., 2019). This behavior is in line with the study by Avila et al. (2020). They showed the same significant increase of phosphate solubilizing microorganisms in soils with AMF application.
The increases of P and OC were more significant in the plot wherenative AMF (NM) was applied, which is in line with Kouadio et al.’s (2017), who attributed greater capacity and efficiency when searching and transporting nutrients to the adaptation of AMF native to soil conditions, compared to the adaptation of AMF external to the soil. Native AMF also significantly increases cellulolytic bacteria populations, allowing organic matter improvement that consequently benefits soil nutrients (Avila et al., 2020). This relationship among plots NM, P, OC, CEC, and N is confirmed in the PCA.
On the other hand, the soil in the plots with AMF inoculation did not show significant differences in the abundance of functional groups of the N cycle compared to the control plot and the course of time of the treatment. In another study, nitrifying bacteria (NOX, AOX) in soils under AMF and non-AMF corn cultivation did not show differences over time between treatments, according to the authors, because AMF affects specific groups of bacteria (Veresoglou et al., 2018). In contrast, the similar behavior of these AMFs may be due to the minor or transient effects on larger soil communities, and the need for assessment for more extended periods (Cavagnaro et al., 2007). However, differences in the behavior of these communities over shorter periods have been demonstrated (Marschner et al., 2001). In addition, the potential of AMF on nitrifying microorganisms is distinctly associated, as there have been increases, no effects, or decreases in these populations (Suchitra et al., 2020; Teutscherova et al., 2019; Veresoglou et al., 2012).
On the contrary, the study by Cañón et al. (2012) showed significant changes among the functional groups of the N cycle (PRO, AMO, AOX, NOX, and DEN) and their treatments, with a lower abundance of these microorganisms in the páramo area, compared to potato cultivation and livestock using the same method as the one in this study.
Regarding the PCA, the results reflect a relationship between the plots with the application of commercial AMF (CSM, CLM), the functional groups of the nitrogen cycle (AMO, AOX), and the humidity, which coincides with the fact that AMF inoculation increases the activity of protease and urease. These enzymes are closely linked to N transformation in the soil and the increase of effective N in the rhizosphere soil. Moreover, AMF reinforces s the capacity of N fixation in the soil and accelerates organic N transformation (Xu et al., 2019).
In Quadrant I, the most correlated variables were AMO and AOX, reflecting a behavior contrary to the one in the study by Cañón et al. (2012), who reported a close link between PRO, AMO, and NOX with the mineralization process. PRO initially degrades organic matter into amino acids and later is transformed by the activity of AMO into the ammonium substrate needed for nitrification, where AOX and NOX act, demonstrating a possible relationship between AMO and AOX.
Quadrant III showed a more significant correlation between PRO, DEN, and NOX. However, Cañón et al. (2012) found a more significant correlation between the processes mediated by DEN and AOX microorganisms. Because of increased temperature, pH, and agricultural productivity that facilitate the conversion of ammonium into ammonia, the rapid volatilization into N increases the substrate for ammonium oxidation.
For their part, Gómez and Luna (2018) suggested that a decrease in the proteolytic and ammonizing activity increases the denitrification processes, which partly agrees with the inverse relationship between DEN and AMO in this study. Waghmode et al. (2018), in their study of Warming in an Agricultural Ecosystem, observed that decreased DEN increases AOX, which agrees with the inverse relationship between AOX and DEN noted in the PCA.
In fact, according to Cañón et al. (2012), the counts via crops can be limiting. Some microorganisms are not cultivable, preventing the determination of the effect within the N cycle in the soil, a factor that could also influence the results of this study. Similarly, Pedraza et al. (2010) reported that the various microbial transformations are driven by the activity rather than by the number of microorganisms involved in these transformations.
Conclusions
When evaluating the research question about the response of the abundance of the functional groups (PRO, AMO, AOX, NOX, and DEN) of the N cycle and the physicochemical parameters in soils with and without mycorrhizae application in coffee plantations, we found that the levels of OC and P increased significantly in the plots with AMF application compared to the control plot, being statistically significant and showing the highest values in plot NM. Although the PCA reported relations between AMO and NOX in plots CLM and CSM, the functional groups associated with the N cycle did not have statistical differences among the treatments under study.

