INTRODUCTION
Marine oil spills can damage the environment and upset the life and economy of coastal communities dependent on the quality of water for their industries, tourism, and fishing (Novelli et al., 2020). Almost half of the oil in the ocean is the result of natural oil spills, and the other half stems from anthropogenic sources, including high-seas industrial activities and oil runoffs and spills mainly occurring during oil transport and production (Morrison et al., 2018).
Recent studies focused on the fate of oil in the aqueous, sedimentary, and ground matrix require analytical methods to be able to provide enough information for the evaluation and cleanup of oil-contaminated sites. However, there is no single approach that can quickly, reliably, and simultaneously characterize fractions of crude oil, as well as specific compound classes and individual compounds in each fraction (Wang et al., 2010). A large amount of techniques to take hydrocarbon (HC) footprints and identify sources have been used (Gallota and Chistensen, 2012).
The retention time (TR), or perhaps more accurately, the retention volume is almost the most important characteristic of the chromatogram for analytical chemists, given that it is the key to separate, identify, and quantify the analytes of interest within any complex medium. As a matter of fact, the identification of peaks is initially achieved by comparing the retention time of the unknown component against a standard. As a consequence of this primordial consideration great efforts have been made towards developing standard chromatographic methods that allow the identification of components in the mix in terms of the retention times (Etxebarría et al., 2009). The objective of this work is to identify the area of greatest or least contamination by hydrocarbons in the Santiago de Cuba Bay, based on the quantitative and qualitative analysis of the retention time values obtained through the chromatographic method.
AREA OF STUDY
The bay of Santiago de Cuba (Figure 1) is the second most polluted in the country. It is located on the southern coast of the island of Cuba in front of the Caribbean Sea. Its entrance is between Punta Morrillo and Punta Socapa (19° 58’ 10” N y 75° 52’ 19” W), and it constitutes a bag-type bay. To the north and northwest of the bay, the city of Santiago de Cuba has developed, along with its port, the second most important in the country. The entrance of the bay is through a narrow, 13-20 m deep channel. The notorious Granma and Ratones cays are located at the entrance channel. The total surface of the bay is approximately 12 km², with an average depth of 8 m and a maximum value of 21 m. The perimeter of the coastline, including the cays, is 41 km.
Numerous industries are located at the bay, which is why a daily wastewater volume of approximately 3 x 10⁶ m3 arrives there. Additionally, within the territory of the basin, they are more than 60 000 households, with a population of more than 200 000 inhabitants. Numerous facilities with diverse uses occupy the margins of the bay, which has caused conflicts around the use of space and resources between the different users in the area. This situation is also influenced by the fact that the Santiago bay, due to its own features, is a closed bay with a narrow communication channel (Fernández et al., 2015).
MATERIALS AND METHODS
Water sampling was conducted at four points of the Santiago de Cuba Bay, which were previously chosen according to their vulnerability in terms of hydrocarbon spills in the area: the “Hermanos Díaz” oil refinery (Figure 1, Point 1), the “Antonio Maceo” thermoelectric plant (RENTE) (Figure 1, Point 2), the dock of the Guillermón Moncada port (Figure 1, Point 3), and “La Estrella” beach (Figure 1, Point 4). For sample collection, the sampling and conservation techniques were employed (NC ISO, 1994). The sampling was conducted between March and May, 2019. Due to the diversity of factors interfering the variation of the properties of seawater (Castillo et al., 2013), as well as the variation that may exist with regard to the degree of contamination by hydrocarbons, the samples were taken for four consecutive days.
To achieve the removal of the organic extracts from the samples, the separating funnel method was applied using petroleum ether as a solvent. Then, 3 g of silica gel were added to eliminate the excess water from the extracted samples, and the petroleum ether extracts were reduced with a rotary evaporator, thus obtaining more concentrated samples for their later analysis in the gas chromatograph.
The analysis by means of gas chromatography coupled with a Flame Ionization Detector (FID) was performed in an Agilent Technologies 7890A chromatograph (Australia) using an HP-5 fused silica capillary column (30 m length, 0.320 mm internal diameter, 0.25 µm face thickness) and hydrogen as a carrier gas, which operates under the following conditions established in the analysis program for petroleum derivatives: the temperature program using this analysis was 60 °C (3 min), rising to 300 °C with a temperature ramp of 10 °C/min, and remaining isothermal at this temperature for 15 min; the injector and the flame ionization detector were maintained at 280 and 310 °C, respectively; the hydrogen flow was of 30 ml/min, the airflow was 400 ml/min, its initial volume in the column was of 1.5 ml/min, and its pressure was 27.42 KPa; each run lasted for 42 min.
The retention times a particular characteristic of hydrocarbons, in the area/height of the peak is proportional to its quantity. The instrument used in these analyses was an FID that is very sensitive to hydrocarbons. Given that the FID also responds to several compounds, these substances must be removed through a process of separation and cleaning with silica gel or alumina (EPA, 2014).
With the objective of comparing the time tension values obtained from the samples taken, five hydrocarbon patterns were prepared using seawater and certified HC prototypes from the “Hermanos Díaz” oil refinery (diesel, fuel oil, engine oil, turbofuel, and kerosene). Each one was prepared from the individual compounds. They were separated in five 1 000 mL beakers, and they were later mixed with hydrocarbon samples (10 μL), sealed with wax paper, and stirred. To compare the TR values of the process samples, the TR values standard samples are determined. The fractions in the range in carbon number are the following: kerosene and turbofuel, C11-C13; diesel, C13-C17; fuel oil, C19-C25; engine oil, C20-C45.
This comparative analysis between the TR values of the samples and the standards (match), will allow identifying different HCs present at each point. The degree of match per point is listed, and the median values are then determined in order to understand central tendency of this set of numbers.
RESULTS
TR determination through the gas chromatography method
The retention time of each of the samples taken (previously concentrated) was determined. It is a time in minutes during which an analyte is retained inside the column, according to its affinity with the internal coating, that is, the time it takes for it to go through the column, which may vary by altering the flow of the carrier gas (this case, hydrogen). The time retention values are extracted from the highest intensity peaks in terms of their height (Jaramillo and Dorman, 2019). In this case of the chromatography method for petroleum derivatives (Alzaga, 2004), the heaviest compound will be retained for greater fraction of time, thus giving way for the most volatile ones to be the first peaks to appear in the chromatogram. An example of the results provided by the equipment (table and graph with the time retention and curve area and height values) obtained from each sampling point during the monitoring days (Table 1 and figure 2).
In all cases, the highest peak that represents the first four retention times is petroleum ether, which, because it is the most volatile, it is the first to leave the column. Between the retention time values of 5-40 min (approximately), peaks start to rise, thus evidencing the presence of the extracted compounds carried by the petroleum ether. Therefore, the first four TR values are not considered in the performed analysis.
Time retention values obtained from the standard samples
To compare the TR values of the processed samples, the TR values of the standard samples are determined. The HC standards were analyzed under the same conditions as the samples.
An example of the results provided by the equipment is shown (table and graph the retention time, height and area of the curve) obtained from each of the standard samples (table 2 and figure 3).
Just like the mixtures, the highest peak that represents the first four retention times is the petroleum ether; as it is the most volatile, it is the first to leave the column. The TR values are between 5 and 40 min (approximately), and peaks from different pure hydrocarbons that constitute the fuels used as standards are observed. In the case of turbofuel and kerosene, most of the pure hydrocarbons that comprise these fuels leave the column within the shortest time interval, given that they are the most volatile among the analyzed standards, unlike engine and fuel oil, which, as they contain the heaviest hydrocarbon fractions, they have the highest retention times. For each sample and standard, there is a graph and a table that includes the previous chromatogram reading data. Such values will be compared against each other to find matching TR values.
DISCUSSION
Qualitative analysis of the TR values obtained each sampling point with HC standards
TR is a characteristic of hydrocarbons in particular, and the area/height of the peak is proportional to their quantity, which is why it is one of the features that identify and individualize them. (Etxebarría et al., 2009). TR can be used as a parameter for identification. Chromatographic TRs are typical of the compounds they represent, but they are not unique.
The identification of peaks is initially achieved by comparing the retention time of the unknown compound to a standard. A match in the retention times of a sample and a reference substance can be used as a partial criterion in the construction of an identity profile, but it is insufficient in and of itself to establish identity. The absolute TRs of a given compound vary from one chromatogram to the next. Studies on methodologies that perfect the differences caused between TR intervals are deeply examined to achieve greater accuracy (Jaramillo and Dorman, 2019). Up next, the matching TR values between the samples taken at each point and the standard samples are shown to demonstrate the presence of a fuel type at a specific point and day.
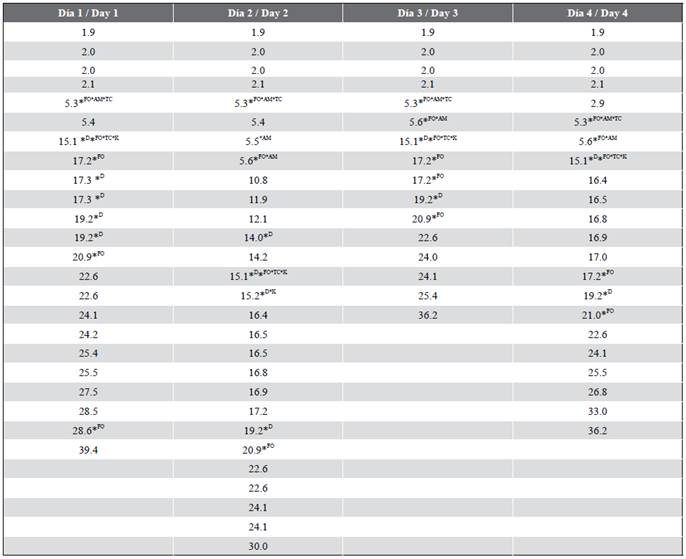
Table 3 Matches between the TR values of the samples and standards (Point 1, La Estrella Beach).

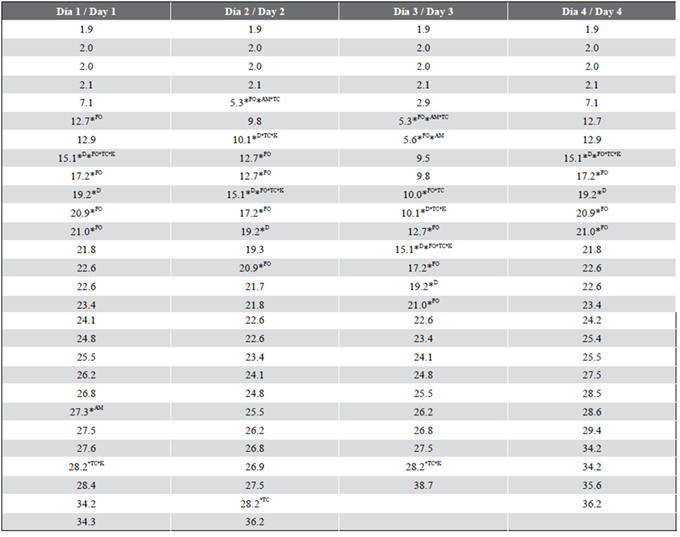
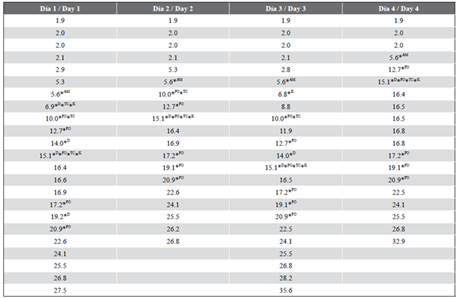
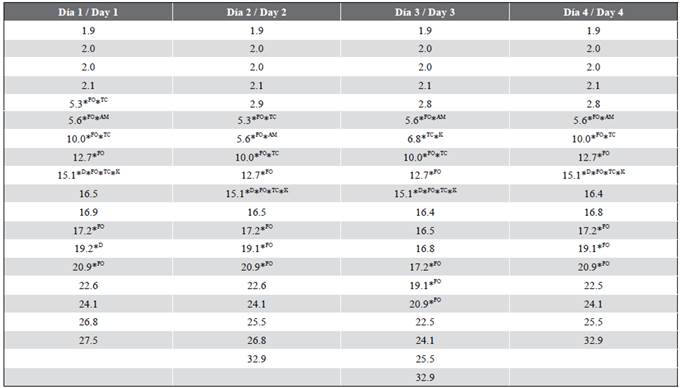
*FO: TR match with a fuel oil standard; *D: TR match with a diesel standard; *K: TR match with a kerosene standard; *TC: TR match with a turbine fuel standard; *AM: TR match with an engine oil standard
Table 4 Matches between the TR values of the samples and standards (Point 2, Guillermón Moncada port)

Table 5 Matches between the TR values of the samples and standards (Point 3, Hermanos Díaz refinery).

Table 6 Matches between the TR values of the samples and standards (Point 4, RENTE thermoelectric plant).

The number of matches is presented to determine which has the greatest amount at each sampling point. To this effect, the following data are listed (Table 7): number of matches, mean values, and median maximum value.
The median values are graphed (Figure 4) because potential measurement errors are minimized with these values, as well as any interference caused by external variables at the time of sampling.
The analysis indicates that, at the four sampling points, the HC with the highest presence was fuel oil, followed by turbo fuel. The rest were found at lower quantities. The sampling points are independently analyzed below:
Point 1, La Estrella Beach: Here, fuel oil is the main pollutant, followed by diesel and oil in the same amount; Point 2, Guillermón Moncada Port: Turbofuel and diesel are present in lower fractions, with fuel oil being present as the main pollutant; Point 3, Hermanos Díaz Refinery: At this point, fuel oil prevails as the main pollutant, followed by turbofuel; Point 4, Antonio Maceo Thermoelectric Plant (RENTE): Here, fuel oil is present at the main pollutant, reporting the highest match amount values.
Quantitative analysis of the TR values obtained at each sampling point with HC standards
After developing the gas chromatography method and obtaining the results from the reading of fuel samples and standards, the area beneath the curve in the chromatogram graphs is analyzed (directly proportional to peak height and the concentration of the present hydrocarbon compound) (Wang et al., 2010).
Point 1. La Estrella Beach: Although La Estrella Beach is far from the internal lobe of the bay, which is referenced as the most polluted part, it is important to highlight that its peaks are not so far from those present at other sampling points, since it contains four pollutant agents, and the heights of its peaks are significant, as it has a considerable concentration. Taking into account that this is a bathing area, appropriate measures should be taken either to minimize the degree of contamination by HC or forbid bathing and re-creation activities, given the negative effects caused by HCs in human health.
Point 2. Guillermón Moncada Port: Here, several amounts of significant peaks are reported, which represent a greater concentration with respect to the rest of the points. This is therefore the most polluted place and the one with the highest amount of polluting agents among the analyzed points, given the main access, docking, anchoring, and/or movement maneuvers of vessels to and from the facilities located in the interior channel and the maneuvering basin of the port.
Point 3. Hermanos Díaz Refinery: Although it was expected that this point reported the highest amounts of polluting agents and the highest peaks, given that this is the industry where crude oil and its derivatives are processed, it was not so; the height of the peaks and their area are smaller than those of points 2 and 3. It is believed that this is due to the fact that the productive process was paralyzed at the time of monitoring, which is why it will be conducted at another productive stage, and the obtained values will be compared.
Point 4. Antonio Maceo Thermoelectric Plant (RENTE): It has the highest amount of significant peaks (most of them belonging to fuel oil), which is why this HC prevails as the greatest polluting agent, although not in a greater concentration with respect to the rest of the analyzed points, given the constant handling of fuels in the development of its productive activity. Similarly, at this point, the samples were taken precisely at the outlet of the cooling water, which is located next to the refinery’s oxidation pond, which demonstrates that, even with a paused refinement process, the emissions caused by the oxidation pond are not being controlled.
CONCLUSION
The analysis performed indicates that fuel oil is the most polluting agent present in the bay. Guillermón Moncada Port and the Antionio Maceo Thermoelectric Plant (RENTE) turned out to be the points with the highest degree of contamination, reporting the highest number of significant peaks. The study allows the government authorities to take measures in order to focus the efforts on minimizing pollution in the critical areas found.
RECOMMENDATIONS
It is recommended to carry out similar studies in periods when the refinery undergoes an active production process and to compare the results with those hereby obtained, as well as to increase the number of sampling days and dates and compare the results with those of the present work. In the same way, comparing the results with other physicochemical analysis methods is advised to deepen the studies on this type of pollution and increase the number of standard samples.


 text in


