


 text in
  English (pdf)
 Article in xml format
 Article references
 Send this article by e-mail
 Cited by SciELO
  Cited by Google
  Similars in
SciELO
Similars in
SciELO  Similars in Google
 Permalink
INTRODUCTION
Climatic fluctuations during periods of atmospheric and oceanic warming have altered the dynamic patterns of glaciers and, as a result, significant losses of small and large-scale ice reserves have been observed in the glaciomarine environments of the Antarctic Peninsula during recent years (Hogg et al., 2017). The region of the Antarctic Peninsula is considered a sensitive area to climate change (Turner et al., 2005), and the effects of these changes are expected to be more noticeable. The Danco Coast corresponds to a transition zone between a subpolar to a polar climate (Anderson and Domack, 1991; Griffith and Anderson, 1989), so a greater sensitivity to changes could be expected. The seasonality of the subpolar Antarctic peninsula modulates the melting of glaciers, being spring-summer where the highest melting rates are observed and, with it, a greater discharge of sediments in the coastal area, a situation contrary to the autumn-winter period (Domack and Ishman, 1993; Domack and McClennen, 1996). Therefore, an advance of the subpolar zone towards the south could have an impact on the glacial behavior of the transition and polar zone, and the production of glaciomarine sediments.
The formation of water of glacial origin that moves and extends off the coast carrying sediments, is known as a “sediment plume” and is characterized by being a body of cold water, sometimes of high density (Domack and Ishman, 1993; Domack and Williams, 1990; Domack et al., 1994). The importance of these plumes is that they contribute to elucidate the coastal glaciomarine dynamics and, in turn, provide clues about the climatic evolution of the region (Domack and Ishman, 1993; Yoo et al., 2015), also considering that a higher concentration of particles may be associated with greater glacial melt (Yoo et al., 2015, Rodrigo et al., 2016). Also, sediment-laden water can affect marine biological productivity and bottom benthic organisms (Dierssen et al., 2002; Marín et al., 2013). Therefore, this work is intended to contribute to the study of modern glacial behavior under an environment of accelerated climate change, through the identification and characterization of the sediment plumes that come from tidal glaciers, thus complementing the study of Rodrigo et al. (2016) associated with small bays and fjords of the Danco Coast.
MATERIALS AND METHODS
Study area
The Danco Coast is located on the western side of the Antarctic Peninsula, between the bays of Guesalaga and Flandres (Figure 1) (according to SHOA charts No. 15300 and 15400). On this coast, there are a series of fjords that make up large bays such as Hughes, Charlotte, Wilhelmina, Andvord, and Flandres, but there are also other smaller ones, which can be part of the larger ones or appear isolated. They are of interest for this work: Duarte, Eckener, Frei (Recess), Wilhelmina (small central bay with no name), and Paraíso (Paradise) (Figure 1), where the main glacier comes into contact with seawater (glacier tidal).
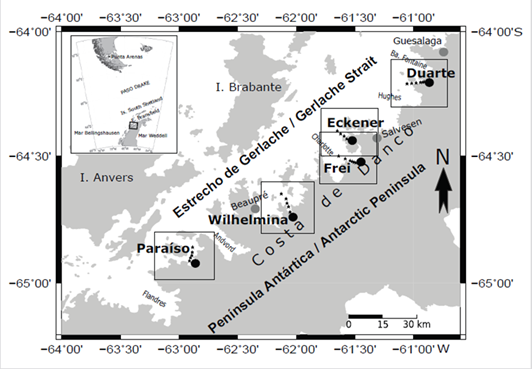
Figure 1 Study area and the Danco Coast on the Antarctic Peninsula. In the boxes and names in bold letters, the bays studied in this work. Stars indicate the positions of the oceanographic stations carried out during the First Colombian Scientific Expedition to the Antarctic, between January and February 2015.
The waters of the bays on the Danco Coast are connected to those of the Gerlaché Strait. In general, the strait receives water from two main sectors: from the Bellingshausen Sea and the Bransfield Strait. From the southern sector, that is, through the Bellingshausen Sea, water enters that is relatively warm and less saline concerning the strait and, from the northern sector, there is a contribution of waters that flow from the Weddell Sea, which are modified in the Bransfield Strait, these are cold and more saline than those of Gerlaché (Sangrá et al., 2011). The predominant surface flows of the Gerlaché Strait closely resemble the flow patterns of the Bransfield, in which both are composed of: a flow in a north direction towards the South Shetland Islands, a minor flow in the west direction, and a flow in the Northeast direction towards the continental margin of the Antarctic Peninsula (Zhou et al., 2002). It would be the latter that would have the greatest influence on the bays and fjords of the Danco Coast. However, the superficial and deep circulation patterns of the Gerlaché Strait sector are complex, this is mainly due to the geomorphology that exists (islands, channels, fjords, bays, sill, and shallow passes, among others), but it is possible to identify two types of circulation: a barotropic on the surface and another baroclinic that occurs between 200 to 400 m depth (García et al., 2002; Sangrá et al., 2011). Then, the typical water column of the strait consists of a surface layer composed of Zonal Transitional Waters with Influence of the Bellingshausen Sea (TBW) and a deep layer (reaching the bottom) called Zonal Transitional Waters with Influence of the Weddell Sea (TWW). The latter is conditioned by intrusions from the Circumpolar Deep Water (CDW) which could be expected to penetrate from the west. Also, TBW is expected to have cooler and fresher waters than the Bransfield Strait, due to the influence of freshwater that enters from local glaciers (García et al., 2002). Occasionally, in the southwest sector of the Gerlaché Strait, characteristic properties of Antarctic Surface Water (AASW) are detected, however, it has lower salinity than its analog located in the east of the Bellingshausen Sea.
Data acquisition and processing
During Colombia’s First Scientific Expedition to Antarctica, carried out between January 17 and February 1, 2015, aboard the Colombian Navy ship ARC “20 de Julio”, hydrographic measurements (temperature, salinity, pressure, and turbidity), entering 5 bays off the Danco Coast, Antarctic Peninsula (Figure 1) with a smaller vessel of the ship (Defender type boat), trying to get as close as possible to the front of the main glacier in each bay (Table 1). Measurements were made with an SBE 19 Plus V2 CTD-T profiler, up to a maximum depth of ~ 100 m.
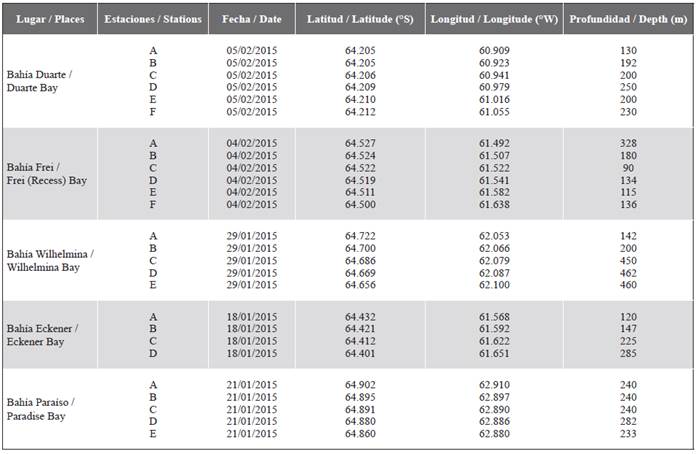
Table 1 Geographic locations of the oceanographic stations in the bays, during the First Antarctic Scientific Expedition of Colombia, 2015.
Turbidity measurements were obtained using an ECO NTU sensor (0-1000 NTU) with a sensitivity of 0.02 NTU. To compare and discuss these results with other works that used different methodologies to determine the concentration of particles, the NTU values were transformed to mg / l according to the procedure described in Rodrigo et al. (2016), who used water samples obtained during this cruise. The equation resulting from the said methodology is shown below:
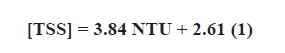
Where TSS: Concentration of total suspended solids in mg / l; NTU: Nephelometric Turbidity Units.
The anomalous hydrographic and turbidity data in the water column were removed manually. To determine the tide during the measurements, the Tide Model Driver 1.2 (TMD) (Padman, 2005) was used, corroborated with in situ measurements of a tide gauge installed at the Gabriel González Videla base in Bahía Paraíso (Molares, 2015).
RESULTS
Oceanographic characteristics of the bays
Ensenada Duarte
Hydrographic measurements were made during the low tide. It was found that the surface temperature values oscillated between a minimum of -0.3 ° C in the intermediate sector of the section and a maximum of 0.5 ° C, in the sector closest and furthest from the bay (Figure 2a). These colder surface sectors were also associated with lower salinity values (Figure 2b). The highest temperatures (between 0.3 ° C and 0.5 ° C) were located in a superficial layer up to ~ 20 m deep and were associated with low values of salinity (< 33.5) and density (< 1027.5 kg/m3) (Figure 2a, b, c). On the other hand, cooler surface temperatures (between -0.3 ° C and -0.5 ° C) were found between stations C and E, where the entrance to a canal is located on the north coast (Figure 2 map). The distribution of temperatures between 20 and 40 m deep, followed a different pattern to the surface level, characterized by lower temperatures in the vicinity of the glacier front (between -0.3 and -0.2 ° C), while the higher temperatures were observed in the sector furthest from the bay (between -0.2 and 0.1 ° C). Below 40 m depth, the density and salinity variables increased gradually, however, high turbidity values were observed in the stations closest to the front of the glacier (between stations A and D, Figure 2d), of which their maximum (> 1 NTU) was located very close to the glacier, forming a cloudy plume that interstratified, generating an intermediate nepheloid layer between 60 and 80 m deep.
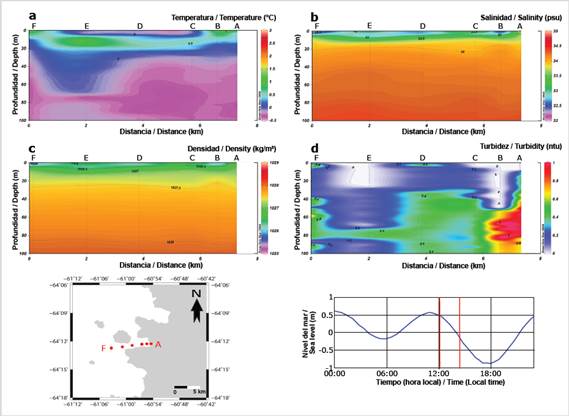
Figure 2 Oceanographic sections for Duarte Bay. a. temperature vs. depth. b. salinity vs. depth. c. density vs. depth. d. turbidity vs. depth. The location and identification of oceanographic stations are also indicated on the map on the lower left side and the variations in sea level during the measurement period (between red bars), on the lower right side.
Eckener
The hydrographic measurements were made during the ebb tide-low tide. It was found that the surface temperature values oscillated between a minimum of 1.8 ° C, in the vicinity of the glacier (station A), and a maximum of 2.8 ° C in the sector furthest from the bay (Figure 3a). These were associated with low salinity values (< 34) and density (< 1027.5 kg/m3) (Figure 3b, c), which presented a steep gradient with lower values towards station A, which were also associated with higher values of turbidity (> 0.5 NTU). The temperature distribution below the 20 m level had a similar pattern to the surface level, characterized by lower temperatures in the vicinity of the glacier (between -0.1 and 0.2 ° C), its core being between 60 and 80 m of depth. The turbidity distribution showed different detachments of intermediate nepheloid layers (between 40 and 80 m) that were also correlated with detachments of lower temperature water from the glacier front (Figure 3d).
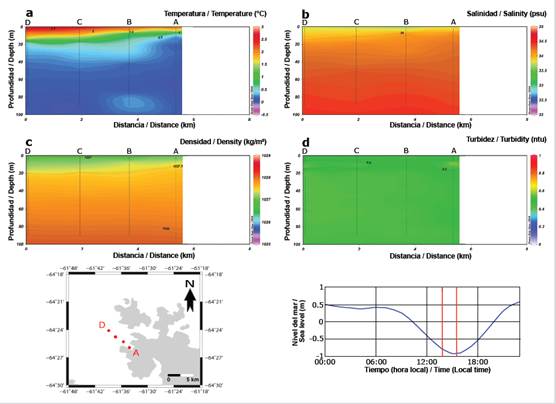
Figure 3 Oceanographic sections for Eckener Bay. a. temperature vs. depth. b. salinity vs. depth. c. density vs. depth. d. turbidity vs. depth. The location and identification of oceanographic stations are also indicated on the map on the lower left side and the variations in sea level during the measurement period (between red bars), on the lower right side.
Frei (Recess) Bay
The hydrographic measurements were made during the high tide-discharge tide. It was found that the surface temperature values ranged between a minimum of 0.7 ° C near the coast and a maximum of 2.3 ° C in the sector furthest from the front of the glacier (Figure 4a). The highest temperatures (between 1.5 ° C and 2.3 ° C) were distributed with a tongue shape, indicating an inflow of warmer surface waters from the strait towards the glacier (between stations B and F). On the other hand, colder temperatures (between 0.7 ° C and 1.2 ° C) were found between stations A and B, indicating a flow of water from the glacier, correlating with lower values of salinity and density (< 34) and density (< 1027.5 kg/m3) (Figure 3b, c), but with even smaller nuclei, possibly associated with surface water inputs from other glaciers. The distribution of temperatures between the level of 20 to 80 m depth, followed a pattern similar to the surface, characterized by presenting lower temperatures inside the bay (between -0.2 and 0.1 ° C). These low temperatures were associated with high turbidity values shown by the plume coming from the glacial discharge, mainly between 30 and 60 m depth (Figure 4d). This plume sloped upward and reached maximum depths at ~ 40 m (> 0.7 NTU), extending from station A to D.
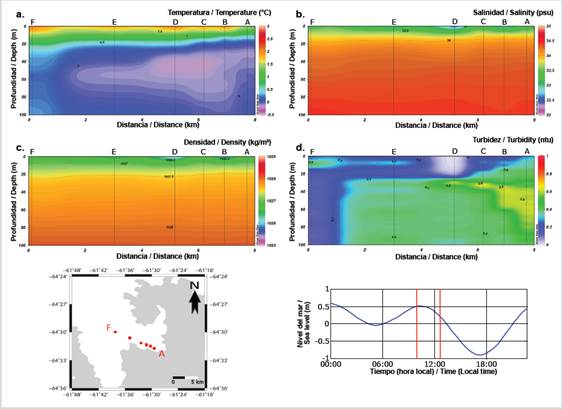
Figure 4 Oceanographic sections for Frei (Recess) Bay. a. temperature vs. depth. b. salinity vs. depth. c. density vs. depth. d. turbidity vs. depth. The location and identification of oceanographic stations are also indicated on the map on the lower left side and the variations in sea level during the measurement period (between red bars), on the lower right side.
Wilhelmina Bay
Hydrographic measurements were made during the flood tide. It was found that the surface temperature values oscillated between a minimum of 0.5 ° C inside the bay and a maximum of 1.7 ° C in the furthest sector (Figure 5a). The coldest temperatures (between 0.5 ° C and 1 ° C) were found closer to the front of the glacier (stations A and B), contrary to the salinity whose highest values were found outside the bay (~ 33.8) (station E, Figure 5b), also for the surface density (Figure 5c), but with smaller nuclei in the central part of the section (< 1027.5 kg/m3) (station C). In general, near the front of the glacier, the isohaline was inclined, indicating the tendency that the less saline water at the bottom tends towards the surface.
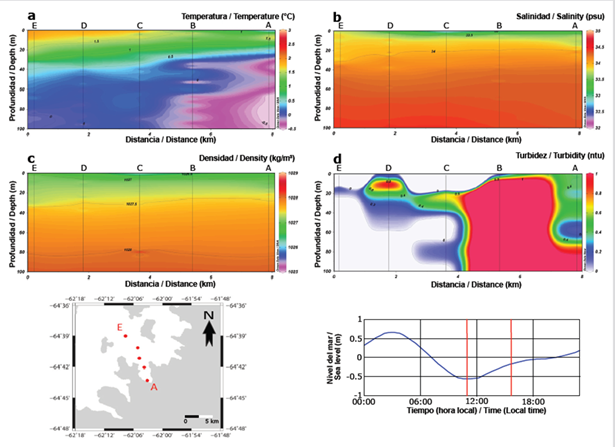
Figure 5 Oceanographic sections for Wilhelmina Bay. a. temperature vs. depth. b. salinity vs. depth. c. density vs. depth. d. turbidity vs. depth. The location and identification of oceanographic stations are also indicated on the map on the lower left side and the variations in sea level during the measurement period (between red bars), on the lower right side.
The surface turbidity values presented a maximum of 0.4 NTU in the vicinity of the glacier front. The turbidity distribution showed an upwelling of turbid waters from the glacier, extending to station B, where the highest values of all the studied bays were recorded (> 2.5 NTU) and with a homogeneous vertical distribution (Figure 5d). Two other takeoffs were produced from intermediate nepheloid layers from the main upwelling with lower turbidity values: between 20 and 40 m and between 70 and 90 m depth, at station C. At station D, a more turbid subsurface core was also observed, which can be associated with the influence of other glaciers in the bay.
Paradise Bay
Hydrographic measurements were made during the flood tide. It was found that the surface temperature values oscillated between a minimum of 0.2 ° C in the southern part of the bay (station A, closest to the Oscar Cove glacier) and a maximum of 1.2 ° C in the northern sector (station E) (Figure 6a). The highest temperatures (between 0.9 ° C and 1.2 ° C) were distributed on the surface from stations E to B, which were also associated with lower salinities and densities (Figure 3b, c). In the sector of station A, during the measurements, the seawater on the surface was almost completely covered by pieces of ice, which could explain the low temperatures on the surface, however, this situation was not correlated with higher values of turbidity (Figure 6d), but rather on the subsurface. Thus, the turbidity distribution showed a subsurface nepheloid layer from the discharge plume of the Oscar Cove glacier (> 0.3 NTU). In the sector furthest from the bay, from ~ 50 m and towards greater depths, turbidity was observed with homogeneous values (< 0.2 NTU) in all stations.
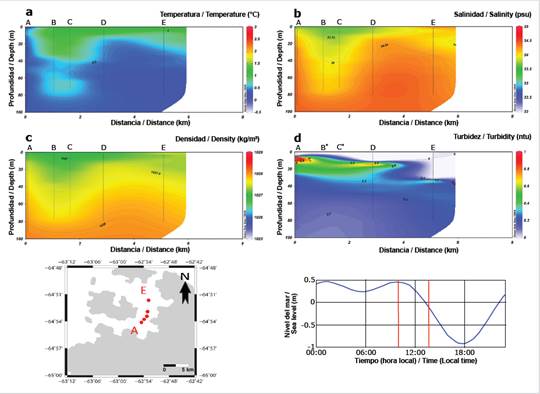
Figure 6 Oceanographic sections for Paradise Bay. a. temperature vs. depth. b. salinity vs. depth. c. density vs. depth. d. turbidity vs. depth. The location and identification of oceanographic stations are also indicated on the map on the lower left side and the variations in sea level during the measurement period (between red bars), on the lower right side. B * and C *: stations without turbidity data.
T-S diagrams
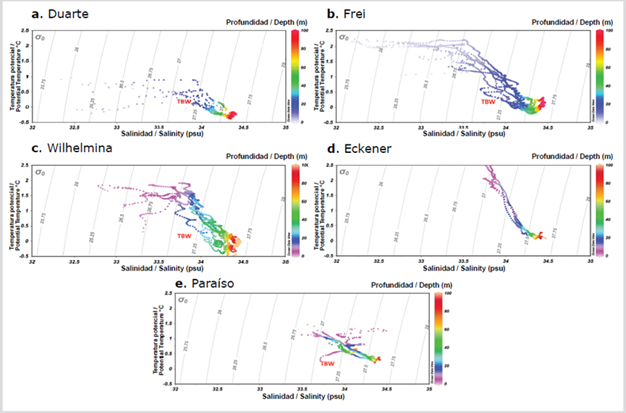
Figure 7 shows the temperature-salinity (T-S) diagrams for the studied bays. Although the distribution patterns of the T-S data are relatively similar, there were some differences. Bahía Duarte presented the lowest temperatures and surface salinities, but the latter were similar to those of Bahía Frei. Also, the pattern of this last bay was more similar to Wilhelmina. All the bays presented similar salinity values for the deeper waters, however, their temperatures were somewhat different. The Eckener and Paraíso (Paradise) patterns were the most different from the others, possibly due to the more direct influence of the waters of the Geerlaché Strait for the former and, for the latter, influence of the formation/melting of sea ice. In all bays, except in Eckener bay, the influence of Zonal Transitional Water with Influence of the superficial Bellingshausen Sea (TBW) was found, according to reference values of García et al. (2002), although according to T-S ranges presented by Huneke et al. (2013). Eckener could also have a minor influence on TBW.
DISCUSSION
The results of this work confirm and coincide with those found by Rodrigo et al. (2016) regarding the presence and characteristics of sediment plumes in bays and fjords of the Danco Coast, which were identifiable by their high values in the concentration of particles and by their association with tongues of cold water. Sediment plumes off the Danco Coast were a common phenomenon and permanent for the period of the measurements, and independent of the characteristics of the size of the bays-fjords and glaciers (Rodrigo et al., 2016), however, the particle concentration values obtained in this work were a little lower (in average 2.9 mg/l) to those obtained by Domack and Williams (1990) and Domack and Ishman (1993), who obtained data from the major fjords of the Danco Coast (on average 3.0 mg / l), but with very high (> 7.0 mg / l) (Table 2), which is consistent with the complexity of those bays or fjords where several tidal glaciers of greater proportions converge with possibly greater subglacial flows and through crevasses, also including the greater concentration of larger icebergs that can carry a higher sediment load (Domack and Ishman, 1993). On the other hand, the highest measured particle concentration values in the region are found on King George Island (South Shetland Islands), which is in accordance with the type of glaciomarine environment associated with a subpolar climate, which would produce a higher sedimentary flow from tidal glaciers (Anderson and Domack, 1991; Powell and Domack, 2002). Yoo et al. (2015) found similar structures of the sediment plumes with those of this work and associated them directly with the glacial melt, but unlike our study area that corresponds to a dry climate, in King George the meltwater discharge may be affected by rainwater, it is also observable the runoff of water on land through streams that carry sediments to the sea and small waterfalls from some glaciers.
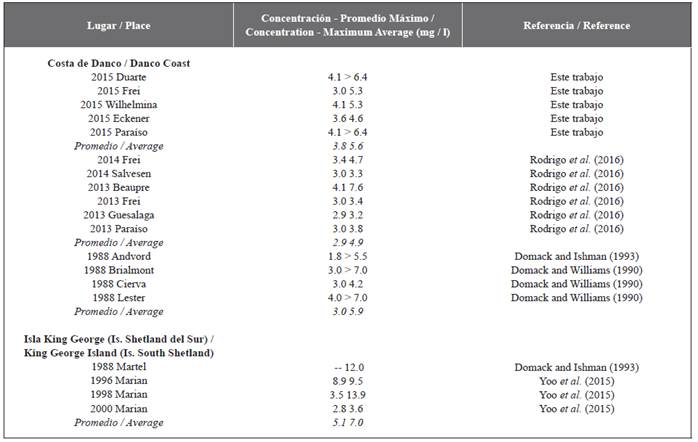
Although the comparisons of the concentration values may not be entirely correct due to the error of each unit conversion method, the different types of instruments, techniques for determining the number of particles, and differences in the periods of measurement, it is found that the trends agree with the characteristics of the different types of glaciomarine environments. Perhaps only the comparison with the results obtained by Rodrigo et al. (2016) is more reliable since the same type of instrument and methodology was used. In general, in this work, higher mean particle concentration values were obtained than those of Rodrigo et al. (2016) (Table 2). Also, comparing the temporal variability of Frei (Recess) Bay, which was the only bay where measurements were made for three consecutive years, it was observed that the particle concentration values increased over time (maximum in 2013: 3.4 mg / l; in 2014: 4.7 mg / l and in 2015: 5.3 mg / l) (Table 2), although for this work (2015), there were dumping tidal conditions that could help increase sedimentary flow (Figure 8), as demonstrated by Yoon et al. (2015) and Rodrigo et al. (2016). Other hypotheses that could contribute to the variability of the sedimentary flow characteristics towards the bay are changes in the dynamics of the glacial drainage basin due to the disappearance of a part of the Larsen B ice shelf in 2002 (eg Rignot et al., 2004), or more directly by greater local glacial melt (Powell and Domack, 2002; Pichlmaier et al., 2004) due to the intrusion of warmer waters coming from the Gerlaché Strait. The influence of other phenomena at other scales that could change the temperature in the air and the sea, such as an El Niño-Southern Oscillation event (Meridith et al., 2008; Rahaman et al., 2019) and changes in the Southern Annular Mode phase (Marshall, 2003; Marshall, 2007). However, the thermal structure in Frei (Recess) Bay did not seem to have changed much, maintaining the spatial distribution patterns and temperature values, therefore, the local marine response could be slower in the face of regional ocean-atmosphere changes and their teleconnections. However, Yoon et al. (2015) observed that the glacial melt response is sensitive and relatively fast with short-term meteorological phenomena such as the aforementioned rains and with seasonal variability, therefore, climatic phenomena at other scales could affect glacial behavior, a situation not yet well understood by the lack of the corresponding studies.
On the other hand, the general thermal characteristics of the bays were maintained if they are grouped latitudinally in north, center, and south. In the northern sector, where the Guesalaga (Curtiss) and Duarte bays are located, temperatures were generally colder (Figure 9a) and less saline, which could be associated with an influence of zone transitional waters of the Weddell Sea (TWW) (García et al., 2002; Sangrá et al., 2011), but the TS diagrams did not show this influence directly, so it could also be due to a greater generation of cold meltwater from the glaciers, as this area is closer to the subpolar climate (Anderson and Domack, 1991). On the other hand, higher surface temperatures were found in the central bays (Figure 9b), especially from their middle to distal part from the glacier front, but they presented a much cooler bottom sedimentary flow. This could be associated with a greater contribution of subglacial meltwater that formed a cold and sediment-laden plume. It is not clear what could cause this greater melting in the central zone of the Danco Coast, but as mentioned above, it could be thought of as a dynamic factor associated with the loss of ice shelves on the Weddell Sea side or intrusions of warmer water bodies from the Bellingshausen Sea, which is possible due to the TBW water identification. During the cruise of the Colombia’s First Scientific Expedition to Antarctica, it was possible to determine the distribution of sea surface temperature of the Gerlaché Strait (Molares, 2015; 2016), and a difference of ~ 1.25 ° C was observed between the northern-south sector and central, also described by Giraldo et al. (2019). Although Eckener belongs to the central sector, its oceanographic characteristics were different from the other bays and it had a similar structure to those of the south (Figure 9c), but of course, not in the ranges of temperature values. This could have occurred due to the direct influence of the waters of the strait and its relative isolation, as it happens in Paradise Bay.
Although Rodrigo et al. (2016) and Yoo et al. (2015), showed a model for the flow of sediment from glacial fronts based on two main plumes: a shallow one less saline, and a deeper one with a more concentrated core of sediment particles; the results of this study showed some differences (Figure 8), such as higher concentrations of particles and spatial extensions of the plumes, either horizontally (up to 6 km) and vertically (sometimes almost the entire water column). In any case, the more concentrated core of the plumes began to lose concentration more rapidly once it left the bay, possibly affected by other current or circulation systems (Trusel et al., 2010), including the effect of the wind outside the bay.
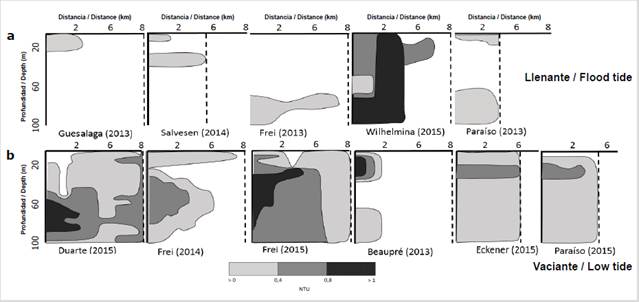
Figure 8 Representative diagram of the sediment plume structures, where the grayscale (lower bar) indicates the turbidity concentration values (NTU) and the segmented line represents the furthest oceanographic station in each bay. Results from Rodrigo et al. (2016) for comparison. The schemes are grouped according to the type of dominant tide during the measurements.
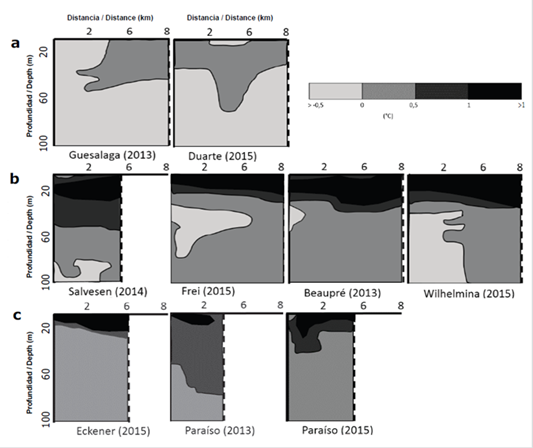
Figure 9 Representative diagram of the thermal structure of the glaciomarine environment of the bays, where the grayscale (upper bar) indicates the temperature values (°C) and the segmented line represents the most distant oceanographic station in each bay. Results from Rodrigo et al. (2016) for comparison.
Concerning vertical spatial changes, the case of Wilhelmina and Frei (this study, 2015) (Figure 8) is notorious, where it was observed that the discharge of glacial water rose, reaching the surface in Wilhelmina and being interbedded near the surface of Frei. According to the Mugford and Dowdeswell (2011) model, this type of particle flow behavior is associated with a higher sedimentary contribution subglacially, in this case, with values higher than 6.5 mg/l (1 NTU), where the plume traveled from the base of the glacier front, maintaining a certain distance with it and as it ascended, the buoyant force dominated more and more and, in this way,, the trajectory towards the surface was curved upwards. Once on the surface, it spread with the surface currents (Figure 10). This is how, as the plume rises and stratifies, sedimentary particles fall to the bottom that is released from it, creating sedimentary deposits and characteristic sub-bottom stratigraphy (Powell and Domack, 2002). From the observation of the results obtained by Rodrigo et al. (2016) and this work, in general, the model for the Danco coastal zone would be that of Figure 10a, considering a low subglacial flow of sediments and water, however, in the central zone of the study area, there is a greater flow of subglacial sediment that could be described by the medium discharge flow model (Figure 10b) or the high discharge flow model (Figure 10c). On the other hand, it must be considered that previously (Griffith and Anderson, 1989; Domack and Williams, 1990; DaSilva et al., 1997) it was thought that sediment plumes due to glacial melt were rare, however, this work and other recent (Yoo et al., 2015; Rodrigo et al., 2016) show the opposite, where possibly its role within the recent glaciomarine sedimentary processes of the Antarctic peninsula region, will acquire greater importance as sedimentary production is greater, which is directly correlated with climate change.
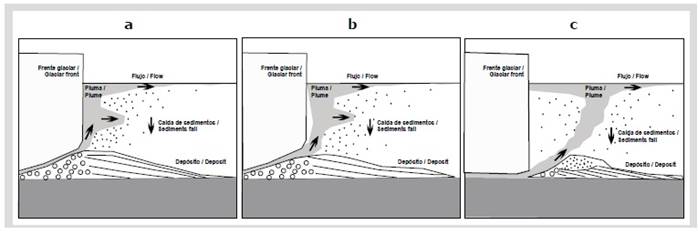
Figure 10 Models of subglacial sediment flow in the glaciomarine environment of fjords-bays, based on Mugford and Dowdeswell (2011), and Powell and Domack (2002). a. for flows with a low discharge of water and sediments. b. for flows with moderate water discharge and high sediment. c. for high discharge flows.
Finally, it follows that the sedimentary flows from the glacier fronts in the small bays of the Danco Coast have a variable spatial extension, as well as their concentration of sediments, which will depend mainly on the greater or lesser melting of the glaciers, which will contribute higher content of particles subglacially than by other mechanisms. The causes of glacial melt are the subject of additional studies, but it could be associated with warming atmospheric and intrusions of warmer water masses, without ruling out phenomena of dynamic adjustments of the glaciers on the Antarctic Peninsula.

