


 text in
  English (pdf)
 Article in xml format
 Article references
 Send this article by e-mail
 Cited by SciELO
  Cited by Google
  Similars in
SciELO
Similars in
SciELO  Similars in Google
 Permalink
INTRODUCTION
Climate change is defined as the change in climate patterns, mainly caused by the emission of greenhouse gases from natural systems and due to human activities (Faswy et al., 2020). Carbon dioxide emissions (CO2) make up the majority of anthropic emissions in the last 150 years, and they are caused by the combustion of hydrocarbons and coal (Barros and Camilloni, 2020). This change has been studied by means of land, aerial, and space observations, which has allowed recording the global and sea temperature increase, the sea level rise, and the loss of ice masses in poles and glaciers (Shaftel, 2021). Masselink and Gehrels (2015) state that the two most significant consequences of climate change on coastal ecosystems are changes in sea level and an increase in storms, both of which impact coastal erosion and flooding.
According to Dawahdi et al. (2019), the mean sea level “is defined as the level of the calm sea waters averaged over a specified period of time (months, years), such that the periodical effects of tides and other frequent causes, such as waves, are compensated for”. The mean sea level is determined by analyzing the data captured with a tide gauge, an instrument that allows recording the sea’s vertical movements (Pons Valls, 2009), as well as via techniques such as satellite altimetry (Vignudelli et al., 2021).
The sea level has constantly changed throughout known history. In the last 3000 years, the sea level has been stable, with an average global rise rate of 1.1 mm/year (Dawahidi et al., 2019). It is noteworthy that, in the case of the Caribbean, the sea level has never been estimated to be above the current level in the last 12000 years (Khan et al., 2017). According to the IPCC (2021), the global sea level increased by 0.20 m between 1901 and 2018, a process that has been accelerated in recent years, with the average rate going from 1.3 mm/year (1901-1971) to 1.9 mm/year (1971-2006), reaching 3.7 mm/year between 2006 and 2018. The sea level change is expected to affect approximately 70 % of the world’s coasts (Wong et al., 2014). Nevertheless, it should be highlighted that this increase and its corresponding rate are not uniform in time or space, with higher or lower values for different regions of the planet (Church et al., 2013).
In the case of Costa Rica, several works have warned about an accelerated coastal erosion in the Caribbean (Lizano and Gutiérrez, 2011; Lizano, 2013; Barrantes et al., 2020). For their part, Barrantes and Sandoval (2021) documented that, for Costa Rica’s southern Caribbean coast, 23.4 % of the coastline experiences a retreat greater than 0.5 mm/year. These authors highlighted significant erosive processes between Cieneguita and the Banano river mouth, with an average rate of - 1.58 m/year; in Cahuita, with - 2.15 m/year; in Manzanillo, with - 2.1 m/year; and in Gandoca, with -1.2 m/year. Additionally, they noted intense erosion in Puerto Vargas, on the order of - 3 m/year. They also warned that there are no studies indicating the current sea level change rate in the Caribbean coast, a parameter that could be linked to the severity of the observed processes.
In relation to the above, population growth, urbanization, migration, touristic development, and population displacement are causing an increase in the amount of exposed people and goods in the so-called low-elevation coastal zones (LECs). In other words, there is an increased number of people, infrastructure, and assets located in coastal areas, implying increased risk with regard to the sea level rise (IPCC, 2019). This research aims to determine the current sea level rise rate for the Costa Rican Caribbean, based on the available data from the Limón tide gauge station, given the lack of current estimations and the relevance of this issue in understanding the transformations taking place on the coast, such as coastal erosion and its potential consequences for the future of this region.
STUDY AREA
The tide gauge station analyzed in this study is located in the Caribbean littoral of Costa Rica, which is located between the coordinates 10° 55’ 47.53” N, 83° 40’ 2.75” W (north end) and 9° 34’ 20.38” N and 82° 33’ 53.24” W (south end). From a technical point of view, this littoral may be divided into two sections: the northern section, which features the characteristics of a passive continental margin and an extensive tectonic regime (normal faults), while the southern section exhibits a compressive regime with the occurrence of significant earthquakes (Alvarado and Cárdenas, 2016).
The climate of this region is characterized by the lack of a defined dry season, exhibiting two periods during which precipitations decrease, the first from February to March, and the second between September and October (Instituto Metereológico Nacional, 2017). As for the tides, the Caribbean coast of Costa Rica shows microtidal conditions, with the tides rarely above 30 cm and an average tide of 15 cm (Lizano, 2006). The waves originate from the Northeast, with average wave periods of 7.38 s and a distinctly local character. The highest energy levels occur in the first and last months of the year. Conversely, the lowest values are observed between September and October, when the trade winds decrease (Lizano, 2009).
The analyzed tide gauge station is located in the following approximate coordinates: 9.98° N, 83.02° W, corresponding to the location of the Alemán pier, in the city of Limón. Figure 1 shows the location of the station, denoted by a purple circle.

MATERIALS AND METHODS
The first step was to locate the records (both historical and current) of the tide gauge stations in the Caribbean of Costa Rica. After this review, it was determined that, throughout history, there have only been tide gauge facilities in the Limón harbor, whose records are not continuous in time but are segmented. Three data segments can be identified: from 1948 to 1968, from 1970 to 1981, and from 2009 to the present date, with spatial locations that do not coincide.
The data corresponding to the 1948-1968 period were downloaded from the website of the Permanent Service for Mean Sea Level (PSMSL), with a monthly frequency. The data on the 1970-1981 period were also downloaded from the aforementioned site, but they were not analyzed, following the recommendations of Torres Parra et al. (2006) , who stated that this dataset exhibits some inconsistencies, such as the lack of data for 1975 and the fact that there are 13 periods of at least one month with no data and reporting observation uncertainties of several centimeters. These data were discarded because the series is short and incomplete.
The data corresponding to the current tide gauge station (installed in 2009) were downloaded from the Sea Level Center (UHSLC), located in the University of Hawaii. This center publishes data with two qualities, the first one denoted as research quality (RQ), which corresponds to analyzed data that are regarded as a final version and can be used for research purposes, albeit published with a latency of one to two years depending of the processing applied to the observations; and the second one called fast delivery (FD), whose data have undergone a more basic quality control oriented towards the identification of observation errors. This type of data is published with a latency of one to two months. Thus, for the purposes of this research, RQ and FD data were combined, aiming to obtain a longer time series, given that the RQ data extend only until December 31, 2018. Table 1 shows the information of the analyzed datasets. As an additional detail, for the period from 1948 to 1968, the tide gauge station was assigned code 552 by the Global Sea Level Observing System (GLOSS).

Prior to determining the sea level change rates, the data were analyzed via two processes, both of them implemented in the MATLAB software. The first was a visual review of the data by means of plotting. This was done in order to identify inconsistencies in the data, as well as to obtain a base idea of the behavior of the series. The second process involved completing the series if it had any missing data. This was done via the fillmissing function. As an operator to complete the missing data, the data point prior to the missing one was used, considering the low percentage of unavailable data and the fact that these are spread throughout the entire series.Regarding the data for the 2009-2021 period, as indicated in Table 1, the frequency is daily, which is why, before the analysis, the average of each month was calculated using the retime function.
After the data review process, we calculated the data series trend, which is interpreted as the sea level change rate. To this effect, two approaches were implemented, both of them in the MATLAB software: The ‘traditional’ method, which consists of estimating the parameters of a simple linear regression of the dataset, where the slope of the equation corresponds to the sea level change rate (Jury, 2018).
Decomposing the time series, an approach based on the premise that a time series is made up of three components: trend, seasonality, and noise. Thus, the objective is to ‘isolate’ each element of the series and analyze components of interest. There are two general models for decomposing a time series: an additive model and a multiplicative model. In this case, it was assumed that the data series (Y) is the sum of the three components (Y = T + S + N, where Y is the series, T corresponds to the trend, S denotes seasonality, and N represents noise). To separate the components from the series, the singular spectrum analysis (SSA) method was applied, which spectrally and non-parametrically analyzes time series without relying on any a priori model (Goylandina et al., 2018).
As indicated by Goylandina et al. (2018), SSA is a multi-purpose analysis method, which enables its application in solving problems in a diversity of areas, particularly those associated with time series and digital images. An essential difference between SSA and other methods for analyzing time series, where it is assumed that there are trend and periodical signal components, lies in the fact that SSA does not require any trend model or prior knowledge regarding the number of periodical components and their frequencies. Therefore, for this research, we deemed it appropriate for the method itself to determine whether there were any trends and periodic signals in the datasets. Finally, after isolating the trend term, the slope representing the sea level change rate was estimated.
It should be considered that the sea level measured by a tide gauge is relative to the location of the instrument, which can be affected by vertical land motion, both subsidence and uplift, approximately to the same degree as the sea level rises or falls (Boretti, 2019). Not including this consideration could lead to over- or underestimation of the sea level in the medium and long term, as well as to making inadequate decisions to protect the coast or orient the adaptation process (Pabón and Lozano, 2005).
In this research, and based on the above, the GNSS station called LIMN was considered, which is located in the vicinity of the tide gauge station, with the purpose of correcting the sea level change rate regarding vertical land motion. This was only done for the results of the current tide gauge station (2009-2021), as there are no vertical land motion data for the historical tide gauge information (1952-1968 period).
The LIMN station is part of the Sirgas-Con network, a network of GNSS stations that are in operation and collecting data in a continuous manner. These data are processed by analysis centers that generate, among others, weekly solutions. In this vein, the weekly solutions of the LIMN station for the 2010-2023 period were downloaded, and, via a simple linear regression, the vertical velocity was estimated.
RESULTS
This section shows the results obtained after analyzing the data for the 1952-1968 period. Then, the results for the series covering the 2009-2021 period are presented.
Data analysis for the 1952-1968 period
Despite the fact that the PSMSL data series for the tide gauge station starts in 1948, it is segmented by missing data, with a first period between April 1951 and June 1952. Given this gap in the records, we decided to perform our calculations with the data from July 1952 to December 1968, an interval for which there is no data loss.
The results obtained by applying a simple linear regression to the dataset show a sea level change rate of 2.31 mm/year for this period, with an adjusted R2 value of 0.07, which means that linear regression only explains 7 % of the variability in the response variable. Figure 2 shows the corresponding trend line.
By applying the SSA method to decompose the series, the trend component was obtained (second graph in Figure 3), the seasonal component, and the noise (third and fourth graphs in Figure 3, respectively).

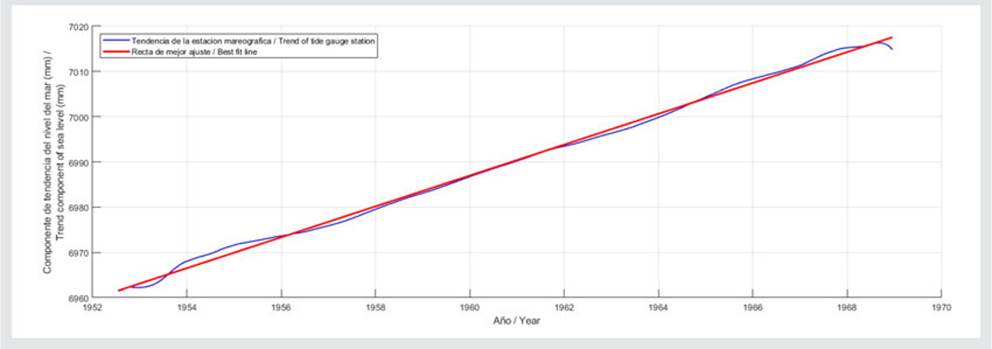
After applying simple linear regression to the trend component, a sea level change rate of 3.1 mm/year was obtained, with an adjusted R2 regression parameter value of 0.99. This means that the model allows almost fully explaining the response variable - in this case, the data series trend. Figure 4 shows the graphic output of the linear regression.
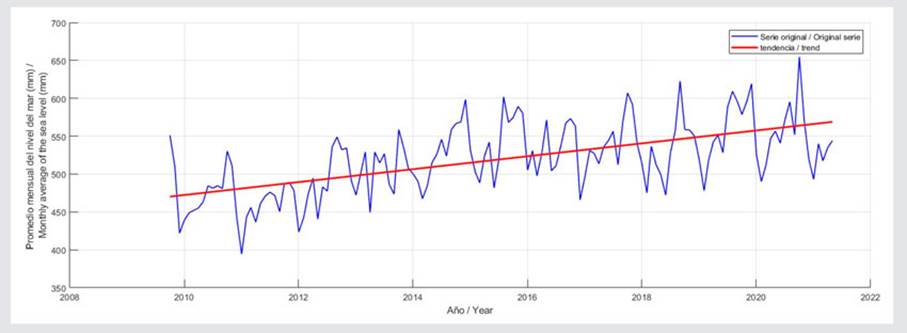
Data analysis for the 2009-2021 period
The data analyzed for this period correspond to the current tide gauge station, which was installed in 2009 and has been in operation since. The data were examined via the simple linear regression method, observing a sea level change rate of 8.51 mm/year. The value of the adjusted R2 regression parameter was 0.36, i.e., the model explains 36 % of the response variable’s variability. Figure 5 shows the data series and the trend line for the linear regression.
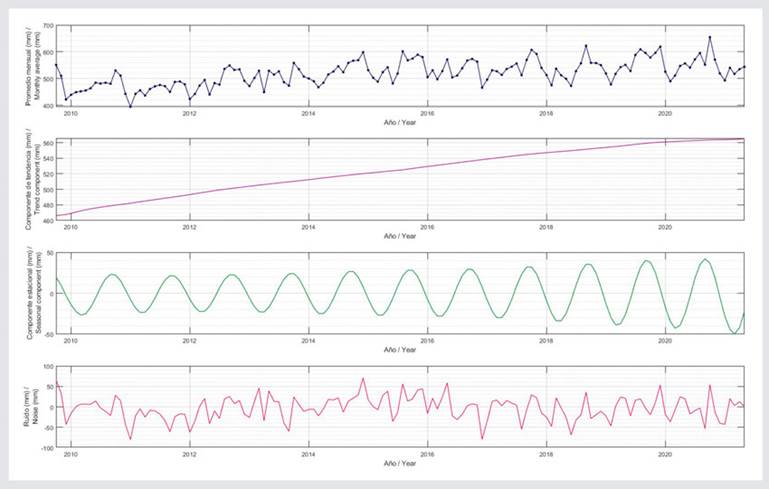
This dataset was also analyzed by using the SSA method to obtain the series components. These results are shown in Figure 6. Here, the second graph depicts the trend component.
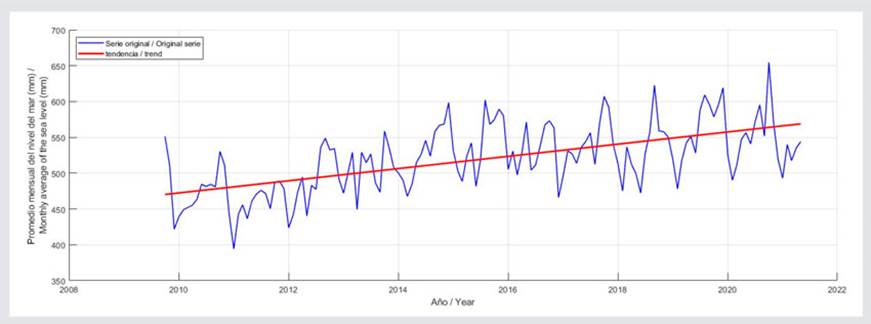
After applying a simple linear regression to the trend component, we obtained a sea level change rate of 8.61 mm/year, with an adjusted R2 parameter value of 0.99, indicating that the model allows almost fully explaining the response variable, i.e., the trend component of the data series. Figure 7 shows the trend component and the linear regression line.
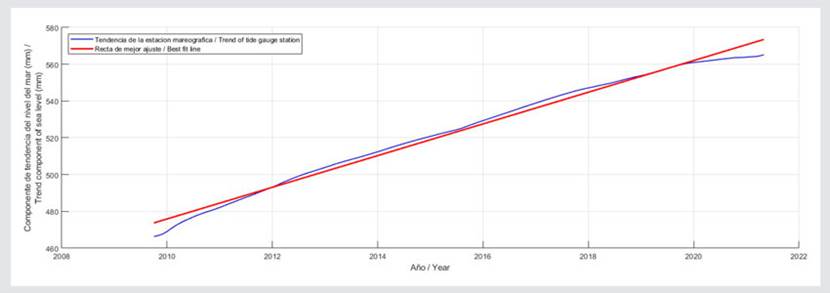
Figure 7. Graph of the simple linear regression applied to the trend component resulting from the decomposition for the 2009-2021 period.
When analyzing tide gauge data, it is necessary to consider vertical land motion (VLM), defined as the vertical movement of the surface and refers to the place where the tide gauge station is installed (Mohamed et al., 2019). For this research, the LIMN station was employed, measuring a vertical velocity of -4.33 mm/year. By taking the vertical velocity of the LIMN station as a reference VLM value and considering that the change rate estimated from the tide gauge data via the SSA method is 8.61 mm/year for the current station, a sea level change rate of 4.28 mm/year is obtained after subtracting the VLM. This procedure was suggested by Araújo (2017) for the Portuguese coast and by Boretti (2019) in the Caribbean coast of Mexico, considering variations attributable to local tectonics (Araújo, 2014). Table 2 summarizes the results obtained with the Limón tide gauge data, observing an increase in the sea level rise rate when comparing the historical and current rates.

DISCUSSION
With the purpose of comparing the results obtained, we elaborated a bibliographic compilation of publications that have also analyzed historical data of the Limón tide gauge. It should be clarified that no documents with results for the current tide gauge station were found. The summary of this compilation is presented in Table 3.

Table 3 shows some variations in our results with regard to the values presented in other works when applying the simple linear regression method to the original series. The publications by Ballestero and Salazar (2012) and Torres and Tsimplis (2013) , which analyze a longer period (1948-1969), recorded values similar and close to those of this work (Table 2). However, in Aubrey et al. (1988) , the value provided is slightly lower and with a negative sign; the publication failed to identify the cause of this difference, since the method used for data analysis was a simple linear regression, so it is possible to assume a typographical or data entry error.
In the case of the 1950-1968 series, the values provided by Palanisamy et al. (2012) do not differ much from those obtained in this work (Table 2). In general terms, it could be assumed that a longer data series yields lower values when applying the simple linear regression method, or that interruptions in the data series affect the results.
To analyze the results of the current tide gauge station, its location in the southern Caribbean of Costa Rica, where there is a compressive system composed of inverse faults and folds within the North Panama Deformed Belt, which begins behind the city of Limón and continues in Panama (Denyer and Kussmaul, 2000). This system changes direction and enters through the center of the country, generating the so-called Central Costa Rica Deformed Belt, which marks the northern border of the Panama microplate. This tectonic framework causes uplifts and deformation in both coasts, as a result of the accumulation of stress and its subsequent release (Norabuena et al., 2004; Protti et al., 2014). The case of the 1991 Limón earthquake is particularly interesting, wherein a coastal uplift oscillating between 30 cm and 1.5 m was recorded (Denyer et al., 1994). Thus, it is necessary to consider corrections related to the deformation effect of the seismic cycle at this location. These corrections were made based on the GNSS station called LIMN.
Regarding the interpretation of the results obtained for the current tide gauge station in Limón, there is an increase in the sea level rise rate when compared against the 1952-1968 period, with the current rate estimated at 4.28 mm/year after correcting for VLM. This is generally consistent with the global increase in this rate, which was estimated to be at 3.7 mm/year between 2006 and 2018 according to the IPCC (2021). Considering the length of the current record (11.6 years analyzed in this research), the two provided values (8.61 mm/year and 4.28 mm/year, without and with correction for VLM, respectively) have a high uncertainty that could only be reduced by extending the record length. Therefore, these data should not be used for the coast’s future urban development planning but should serve as a reference to confirm that there is a trend of increasing sea level that must be considered when studying the transformations occurring on the coast, such as accelerated coastal erosion (Barrantes and Sandoval, 2021) and the impact of severe wave events (Barrantes et al., 2020).
The above is supported by NOAA (2023), which states that, if at least 30 years of data from a tide gauge station are available, the expected error in calculating the sea level change rate will be ± 1.5 mm/year, whereas, if 60 years of data are available, the expected error will be reduced to ± 0.5 mm/year. Furthermore, it is indicated that, if the record includes at least 20 years of data, the expected error will be ± 3.0 mm/year. It is therefore necessary to consider that, although it did operate from 1948 to 1968, the Limón tide gauge station experienced a data loss of approximately two years, reducing the effective analyzable length of the series to 16 years. On the other hand, the current tide gauge station in Limón has been operating since 2009, but there was a data loss of approximately a year and a half between 2021 and 2022, interrupting the series.
As for the impact of sea level rise on the Costa Rican Caribbean, it should be noted that the Huetar Norte region, where the Caribbean coast is located, has the highest open unemployment rate in the country (11.7 %). Most of its coastal cantons or municipalities are in the lowest quintile of the country’s Human Development Index, with the exceptions of Pococí and Siquirres (second quintile), according to data from the Ministry of Planning and Economic Policy (2023). Apart from agro-extractive activities (e.g., banana and pineapple), subsistence agriculture, fishing, and - currently booming - tourism are the main sources of employment. The presence of important protected coastal areas is also notable, such as the Barra del Colorado Wildlife Refuge, Tortuguero National Park, Cahuita National Park, and the Gandoca-Manzanillo Mixed Wildlife Refuge. The city of Limón is also located here, which boasts the highest economic development in the region and is home to important commercial and tourist ports.
The authors believe that the most evident effect of the relative sea level rise rate, calculated as + 8.61 mm/year, is the coastline retreat in the southern Caribbean, with intense to severe rates found in Cieneguita, Cahuita, Manzanillo, and Gandoca (Barrantes and Sandoval, 2021), while the extent and the intensity of the erosion in the northern Caribbean is lower (Barrantes and Ortega, 2023), which may be associated with its location on a passive continental margin, likely exempting it from tectonic subsidence. This region (northern Caribbean) reports a sea level rise rate of 4.28 mm/year. The loss and reduction of beaches, as is the case of Cahuita, Manzanillo, and Gandoca (Sandoval and Barrantes, 2021), represents the loss of a valuable resource, which may be affecting sun and beach tourism. Likewise, in places such as Cieneguita and Puerto Vargas, this phenomenon leaves public infrastructure, as well as commercial and touristic establishments, exposed to flooding and marine sedimentation.
The sea level rise has brought forth an increase in the reach of severe wave events along the coast, such as the one in 2020, which penetrated up to the restaurant area in Playa Bonita and required the placement of sandbags to protect the entrance reception at Cahuita beach. Moreover, the walls of the city of Limón are being overrun by waves that now penetrate into the city.
Regarding the future, the lack of occupation planning in the coastal area is worrying, as exposure often comes with a high vulnerability for residents. In the face of climate change, high waves are more frequently expected, which may destroy the public infrastructure near the coastline, such as roads and electrical and drinking water transmission systems, in addition to increased degradation in the coastal ecosystems that constitute the first line of defense, i.e., coral reefs, coastal vegetation, and mangroves, which have already been affected.
CONCLUSIONS
This article shows the results obtained after analyzing historical data from the Limón tide gauge station for the 1952-1968 period. Even though these data are not currently valid, they remain relevant as they provide a baseline that allows for comparisons with current values. Regarding the modern tide gauge station, data for the 2009-2021 period were analyzed, obtaining a sea level change rate of 4.28 mm/year after correcting the tide gauge for vertical land motion.
It is concluded that, in the Caribbean coast of Costa Rica, there has been an increase in the sea level change rate, which has almost doubled. This was found by comparing the results of the two analyzed periods, which are approximately 50 years apart. This increase, as evidenced by other studies, may be associated with the erosive processes observed in some beaches of the Costa Rican Caribbean. Therefore, it is relevant to continue accumulating data in the tide gauge station, in order to increase the length of the time series and improve the quality of the estimated values.
As for the models applied, we believe that the time series decomposition method is an alternative for the study of tide gauge series, as separating the trend term from the seasonal one enables an analysis of the former, without the influence of the latter, which does not occur when applying linear regression to the original dataset.

