Introduction
Nanotechnology is a complex technology that seeks to change and analyze the properties of materials at the nanometric level, exploring multidisciplinary fields such as biology, physics, chemistry, and others. The growth related to nanotechnology and the implications that nanomaterials present due to their characteristics make necessary a protection system under the patent model that facilitates the knowledge and distribution of these types of products, their applications, and their incidence in the economy of a country. On the other hand, generating nanomaterials where different multidisciplinary areas are involved generates problems at the time of patenting 1.
Industrial Applications of Nanoparticles
One of the crucial aspects of nanotechnology has been the progress and research in agriculture, closing gaps to ensure food resources and meet the Sustainable Development Goals (SDGs) such as overcoming poverty, zero hunger, fight against climate change, among others 2; In this sense, the development of nanotechnology in this area has consolidated several actions for more sustainable processes, lower environmental impact, and development in the agricultural economy 3. Thus, in pursuing these objectives, we face a series of challenges such as nutrient deficiencies, stagnation of crop yields, climate change, and reduction of labor, not to mention uncontrolled fertilization that lowers the level of crops. Therefore, nanotechnology is used to evaluate aspects such as detection, recording, handling, storage, and control of soils and environmental conditions such as climate, water, soil condition, and consumer needs that improve agricultural performance 4) (5.
The rational use of nanoparticles can facilitate the growth of plants in their germination and growth process. In the case of the application of nano-fertilizers, these can improve conditions by reducing losses of mobile nutrients with slow-release processes. At the same time, nanosensors allow monitoring and data collection of soil and plant health for early detection in making quick decisions with proper management of pesticides, fertilizers, water, and soil, among others 6) (7.
Another area of great application of nanoparticles is related to the area of medicine. Here we find essential developments in drug delivery 8-10 and cancer treatment 11 in the diagnosis and treatment of diseases such as neurodegenerative diseases like Alzheimer’s, which is a public health problem in the world. In this case, nanotechnology offers alternatives of great interest 12.
From the environmental point of view, nanoparticles have generated an important option for removing pollutants, especially in the case of arsenic removal, a significant problem in India and China 13,14. Similarly, in wastewater treatment for the elimination of emerging contaminants that are present in minimum concentrations and are treated with adsorption and photocatalysis processes 15; However, we cannot ignore the impact that these materials generate due to their release into the environment, nanotoxicity and their impact on aquatic ecosystems 16.
The environmental crisis generated by producing energy through non-renewable fossil fuels and other exploitation techniques has made it necessary to search for alternatives that respond to the energy demand with a minimum environmental impact. One of these alternatives is the use of nanotechnology, where vital research is being carried out in the development of solar cells, Li-ion batteries, catalytic hydrogen evolution, etc., as well as in the development of new technologies for the production of energy 17,18, in energy storage systems 19, in fuel cells, sensors and structures that enhance energy efficiency 18,20,21.
The development of patents in the knowledge economy
A Patent is an exclusive right granted to an invention; it is a deal between an inventor and a government, where the inventor agrees to disclose his invention to the public, who will benefit from it. This privilege consists of the right to exclusively exploit the invention for a determined period, generally 20 years 22.
Scientific activity plays an essential role in industrial innovation and increasingly generates more confidence in different fields. Thus the knowledge economy is becoming an element recognized by professionals in the university-industry relationship, where it is becoming more critical and helpful daily. The upward growth in the development of patents by institutions has become remarkable due to the need not only to innovate but also to protect their products and generate some profitability in the process; without affecting the generation of scientific research 23. Countries such as India, with great potential in the development of nanotechnology, show a great interest in the development of patents in this area, analyzing not only the conditions for development but also intellectual property and regulatory issues that allow the commercial success of this technology 24. China generated a strong technological revolution almost 40 years ago with the economic reform of Deng Xiaoping. This reform provided economic support for learning-by-doing and mass-developing products and services. This methodology generated the need to protect these products and ideas with the development of patents and intellectual property management 25. In addition, if we compare the level of nanotechnology development, we find in the first place the United States, which since 2000 has had significant growth in scientific publications. However, China has been rising due to increased government funding, infrastructure, and research with a strong alliance in the nanotechnology industry 26. According to Cely et al, in a previous study it was evidenced that the production of patents in the area of metallic and bimetallic nanoparticles grew by 10.0% in the last decade (Scopus). This fact sets a precedent for the significant impact generated by patents in this area 27.
This article offers a scientometric analysis related to the development of patents in metallic and bimetallic nanoparticles, promoting the discussion towards the production of patents, leading countries in this technology, and industry-university relationship among other basic elements to observe the future of nanoparticles in different areas of the industry.
Materials and method
The methodology was developed from a scientometric analysis of patents. This analysis is a method that allows visualizing interdisciplinary connections, development, and emerging areas in nanoparticle research.
A patent analysis was developed using the Scopus database and Esp@cenet software; it was based on a combination of keywords using logical operators AND, OR, NOT and including title, abstract, and keywords. Keywords such as metal nanoparticles, oxide- metal nanoparticles, bimetallic nanoparticles, Nano-Au-Nano-Ag, etc. were used, where about 41210 patents were found during (2013-2022). The data were collected on October 11th, 2022 using Espacenet software.
The search equation is composed of words such as: emerging AND (nanoparticle/metal
OR nano-metal-oxide OR “bimetallic nanoparticles” OR “metallic nanoparticles” OR nano- Ag OR nano-Au OR nano-Cu OR nano-Al OR nano-Fe OR nano-Ti OR nano-Zn OR nano-CdSe OR nano-ZnS OR nano-CdTe OR nano-TiO2 OR nano-Al2O3 OR nano-Fe2O3 OR nano-ZnO OR nano- CuO OR nanoparticle*), analyzed in the 2013-2022 period.
Databases such as Scopus and Espacenet software were used, as well as software such as OpenRefine and advanced Excel. The analysis made it possible to determine the incidence of patent production, timeline, most representative countries, application areas, applicants, and most representative inventors.
Results and discussion
Patents analysis
Patent analysis was developed from databases using Espacenet software, using a keyword list of metallic, bimetallic, and oxide nanoparticles. The equation used was as follows: “emerging” AND “nanoparticle/metal”, “nano-metal-oxide”, “bimetallic nanoparticles”, “metallic nanoparticles”, “nano-Ag”, “nano-Au”, “nano-Cu”, “nano-Al”, “nano-Fe”, “nano-Ti”, “nano-Zn”, “nano-CdSe”, “nano-ZnS”, “nano-CdTe”, “nano-TiO2”, “nano-Al2O3”, “nano-Fe2O3”, “nano-ZnO”, “nano-CuO”, in the 2013-2022 period, where 41210 patents were found.
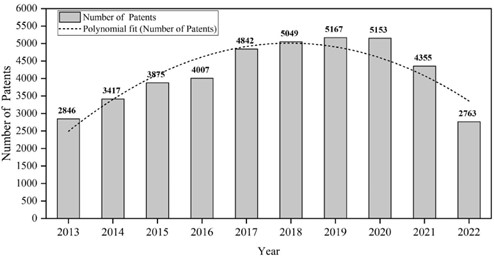
Figure 1 shows the timeline of patents in the research of nanoparticles in the last decade. It is evident, as found from the analysis of the Scopus database, the upward growth of patent production. In this case, under the analysis with Espacenet, the average annual growth rate was 25.3%, with more than 2000 patents per year in the thematic. The highest peak was presented in 2019, with 5167 patents.
Patents by Country
An interest in obtaining patent protection has accompanied the rapid growth of nanotechnology. Due to experiences such as in the case of the United States and China, universities are increasingly proactive in commercializing their research results and converting them into products for industry in general as a knowledge transfer 1,23.
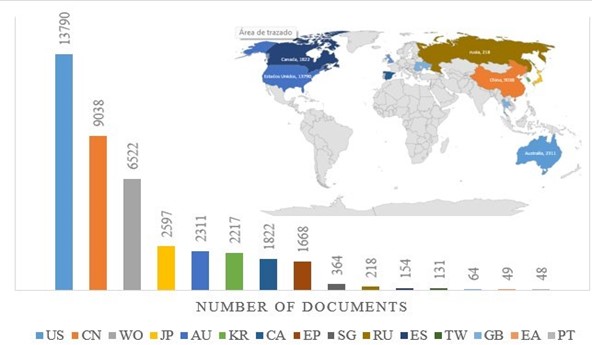
Figure 2 shows the number of patents for the United States (33.4%), China (21.9%), WIPO (15.8%), Japan (6.3%), and Australia (5.6%), i.e., the first five countries or entities account for 83.1% of the total. No patents from Latin American countries were found under the search equation.

Figure 2 Number of patents by country, in the area of metallic and bimetallic nanoparti- cles in the period 2013-2022. According to Esp@cenet, countries are designated by the following nomenclatures: US=United States, CN=China, WO=WIPO, JP=Japan, AU=Aus- tralia, KR=Korea, CA=Canada, EP=European Patent Office, SG=Singapore, RU=Russia, ES=Spain, TW=China Tipei, GB=United Kingdom, EA=Eurasian Patent Organization, PT=Portugal.
It should be noted that countries such as India, Germany, and the United Kingdom, which have a high production of scientific articles on the subject, do not show this strength in the generation of patents.
In general, the growth of patents in this area of nanoparticles has been significant, with the United States and China leading the process. This growth has been generated not only by investment policies of the great powers in the area of innovation and technology but also from the concept itself of size reduction, which generates a different material susceptible of being patented, either for its properties or the solution to certain problems of the environment 28
On the other hand, Wu et al. 29 found that since 2011 the growth of patents in China has been ascending, surpassing countries such as the United States, Korea, and Germany, making it the country with the highest production of patents. When analyzing and comparing what happens with that patent development and according to Maxwell et al 30, who developed a comparison of patent production between China and Australia it can be evidenced that there are factors in that growth model. It is the case of Australia, which developed its first patent in 1904 and since then has had a successful development for its national market. The patent right prevents others from exploiting that technology in Australia. However, due to international policies, foreign entities can also own Australian patent rights for the commercialization of those technologies, as in the case of China, which under government incentive policies, concessions, and tax deductions, has acquired a large part of those patent rights.
Patents Groups
The groups of patents are classified by area as follows: a) Human Needs; b) Transportation; c) Chemical; d) Textiles and Paper; e) Construction; f) Mechanical Engineering; g) Physics; h) Electricity, and i) General.
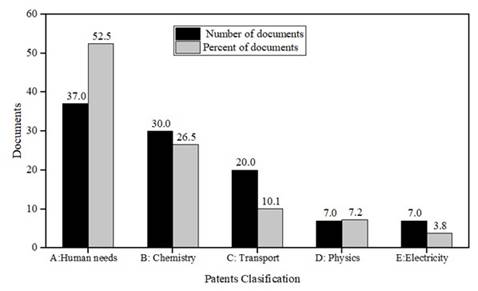
Figure 3 shows the number of documents according to patent classification. For the case study, the area of Human Needs is where most documents are found (52.5%), followed by the area of Chemistry (26.5%), Transportation (10.0%), Physics (7.19%), and Electricity (3.8%), the other areas do not present documents in analysis.

Figure 3 Percentage of documents and number of applications by patent classification, in the area of metallic and bimetallic nanoparticles in the period 2013-2022
Patent groups can be classified into main and subgroups; in this case, Table 1 shows the top 10 main patent groups and areas of work.
These ten groups correspond to 37.6% of the total documents per patent group. The topics with the highest production are focused on the health part (8 of 10 large groups), with the analysis of devices or methods, generation of peptides, analysis of antibodies and control topics, and analysis of physical and chemical properties.
Table 1 Main Groups of patents, in the area of metallic and bimetallic nanoparticles in the period 2013-2022
| IPC Main Groups | Patents | Area |
|---|---|---|
| A61K31 | 3162 | Health: devices or methods for medical or dental purposes |
| A61P35 | 2595 | Health: Chemical components or medicinal preparation |
| A61K47 | 2344 | Health: Devices or methods for medical or dental purposes - non-active ingredients (transporters) |
| C12N15 | 2330 | Health: Devices or methods for medical or dental purposes |
| G01N33 | 2122 | Physics: Analysis of materials for the determination of physical or chemical properties. |
| A61K9 | 2108 | Health: Devices or methods for medical or dental purposes |
| A61K39 | 2085 | Health: devices or methods for medical or dental purposes - antibodies |
| A61K38 | 1711 | Health: Devices or methods for medical or dental purposes |
| C12Q1 | 1521 | Chemistry: testing and measuring processes of microorganisms, enzymes, and nucleic acids. |
| A61K45 | 1488 | Health: Devices or methods for medical or dental purposes |
| C07K14 | 1472 | Chemistry, metallurgy: Peptides-amino acids. |
Applicant Entities
Every patenting process involves two types of actors: the inventors or creators and the applicants- companies, universities, organizations, or individual users. As previously mentioned, and according to Jain & Rangan 24, the generation of patents is increasing due to the commitment and activity developed by universities and research institutes with a dynamic of intellectual property protection. The percentage of type of applicant entities, being representative the participation of universities with 63% (2884 documents) and companies with 37% (1628 documents); independent users were not found in the analysis. Table 2 shows the ten entities with the most patents applied.
Table 2 Entities applying for patents in the area of metallic and bimetallic nanoparticles in the period 2013-2022
| Applicants | Number of Patents |
|---|---|
| Univ California | 338 |
| Massachusetts Inst Technology | 285 |
| Broad Inst Inc | 183 |
| Harvard College | 160 |
| Univ Texas | 138 |
| Univ Leland Stanford Junior | 102 |
| Univ Johns Hopkins | 90 |
| Massachusetts Gen Hospital | 85 |
| Hoffmann La Roche | 82 |
| Univ Northwestern | 81 |
Seven of the ten entities are universities, and the principal applicant countries are the United States, Korea, Germany, the United Kingdom, and Canada.
Inventors
The percentage of documents related to inventors by country. The first five countries account for 75.6% of the total number of documents. The United States has the largest number of documents (77%), followed by Germany (7%) and the United Kingdom (6%). Table 3 shows the inventors with the highest number of documents.
Table 3 Most representative inventors in the area of metallic and bimetallic nanoparticles in the period 2013-2022
| Inventors | Number of Patents |
|---|---|
| Zhang Feng | 79 |
| Regev Aviv | 54 |
| Chen Jian | 33 |
| Jang Bor Z | 25 |
| Wang Chao | 25 |
| Miller David | 23 |
| Wang Meng | 23 |
| Weiner David | 23 |
| Wang Wei | 21 |
| Zhang Wei | 21 |
Despite the impact generated by the Covid-19 pandemic, around 3.3 million patent applications were filed worldwide in 2020, representing an increase of 1.6% over 2019, especially the participation of China, the Republic of Korea, Hong Kong, and India.
In this patent growth, it is notable to see Asian economies leading a global recovery with 1.6% in patent applications for 2020. The long-term trend in patent applications worldwide tends to rise so that applications have increased from 1 million in 1995 to 3 million in 2016 22.
Conclusion
The generation of patents has been a way of encouraging the knowledge economy, giving value to the development of innovations, and generating a more significant link with industry, showing that the requesting entities with the greatest impact were universities with 63% compared to the industry with 37%.
The scientometric analysis allows finding trends related to metallic and bimetallic nanoparticles in their applications in different areas of the industry; thus, the area with the greatest impact was that of human needs (52.4%) in applications for the health area.
The development of patents shows an upward trend, with the United States and China, with 55.3% of the total, being the countries with the highest production in the area of research; on the other hand, worldwide, the overall production of patents for 2019 and 2020 reached more than 3 million applications.


