


 English (pdf)
 Article in xml format
 Article references
 Send this article by e-mail
 Cited by SciELO
  Cited by Google
  Similars in
SciELO
Similars in
SciELO  Similars in Google
 Permalink
INTRODUCTION
In Argentina, citrus fruit rank first in volume of fruit production, followed by pitted and stone fruit. The country ranked sixth worldwide in the 2021-2022 season, with nearly two million tons of lemons (Citrus lemon), one million tons of oranges (Citrus sinensis), 370 thousand tons of mandarins and 95 thousand tons of grapefruits (Citrus paradisi) (Federcitrus, 2023). Term mandarin includes various species grouped as Citrus reticulata, C. unshiu, C. nobilis, C. tangerina, C. deliciosa, C. Clementina, C. reshni, C. sunki, and its hybrids such as tangor, an interspecific hybrid of C. reticulata x C. sinensis.
Oranges are the most consumed citrus fruit worldwide, but in recent years mandarins and their hybrids have been in growing demand. Availability of these fruit is assured throughout the year thanks to post-harvest treatments, the development of late varieties and production in both hemispheres. Tangors, particularly tangor murcott, which are mandarin hybrids, are among the most demanded by international markets, since they are excellent quality, very sweet, easy to peel, and have a high juice content and low acidity. In addition, plants have a high degree of adaptation to a wide range of climatic conditions, from desert to subtropical, so their cultivation is increasing rapidly. Specifically, in northeastern Argentina, sweet oranges and mandarins are relevant agricultural exports (Federcitrus, 2023).
Yield prediction is a great challenge in fruit orchards. Early production forecasts allow producers to estimate final fruit volume, calculate supplies needed for fruit picking, plan and manage storage spaces, reserve sorting facilities, and plan transportation (Wang & He, 2021). Added to this is the possibility of making advance provisions of logistical aspects of marketing that improve its competitiveness in national and international markets and proposing marketing strategies (Bóbeda et al. 2018).
Predicting fruit production requires the definition of models and to do so it is necessary to estimate parameters in relation to characteristics that the fruit will have on the harvest time. Adjusting a model to fruit growth data allows finding an appropriate function that synthesizes the information that comes from measurements made on the same individual, favoring the estimation of fruit size at any time prior to harvest (Del Brio et al. 2023a).
Processes that cause sigmoidal growth curves or S-shaped curves are very common in biology and agronomy. Growth curves describe the evolution of individuals, plant or animal organs, over a period of time. A wide variety of examples of sigmoidal growths are found, from the development of root cells to the growth of total air mass in large forest trees. Such curves start from a fixed point and increase their slope monotonously until reaching a turning point, in which the slope begins to decrease and the function asymptotically approaches a final value.
The curve that represents the growth of a fruit varies with the species in question. For citrus fruit, it generally corresponds to a simple sigmoid, characterized by three well-defined periods: the first one, of exponential growth, caused by cell division, goes from anthesis to the end of the physiological flower fall (phase I). The second one, of linear growth, generated by cell growth, from the end of the physiological flower fall, until shortly before the fruit color change (phase II). The third one is characterized by a reduced growth rate and includes all the changes associated with maturation (phase III) (Orduz-Rodriguez et al. 2009; Ueda et al. 2010; Cañizares Chacin et al. 2012; Agustí et al. 2020; Forlin et al. 2023).
For the particular case of Ponkan mandarin (Citrus reticulata ‘Ponkan’), Esposti et al. (2008), found that fruit development followed a simple sigmoid curve, with phase I extending from anthesis to day 85 after full flowering, with a transition period to phase II lasting until day 101 after full flowering. Phase II began shortly after the transition phase and extended until day 251 after full flowering, beginning phase III of fruit ripening, which extended until harvest, which took place 276 days after full flowering.
Numerous mathematical functions have been proposed to model these growth curves. The most used are Logistics (Nelder, 1961), Gompertz (1825), Von Bertalanffy (1938) and Brody & Lardy (1945), followed by those of Richards (1959), Morgan et al. or MMF (1975) and the models derived from Weibull distribution (1951). In turn, each of them presents different parameterizations, which are alternative ways in which a parameter can appear in the model, and which give it particular characteristics, constituting families of curves.
According to Cordeiro et al. (2009), many times the model is not expressed in a parametric form that facilitates the convergence of the iterative process used to obtain the parameter estimates. So it is necessary to look for the most appropriate re-parameterization, that is, its behavior is as close as possible to the behavior of a linear model since the statistical properties of nonlinear models, the estimation of parameters and the validity of the asymptotic inference depend on the approximations to the linear behavior of said models. Many authors have used different models to describe and develop fruit growth curves (Godoy et al. 2008; Balaguera et al. 2009; Terra et al. 2010; Prado et al. 2013; De Brites Senra et al. 2022), but in general they don’t question the re-parameterizations available for that model.
The expressions used to evaluate the adequacy of these linear approaches and their effects on inference are known as nonlinearity measures (Cordeiro et al. 2009). Bates & Watts (1980) quantified the nonlinearity present in the nonlinear models based on the geometric concept of curvature y demonstrated that nonlinearity can be decomposed into two parts: the intrinsic nonlinearity (IN) that is typical for the model and the parameter effect (PE), which represents the effect of nonlinearity on the model parameters. Large values of IN indicate high nonlinearity of the response function, and high values of PE indicate that the parameterization of the model is responsible for the greater distance from the linear form. A model should be preferred when it has low values for these statistics, since estimators tend to be unbiased, normally distributed, and with minimal variance, even in small samples (Zeviani et al. 2012).
Various articles analyze non-linear models in different plant species; however, the literature is scarce in the description of growth in mandarins and especially in tangors (a hybrid of mandarin and sweet orange). For this reason, the objective of this work was to find not only a mathematical model, but also its most convenient re-parameterization, which allows describing the growth pattern of tangor murcott fruit (Citrus reticulata x C. sinensis ‘Murcott’).
MATERIALS AND METHODS
Experimental Data. Experimental data were obtained in nine commercial tangor murcott orchards, located in four locations in the Province of Corrientes, Argentina, for five seasons. Since the same orchards were not studied in all seasons, the orchard-season combination constituted thirteen different environments.
The climate of the region in question is humid subtropical, very warm in summer, but with a chance of frost in winter. It has frequent water excesses in autumn and spring, and moderate and eventual deficits, mainly in summer. The average annual temperature varies between 21 °C North and 19 °C South. Rainfall is abundant and frequent, exceeding 1,500 mm annually NE, gradually decreasing to less than 1,000 mm in the SW angle. The number of days with rainfall varies very little between the months of the year; between 6 and 8 per month, which total around 80-100 days of rainfall per year. The average annual relative humidity ranges, in all locations in the province, between 70 and 75% (Ministry of Production, province of Corrientes, 2019).
All orchards had drip irrigation and the plants received the usual pruning, fertilization, thinning and health treatment in the area. Table 1 shows the characteristics of the orchards and season in which the measurements were taken.
Table 1 Name, location, characteristics and seasons studied for the different tangor murcott orchards (Citrus reticulata x C. sinensis ‘Murcott’).
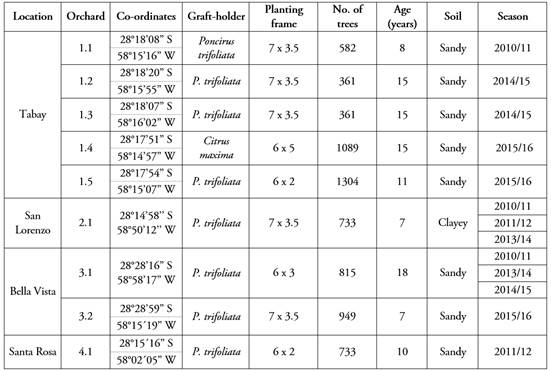
On the perimeter of each orchard plot, an edge composed of the first three rows was not included and from the remaining ones 10 plants were selected on its two diagonals, through systematic sampling with random start. In each plant, 30 fruit were identified, distributed throughout the crown of the tree, whose equatorial diameter (mm) was monitored using a digital caliper, with a frequency of 10 to 15 days. To determine the sample size, the recommendations followed were those of Avanza et al. (2010). The measurements began once the cultural management that defines the amount of fruit in the plant was completed, commonly called load, and were referred to as days from the date of full flowering (DDPF), which corresponds to 80% of open flowers. Measurements began between 58 and 105 DDPF depending on the orchard and season, and continued until harvest, obtaining between 10 and 22 measurements throughout the growth period. Considering the fruit that suffered natural fall and the subsequent cleaning of the database, 2,053 fruit were available for analysis
Statistical analysis: nonlinear regression. In the first instance, for each fruit, the models corresponding to the mathematical equations described in Table 2 were adjusted, where the first parameterization is presented with which these curves appeared in the literature and then the re-parameterizations of these initial forms most frequently cited in the literature, which in turn are detailed in Table 2. All cases indicate the deterministic part of the expression. The PROC NLIN procedure was used in the SAS® On Demand for Academics statistical package (SAS, 2023), with the Marquardt calculation method. The initial values for the estimators were obtained according to the methodology proposed by Ratkowsky (1983).
Table 2 Models analyzed to describe growth of sigmoid-type fruit.
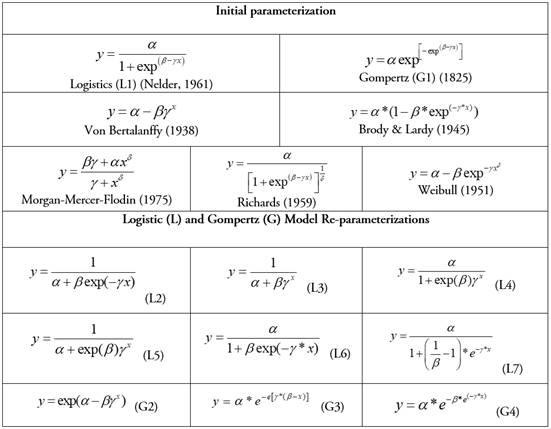
y= equatorial diameter of fruit, x= DDPF, α, β, ( and ( = parameters.
Nonlinear models were evaluated with the classic goodness-of-fit criteria: number of non-convergent curves (NCNC), coefficient of determination (R2), magnitude of the residual deviation (Sy/x) and t-test for null hypothesis of parameter equal to zero.
In addition, magnitudes and significance of intrinsic nonlinearity (IN) and parameter effect (PE) nonlinearity were evaluated, determining their significance with the critical value 1/(F(p, v, α), where v = n-p with n = number of observations in time and p = number of model parameters. IN and PE measure the degree of nonlinearity in a data-model-parameterization set, and if they are not significant, the model could be considered to have linear behavior.
In the different models presented, as well as in their different parameterizations, Greek letters α, β, ( γ δ were used deliberately and consistently, so that they represent the same meaning in all of them. Thus, the interpretations of them correspond to the following aspects of the growth curves: α is the parameter related to the superior asymptote, β to the intercept of the function, ( with the rate of growth of the curve from a 'start' value determined by the magnitude of β to a 'final' value, determined by the magnitude of α, and finally δ, only present in the four-parameter models, it provides greater flexibility to the model for data adjustment, compared to three-parameter models.
To the previously selected model, which corresponds to a non-linear fixed model, random effects associated with each parameter were incorporated, given that the observations were made on the same fruit (subject) over time (longitudinal measurements). To do this, the adjustment of seven possibilities for adding random effects in the parameters, three models with the addition of random effect on a single parameter, three models with random effect addition on two parameters, and a third model with random effect addition on all three parameters was evaluated. These mixed nonlinear models were adjusted with the restricted maximum likelihood method, using library nlm (Nonlinear Mixed-Effects Models) of the R package (R Development R Core Team, 2022) and they were compared using the Akaike Information Criterion (AIC) (Akaike, 1974) and the Bayesian Information Criterion (BIC) (Schwarz, 1978).
Statistical analysis: components of variance on estimated parameters. To study the effect of environmental factors on the estimated parameters, the selected growth curve was adjusted to each fruit and an unbalanced analysis of variance was proposed considering orchards, seasons and trees as random factors according to the following model:
y ijkl = ( + O i + S j + O*S ij + T(O*S) k(ij) + ( l(ijk)
Where: y ijkl are the estimates of parameters α, β and ( for each fruit, O i the effect of i -th orchard, S J is the effect of the i -th season, O*S ij effect of orchard-season interaction, T(O*S) k(ij) effect of k -th nested tree in combination i -th orchard with j -th season and ( l(ijk) the random error, which in this case corresponds to the variability between fruits.
For each of the factors and interaction, its significance was analyzed, and its component of variance was found in absolute and percentage terms. For this analysis the GLM and VARCOMP procedures of the SAS® On Demand for Academics statistical package (SAS ODA, 2023) were used.
RESULTS AND DISCUSSION
Table 3 shows that the four-parameter models are the ones that presented the least residual deviation given the versatility that these models have when presenting a flexibility parameter, which translates into slightly higher R2 values. But at the same time they were the ones that had the greatest problems of convergence and high number of fruit with significant intrinsic nonlinearity, particularly Richards' model, which would imply an over-parameterization of these models to describe the growth pattern of tangor murcott fruit for the number of records over time available in this study. Similar results were found by Bramardi et al. (1997), for cvs. William's and Packham's triumph pear fruit (Pyrus communis ‘William's’ and ‘Packham's Triumph). Avanza et al. (2008) mention that MMF and Richards models did not converge for any fruit and Weibull model for only one in their study on the growth pattern of sweet orange fruit. On the contrary, Ukalska & Jastrzębowski (2019) had no problems with convergence in Richards' model and it was selected as the best to describe the dynamics of the emergence of the common oak epicotyl (Quercus robur); this is surely because daily growth measurements were surveyed over a period of 74 days. Solórzano-Thompson et al. (2021) also opted for a four-parameter model (MMF) to study the evolution of oil palm performance (Elaeis guineensis) throughout the life cycle of the crop, but they did not analyze nonlinearity measures.
Table 3 Goodness-of-fit measures for the different models.
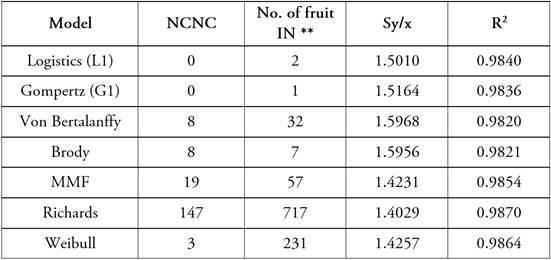
NCNC = number of curves that did not converge. No. of IN fruit** = quantity of tangor murcott fruit with significant intrinsic non-linearity (p-value < 0.05). Sy/x = mean residual deviation (mm). R2 = coefficient of determination. (n=2,053).
Of the models with three parameters, those that performed best, either due to ease of convergence, IN and goodness-of-fit, were Logistics and Gompertz models. It should be noted that both models showed adequate residual behavior, and in all cases the estimated parameters were significant (p< 0.001). Therefore, the study of the parameter behavior corresponding to the different parameterizations was continued only in these two models.
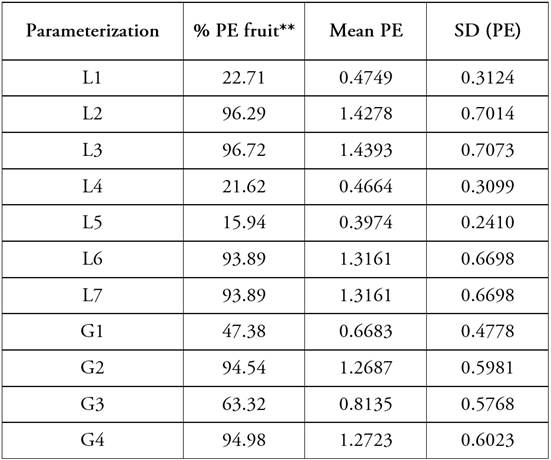
Of all the re-parameterizations analyzed for Logistics and Gompertz models, we could consider L1, L4 and L5 as the most satisfactory since they recorded the lowest values of mean PE nonlinearity (Table 4). In them, between 77.29 and 84.06% of the fruit present estimates of their parameters close to linear behavior, which implies we’re speaking about estimators that may be considered weakly biased, with a distribution close to normal and with minimal variance. At the same time, parameterization L5, in addition to having the lowest mean PE non-linearity measurement value, was the most homogeneous.
Table 4 Tangor murcott fruit percentage with significant parameter effect (PE) (p-value < 0.05) for the different re-parameterizations of the Logistics and Gompertz models. SD: standard deviation
To describe the growth of the gulupa fruit (Passifloraedulis f. edulis SIMS), Carvajal et al. (2012) found that the model that best adjusted growth was Logistics. Cañizares Chacin et al. (2012) found that in the cultivation of “Tahiti” lime (Citrus latifolia Tanaka), the development of the fruit followed a sigmoid model from anthesis to maturation, characterized by the three phases described in the introduction. These results coincide with those of Balaguera et al. (2009))who in order to study the growth and development of champa (Campomanesia lineatifolia) adjusted a Logistic model, because it presented a smaller residual mean square of the error compared to the Gompertz model. On the other hand, in Valencia Late orange (Citrus sinensis ‘Valencia Late’) Román-Román & Torres-Ruiz (2014) found that Bertalanffy’s modified version (Lv & Pitchford, 2007) provided a good fit.
Fernandes et al. (2015), highlight that the choice of parameterization affects the model, and therefore, influences the reliability and inferences about the estimated parameters. In their study, PE values were lower than IN for pequi fruit growth (Caryocar brasiliense) in L6 and G4. Also, they mention that the parameterizations in models L6 and G3 had the highest standard error for the estimation of the parameter β, resulting in a greater effort in the computational calculation since these estimates require more iterations to achieve the convergence of the solution curve as also Rossi & Santos (2014) stated.
By using nonlinearity measures, Bramardi et al. (1997) selected the Logistics model in the third parameterization according to Ratkowsky (1983), to describe the growth of William's and Packham's triumph pear fruit, in order to be used for prediction of final fruit size. Fernandes et al. (2014) and De Brites Senra et al. (2022), use nonlinearity measures as one more goodness-of-fit measure to choose the model that best describes the growth of coffee fruit, Coffea arabica cv. Obatã and Coffea canephora cv. Conillon, respectively.
Due to the above, the Logistics model in its fifth parameterization (L5) can be considered the most appropriate to describe the growth pattern for tangor murcott fruit. This result agrees with Avanza et. al. (2008), who found that the most appropriate model-data-parameterization combination to describe the growth pattern for Valencia Late orange fruit is the Logistics model in the fifth parameterization, according to Ratkowsky (1983), defined for three sizes of small, medium and large fruit. In their work, 93.3% of the fruit presented non-significant PE for said re-parameterization.
The interpretation of the parameters in model L5 according to Ratkowsky (1983) is the following:
α: parameter related to the superior asymptote (ASIN); in this parameterization ASIN = 1 /α.
β: parameter associated with the lower asymptote or intercept (INT) that describes the value of Y corresponding to X = 0. In this parameterization INT = 1 / (α + eβ).
γ: parameter related to the growth rate (TC) from the initial values (magnitude β) to the final values (magnitude α); in this parameterization it is given by the TC function = -ln γ.
By incorporating random effects into the parameters of model L5, it was found that the alternative that presented the best fit (AIC and BIC criterion) was the one that considered these effects in the three parameters, that is, all the terms of the model vary from individual to individual. Therefore, the expression of the mixed non-linear model to describe the growth of these fruit should be expressed as:
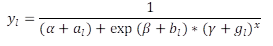
where a l , b l and g l represent the random component of fruit l on each of the estimated parameters.
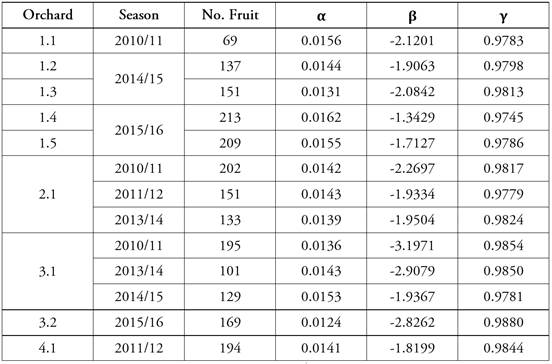
Table 5 shows the estimates of the fixed part of the parameters of the mixed nonlinear model by season and orchard.
Table 5 Estimation of parameters α, β and γ of the Logistics model in its 5th re-parameterization for average growth of tangor murcott fruit per season and orchard analyzed
Regarding the analysis of the variance, the orchard*season interaction was only significant for parameter ( (p-valor = 0.02), the other terms of the model under analysis being highly significant (p-value < 0.001). Table 6, where the estimates of the variance components for each parameter are detailed, shows that ( together with β had their main source of variation in the orchard and season factors, that is, both the initial size of the fruit and the rate of growth are the characteristics of the growth curve that are most affected by differential environmental conditions. On the other hand, in the case of parameter α, associated with the final size of the fruit, the participation of the tree and fruit factors in the total variability increases, although the variability between orchards and seasons remains highly significant.
Table 6 Estimation of components of absolute (Var) and percentage (Var%) variance of the orchard, season and tree factors corresponding to the estimated parameters of the non-linear model L5 for each tangor murcott fruit.
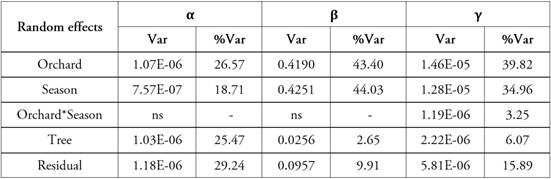
ns: no significant (p-value > 0.05)
The fact that the different parameters of the growth curves for tangor murcott have variability between environments is of interest from an agronomic point of view, given that depending on the environmental characteristics (season-orchard combination) the size of the fruit changes throughout its entire growth period.
Through multiple regression analysis, with different climatic variables as regressors, Kaack & Pedersen (2010) demonstrated that the diameter of apple fruit (Malus domestica) was significantly affected by two climatic factors: degree days and evaporation potential. Zadravec et al. (2014), compared 4 apple cultivars and found that the harvest size of the fruit varies significantly between years, depending largely on temperatures, location and other environmental factors.
Similar results were reported by Orduz-Rodríguez et al. (2009) in myrtle mandarin (Citrus reticulata ‘Arrayana’) where they demonstrated that growth rates, external characteristics and fruit quality are determined by the climatic conditions of the region and the grown variety.
Due to the above, the introduction of random effect coefficients in the modeling of tangor murcott growth curves allows modeling the covariance between observations coming from the same fruit, introducing flexibility to the model to contemplate the variability existing among individuals and among environmental conditions in accordance with what is established by Godoy et al. (2008).
Avanza et al. (2008) report, in a study on the growth pattern of Valencia Late orange, orchard-season interaction, both for the parameters associated with growth rate and for that related to the intercept and found the initial size of the fruit, a factor that was not considered in this work, as the main source of variation for all parameters.
Bramardi et al. (1998) by describing the growth pattern of cvs William's and Packham's triumph pears, through analysis of the variance on the estimated parameters for each fruit of a logistic model in parameterization L3, found a relatively homogeneous behavior between trees that belong to the same orchard, but important variations due to their particular characteristics (orchard effect), and the climatic conditions during the seasons (year or season effect) which coincides with the results found.
Panta et al. (2023) studied the growth pattern of three pecan nut cultivars (Carya illinoinensis). They used a mixed nonlinear model to analyze the variability in the parameters of the Gompertz and Logistics models with respect to the cultivar factor and five different locations, which were also significant. In addition, they proposed a growth model based on the accumulation of thermal units, instead of DDPF, to facilitate a more precise management of the orchard. Cepeda et al. (2021) by assuming that there is a temperature effect on the growth of Anna cultivar apples, in the Logistics model they use accumulated degree/days above 7.22 °C in the abscissa, which is the temperature at which they consider that the metabolic process in apples is in its lowest point. Del Brio et al. (2023b) incorporate environmental covariates, in particular thermoaccumulative rates, in a mixed non-linear (logistical) model to describe the growth of William's cultured pear fruit, managing not only to describe their growth, but also to consider environmental variations over different seasons.
It is evident that fruit growth is influenced by climatic factors (temperature, rainfall) and the type of orchard (soil, plant age) and this is no exception for tangor murcott fruit. However, this does not prevent a model of average behavior of the tangor murcott fruit growth pattern from being established to serve as a reference. To do this, the chosen model was adjusted on all the fruit under study, resulting in the following expression:

In subsequent work with this model, average growth curves must be adjusted for different commercial sizes in order to obtain “growth tables” that allow the expected fruit size to be estimated in advance at harvest and, consequently, to be able to make production predictions and size distribution in order to better plan the commercialization of production. Also, these tables are a useful tool for improving the cultural practice of manual fruit thinning, which, despite not being widespread in citrus farming, provides important benefits since it allows obtaining fruit of larger size, which even at the expense of a reduction in the general yield of the crop, it is economically more profitable (Agustí et al. 2020).
In line with the above Stander & Cronjé (2016) recommend manual summer thinning for nadorcott mandarin (Citrus reticulata ‘Nadorcott’), which by reducing the number of small fruit increases the growth rate of the remaining fruit. This results in a greater number of premium-sized fruit per tree and higher quality, resulting in an economic return for the producer and an interesting alternative to the use of chemical thinning agents to manage the crop load.
Although a cost-benefit analysis of manual fruit thinning in tangor has not yet been performed, it is a growing practice in the Corrientes region, Argentina; therefore, having these growth tables would facilitate the implementation of this cultural work.

