English (pdf)
 Article in xml format
 Article references
 Send this article by e-mail
 Cited by SciELO
  Cited by Google
  Similars in
SciELO
Similars in
SciELO  Similars in Google
 Permalink
1. Introduction
In less than three months, the COVID-19 pandemic spread rapidly worldwide and affected most of the countries despite lockdown and containment measures. On March 16, Ecuador declared a State of Exception to prevent the transmission of COVID-19. Subsequent implemented measures included restrictions on vehicle and human mobility, suspension of in-person work in both the public and private sectors, suspension of national flights, and limitations on commercial activities to prevent overcrowding. It is worth noting that essential sectors such as basic services, strategic sectors (health, emergencies, security, and risks), food supply, medicines, and fuel were exempted from these measures (Registro Oficial, 2020). The COVID-19 pandemic led to a decline in both internal and external demand, reduced activity in transportation, tourism, and construction, which resulted in a 7.8% decrease in the real production of the economy (BCE, 2022a), and a decrease of 532,359 jobs (INEC, 2022).
The economic performance had a significant impact on companies, with total sales losses amounting to 16.6% of the Gross Domestic Product (GDP) in 2020 (BCE, 2022b). Regarding total production, the most impacted industry was Accommodation and Food Services, experiencing a 26.2% decrease in Gross Value Added (GVA), followed by Education and Health Services with a reduction of 15.1%. Transport and storage services ranked third, with a 13.6% decrease in GVA (BCE, 2022b).
From the business sector's perspective, four types of companies are identified in Ecuador: micro, small, medium, and large. Micro and small companies are the sectors with the greatest participation, representing 93.9% and 4.4%, respectively (INEC, 2022). In contrast, the number of medium and large companies represents only 1.3% and 0.5%, respectively (INEC, 2022). Thus, microenterprises represent a fundamental sector in developing economies such as Ecuador, insofar as they correspond to the largest segment of firms and employ an important part (40.95%) of the workers at the national level (INEC, 2022). Faced with the adverse effect of the COVID-19 pandemic, micro and small companies are the most vulnerable compared to large companies, since they do not have sufficient financial and administrative resources (Blanco et al., 2021; Eggers, 2020) and they are not financially prepared for such situations (Liu et al., 2022). As a consequence, these organizations have faced various challenges including reduced demand, supply chain disruptions, order cancellations, shortages of raw materials, and transportation interruptions, among others (Demmou et al., 2021; Kökény et al., 2022). In addition, they are highly dependent on their transactions because they do not have reserves (Achim et al., 2022). Indeed, micro and small businesses experienced a contraction in sales of -12.7% and -20.5% during 2020.
Ecuador implemented important measures in 2021 to reactivate its economy during the COVID-19 pandemic. These included a comprehensive vaccination campaign, economic stimulus packages, infrastructure investment, pursuit of trade agreements, and implementation of social programs (Ministerio de Salud Pública, 2021; Rivera & Lobera, 2021). As a result, businesses were able to resume their operations, leading to an increase in consumption, employment, investment, and exports (Coba, 2021). The improvement in performance of the Ecuadorian economy can be observed in the growth of the GDP and corporate sales. In 2021, the real GDP growth rate reached 4.24% (BCE, 2022a), and there was a 24.7% increase in corporate sales compared to the pandemic figures (Supercias, 2023). These values reflect sustained economic recovery.
The objective of this paper is to determine the impact of the COVID-19 pandemic on the financial performance of companies in Ecuador. For this purpose, we use a Difference-in-Difference (DID) regression model using panel data at the firm-level before and after the pandemic. Given that production and commercialization of food was not subject to the restrictions due to the pandemic, companies in this sector are used as a control group to implement the DID model. The main research questions of the study are: What are the effects of the COVID-19 pandemic on the profitability and solvency of companies in 2021? What factors condition the impact of the pandemic on the performance of Ecuadorian companies?
To answer these questions, a firm-level panel dataset covering the period from 2019 to 2021 is prepared based on the financial statements published by the Superintendence of Companies of Ecuador. The database consists of an average of 25,212 firms.
This study contributes to the literature on the business impact of COVID-19 in developing countries. It comprehensively examines the impact of the pandemic, considering various dimensions of companies' financial performance such as profitability, solvency, liquidity, and asset management. The existing literature on the matter is limited and we contribute to it as follows. First, we analyze the corporate impact of COVID-19 from the perspective of company size. The study assesses the COVID-19 impact on micro and small companies compared to medium and large companies. We categorize firms into four groups-micro, small, medium, and large companies-to measure the heterogeneous effects of COVID-19 on business performance. The insights on this business segment are crucial to developing economies. Previous studies have shown diverse effects of COVID-19, including reduced profitability (Demmou et al., 2021), deteriorating liquidity (Yarovaya et al., 2020), and increased indebtedness (Gajdosikova et al., 2022). However, these effects vary depending on the company's size and economic activity (Demmou et al., 2021). Second, it examines how the pandemic has affected the financial performance of companies based on their sector of economic activity. This analysis provides a more detailed understanding of sectoral vulnerabilities and disparities, offering guidance for investment decision-making, mitigating future crises, and developing policies that equip businesses with effective tools to tackle these challenges. . Third, by specifically examining a developing country like Ecuador that heavily relies on exports, this paper addresses the crucial issue of how the export behavior of companies influenced the impact of the pandemic. By paying attention to this matter, we can aid in expediting economic recovery and mitigating potential future effects on companies. Finally, we employ the difference-in-differences (DID) model to quantify the impact of the economic reactivation measures implemented in the country in 2021. This enables us to comprehend how the financial impact of the pandemic persisted over time and the outcomes of the implemented measures.
The rest of this article is organized as follows: Section 2 presents the theoretical framework; Section 3 explains the data and method used to examine the relationship between the COVID-19 outbreak and business performance; Section 4 reports the empirical results; Section 5 concludes the paper.
2. Literature Review
This section provides a brief overview of the significant contributions made to the literature regarding the impact of the COVID-19 pandemic on business performance.
The objective of a company is to ensure its long-term success, and various aspects such as profitability, solvency, liquidity, and management play a crucial role in decision-making and financial evaluation (Ross et al., 2012). Profitability, according to authors like Gitman & Zutter (2012) , measures a company's ability to generate profits relative to its sales, assets, or investments. Solvency evaluates the company's capacity to meet its long-term obligations, while liquidity refers to its ability to fulfill short-term obligations (Gitman & Zutter, 2012). In addition to these, it is essential to consider management indicators that reflect how effectively the company is managing its assets.
The COVID-19 pandemic has had a profound impact on the global economy, leading to decreased demand, factory and retail closures, job losses, and supply chain disruptions (Camino Mogro, 2020; Kanupriya, 2021). These effects have been reflected in the performance of companies. Business closures and reduced demand have significantly affected various sectors, resulting in decreased sales and income (Mullins, 2020; Nguyen, 2022), leading to a decline in profits compared to previous figures (Demmou et al., 2021). The pandemic has also disrupted the production chain, hampering companies' ability to generate income. Camino Mogro (2022) states that the decline in sales in the Ecuadorian market occurred due to the prohibition of operations for various economic activities (enforced confinement policies). This is considered a significant factor contributing to the potential losses observed across industries.
To survive the crisis, companies have implemented different strategies to enhance their liquidity and solvency. These strategies include cost reduction, obtaining loans, and even selling non-essential assets, sometimes at the expense of cost effectiveness (Bloom et al., 2021; Gajdosikova et al., 2022). In times of increased uncertainty and crisis, companies tend to increase rely more on debt financing (Gopalakrishnan et al., 2022); however, it poses significant challenges for emerging economies (Blanco et al., 2021). Small businesses, in particular, are more vulnerable to unforeseen events like COVID-19 due to limited resources, which hinder their access to reliable financing (Liu et al., 2022).
The COVID-19 pandemic has exposed the challenges faced by micro and small businesses worldwide (Lal et al., 2021). Many companies have resorted to taking on additional obligations to sustain their operations, while financial investments have become riskier as borrowers face heightened commercial risks during the pandemic (Rizvi et al., 2020). The uncertainty brought about by the COVID-19 outbreak has had a detrimental effect on the cash flows of companies, making it difficult to sustain business activities and limiting their ability to collect short-term payments (Rose Nirmala et al., 2022). Consequently, this increased investment risk and led to a reduction in overall investments (Jiang et al., 2021).
Indeed, it is crucial to acknowledge that the impact of COVID-19 on businesses has varied across different industries and company sizes. Previous literature highlights the heterogeneity of these effects. The crisis has disproportionately affected specific industries, and size plays a key role in determining the extent of this impact. While larger companies have generally experienced significant changes, they often have better access to credit, making them more resilient and solvent during times of crisis (Bloom et al., 2021). Similarly, Camino Mogro (2022) argues that Ecuadorian businesses in the private sector experienced a significant reduction in granted credits, standing at 0.60%. Micro and small enterprises emerge as the most vulnerable, given their limited access to credit.
Although micro and small companies in some countries have benefited from state measures and aid, they remain more vulnerable primarily due to their limited financial resources (Eggers, 2020; Labadze & Sraieb, 2023). Additionally, economic activity plays a significant role (Bloom et al., 2021; Fu & Shen, 2020); in sectors such as tourism (Škare et al., 2021), entertainment, and transportation (Camino Mogro et al., 2020), the impact of the pandemic has been particularly severe due to event bans, lockdowns, and the cancellation of flights and trips (Kökény et al., 2022). Companies with limited ability to adapt to remote work have shown a higher propensity to borrow, resulting in increased financing costs (Gopalakrishnan et al., 2022). The trend of seeking financing through loans and bonds has been more pronounced among companies with greater exposure to the impact of COVID-19 (Hasan et al., 2021). Small companies, being more vulnerable to the crisis, have experienced higher levels of indebtedness to cover fixed costs and implement precautionary measures (Rizvi et al., 2020). Given the heterogeneous behavior of different sectors in terms of their response to market disturbances, it is likely that they will react differently to such disruptions.
3. Impact of COVID-19 on financial performance
The results of the main studies on the impact of the COVID-19 pandemic on business performance, which are referenced in the study, are summarized below. This synthesis focuses on four indicators of the financial performance of companies: profitability, liquidity, solvency, and management.
Most of the studies that analyze the impact of the pandemic on the profitability of companies determined that COVID-19 had a significant negative effect on the return on assets (ROA) and equity of companies. When examining the impact of the pandemic on business profitability in Europe, a substantial effect was identified, with an average decrease of 12% in the ROA (Labadze & Sraieb, 2023). These findings align with previous studies. For the Korean case, the decrease in profitability ranged from 0.2 to 0.6 ROA points (Hwang et al., 2021), and an analysis of European insurance companies revealed that the pandemic caused an average decrease in ROA of 0.574 (Puławska, 2021). In contrast, in a study conducted in Indonesia, Wulandari & Patrisia (2021) found no significant difference in ROE and ROA before and during the pandemic.
Liquidity and solvency are essential for the operation of business, the latter being necessary for the existence of the former (Ticona-Aguilar, 2017). Proper liquidity management was highlighted as a means to consolidate profitability during crisis (Achim et al., 2022; Amnim et al., 2021). Nguyen (2022) found a negative impact of the pandemic on the liquidity of Vietnamese companies, which can be attributed to vulnerability to indebtedness. Additionally, the results presented by Hanim et al. (2021) indicate that businesses that increase their cash levels tend to ensure their survival in the face of a negative shock. Camino Mogro et al. (2020) analyze the Ecuadorian context, finding that more than 50% of the formal businesses established in Ecuador have cash reserves. However, they point out that these reserves are not sufficient in the face of an impact like that caused by the COVID-19 pandemic. Additionally, they note that the effect is heterogeneous, concluding that micro-enterprises are more vulnerable to disruptions that involve a decrease in their sales.
The literature suggests a positive relationship bet-ween cash holdings and performance (Hanim et al., 2021), as companies are less exposed to liquidity crises. However, high cash flow does not necessarily indicate better performance because it could indicate ineffective cash handling (Alshammari, 2020; Zhang et al., 2015). The results obtained by Achim et al. (2022) demonstrate that net working capital indices have a positive effect on a company's performance, indicating that liquidity has helped companies face the crisis caused by COVID-19. These findings are consistent with Rus & Achim (Rus & Achim, 2020) and Mullins (2020) , who validate the role of liquidity in relation to business performance in crisis conditions.
Solvency is a key variable in the operation of a business, as it is directly related to productivity, efficiency, and profitability (Zajmi, 2021). In this context, previous studies have documented an increase in corporate debt during the pandemic. For example, Gajdosikova et al. (2022) determined that by 2020, there was a reduction in the number of companies in the Slovak market with an optimal level of indebtedness. The reduction in own funds and the increase in the level of indebtedness during the COVID-19 had immediate consequences on the leverage ratios of companies and their ability to pay financial obligations (Demmou et al., 2021). These findings are consistent with Yarovaya et al. (2020) , who reveal that company assets and financial autonomy of banking companies located in the European Zone are deteriorated due to the crisis. In line with this, Achim et al. (2022) affirm that the company's indebtedness has a negative effect on the performance of entities, while the rate of financial autonomy has a positive effect. They suggest that a higher level of financing with their own resources helps to consolidate the company in the market in the face of a crisis like COVID-19. These results are consistent with studies such as Lenka (2017) and Frydenberg (2011) , which point out that low levels of indebtedness are associated with higher profitability in companies that choose to finance themselves with retained earnings instead of debt. In the Slovak case, it was concluded that in the face of the COVID-19 pandemic, reducing indebtedness and ensuring a sufficient level of liquidity prevented companies from going bankrupt (Gajdosikova et al., 2022). Additionally, debt can have a differentiated effect on investment and the speed of recovery for a company. The higher the level of indebtedness of companies, the greater the reduction in investment after a negative economic shock, significantly impacting the recovery (Demmou et al., 2021). Additionally, indebtedness can have a differentiated effect on business investment: while greater leverage can lead to a significant drop in investment, the increase in investment can also be beneficial for those companies that have low initial levels of debt (Demmou et al., 2021).
Regarding the effect of the pandemic on business management, Gajdosikova et al. (2022) point out that during the pandemic, there was a decrease in inventory turnover. In 2019, the inventory turnover period was 78 days, while in 2020, it extended to 111 days, primarily due to the impact of COVID-19. The pandemic led to an increase in the production period, the mobilization of raw materials, and consequently, the time it took to convert inventory into cash. Furthermore, as a result of the lockdown measures, production was suspended, inventories were immobilized, and the collection of outstanding debts came to a halt (Farhan et al., 2021). The COVID-19 pandemic had various global impacts on businesses, leading to widespread closures and significant sales losses, which in turn affected the sales turnover of companies (Fairlie & Fossen, 2022; Takeda et al., 2022). According to Fairlie & Fossen (2022), who conducted research on the effects of COVID-19 on businesses in California, United States, commercial sales losses decreased by 17% during the second quarter of 2020. They also highlighted the heterogeneous nature of this effect, with accommodation businesses experiencing losses of around 90%, while online sales witnessed an increase of approximately 180%. Similar-ly, in a study on small businesses in the United States, Bloom et al. (2021) found a negative and significant impact on sales, resulting in an average loss of 29%. Furthermore, Jordaan (2023) , based on the World Bank's Enterprise Survey, revealed that businesses, on average, experienced a sales decrease of 46%.
The effect on company profitability is related to the increase in operational expenses and costs. As noted by He et al. (2020) , operational expenses exhibited an upward trend among Chinese companies in the aftermath of the COVID-19 outbreak. These expenses significantly increased in sectors such as mining and manufacturing compared to others, as they relied heavily on production equipment, labor, and raw materials (He et al., 2020). Moreover, service sectors, such as the hotel and tourism industry, suffered a significant negative effect during the health crisis. The lockdown brought significant disruption to this market, and combined with high operating costs, their survival was affected (Gursoy & Chi, 2020; Jaipuria et al., 2021). The types of lockdowns, such as confinement policies, implemented by each country to control the COVID-19 pandemic caused a short-term negative impact on the creation of new businesses and capital flow (Camino Mogro et al., 2020). In response to this, Sedláček & Sterk (2017) mention that companies emerging during a recession will maintain their structure in the future, even if the economy undergoes improvements.
Finally, Carrillo-Maldonado et al. (2020) and Camino Mogro (2020) present an analysis of the differences between exporting and non-exporting companies, finding that those companies with access to the international market have an advantage that lies in their ability to maintain operations in crisis situations.
In summary, the financial impact of the pandemic can be explained as follows. The COVID-19 pandemic had a significant negative impact on the profitability of companies, with a decrease in return on assets and equity. Liquidity and solvency are crucial for business operation, and proper liquidity management can help consolidate profitability during crises. However, the pandemic negatively affected the liquidity of companies in some regions, leading to challenges in debt vulnerability. Cash holdings have a positive relationship with performance, as they mitigate liquidity crises, but high cash flow does not always indicate better performance. The pan-demic led to an increase in corporate debt, impacting leverage ratios and companies' ability to meet financial obligations. Finally, operational expenses and costs, particularly in sectors like mining and manufacturing increased significantly.
Based on the findings presented in this section, this article proposes to examine and assess the economic repercussions caused by the COVID-19 pandemic in terms of profitability, liquidity, solvency, and management on Ecuadorian companies. The aim is to enrich and complement the literature on this highly relevant topic in the current context.
3.1 Importance of Microenterprises in the Ecuadorian Economy
Currently, microenterprises have gained importance within the Ecuadorian economy with a participation close to 93.9%, followed by small and medium-sized enterprises with 4.4% (INEC, 2022). The activity of these firms is another particular aspect to consider; Trade and Services are the industries with the highest participation of microenterprises, reaching 80% (INEC, 2022).
Due to the importance of understanding the impact of the COVID-19 pandemic within market organizations, there are different options available to classify them: by sector, number of employees, gross annual sales value, or asset value (Amores & Castillo, 2017). In this study, we follow the classification of businesses into microenterprises, small, medium, and large enterprises as adopted by the Superintendence of Companies, Securities, and Insurance of Ecuador, based on the definition of the Andean Community of Nations (CAN) (Cámara de Comercio de Quito, 2017).
Table 1 Classification of companies according to the amount of assets (USD)
| Micro | Small | Median | Large |
|---|---|---|---|
| Up to 100,000 | 100,001 - 750,000 | 750,001 - 3,999,999 | ≥ 4,000,000 |
Source: Superintendencia de Compañías, Valores y Seguros (2023).
Porter (1985) states that the size of the company plays an important role in the expected outcomes, as it creates two groups: the first one can access a series of strategic advantages (large and small), while the second is unable to develop. However, other aspects such as the company's age and the industry in which it operates are also highlighted (Amato & Amato, 2004). For example, in the case of Ecuadorian companies, the results show that larger companies have more possibilities to acquire external financing (Navarro-Morato et al., 2016; Verona et al., 2003). The size of the company is negatively correlated with the level of indebtedness (Ramalho & Vidigal da Silva, 2009). According to Simbaña (2014) , who conducted a study on the Ecuadorian case, this result is explained because larger companies have the necessary resources to meet their obligations, so they do not need to resort to debt. In contrast, small and medium-sized enterprises face greater difficulties in accessing external financing sources as they are subject to financial constraints such as terms and interest rates (Curiel-Cantón, 2020).
In the particular case of Ecuador, small and large companies can differ from both an economic and regulatory point of view. Table A3 shows that micro and small businesses are characterized by their significant participation in the services sector. Conversely, medium and large companies are notable for their participation in the manufacturing sector. Moreover, there are several specific legal regulations that differentiate small and large firms in Ecuador. Small firms benefit from a simplified tax regime known as the Régimen Impositivo Simplificado, which provides certain tax advantages and simplifications for microenterprises (Código Orgánico de la Producción, Comercio e Inversiones, COPCI, 2006). Additionally, there may be variations in labor regulations, such as minimum wage requirements and employment contract obligations, based on the size of the firm. Larger firms may have additional labor-related compliance obligations (Supercias, 2023). Additionally, large firms generally have more extensive reporting and disclosure obligations compared to small firms. This includes financial reporting, auditing, and transparency obligations (Código Orgánico de la Producción, Comercio e Inversiones, COPCI, 2006).
In this way, the size of the company can be a fundamental factor when analyzing the impact of the COVID-19 pandemic in Ecuador.
4. Methodology
4.1. The difference in difference approach (DID) and data
The available pre- and post-data allowed us to use the Difference-in-Differences (DID) approach to estimate the effects of the COVID-19 impact (the treatment) on companies' financial performance. COVID-19 can be considered as a treatment, where companies operating in the most affected industries constitute the treated group, while companies outside of these industries form the control group. This research design involved comparing the treated and control groups while controlling for the effect of other variables that may influence treatment and potential outcomes. Additionally, the DID approach has the advantage of accommodating heterogeneous treatment effects across companies, as previous literature suggests that COVID-19 does not affect all companies in the same way.
The DID approach is based on the assumption that the treated group and the control group are subject to the same trends over time. This allows us to isolate the effects of non-treatment factors by comparing post-treatment outcomes between the treated and untreated groups. Consequently, the treatment effect is determined as the average change in financial performance of the treated group minus the average change occurred in control group.
The analysis focuses on the average change in financial performance experienced by the treatment group before (2019) and after (2020), the most critical period of the pandemic. We compare this with the average change experienced by the control group, while controlling for other factors that may influence the results. This provides us with an estimate of the average results that the companies affected by the pandemic would have experienced if they had not been affected. The DID estimate is based on the assumption of parallel trends, which implies that in the absence of the treatment, differences in outcomes between the treated and control groups would remain constant. Therefore, we control for other factors that could lead to different trends over time between the treatment and control groups. If the assumption of parallel trends holds any deviation of the treatment group from the results obtained by the control group, once the effect of other relevant factors is taken into account, it is attributed to the treatment effect.
Furthermore, firm-level panel data allows us to control time-invariant firm-level factors that are separable from the remaining outcomes. If unobservable factors, which we assume do not change over time, influence potential outcomes, the DID approach with firm-level panel data allows us to mitigate such effects. As previous literature reveals, the impact of COVID-19 may depend on various factors such as the size of the company and the sector of economic activity. Given the potential differentiated effect of the pandemic on business performance, we aim to account for such heterogeneous effects in our regression analysis.
Data comes from company financial statements published by the Superintendence of Companies of Ecuador. Company size classification is based on pre-pandemic (2019) assets to avoid classification changes due to the pandemic.
4.2. Control group definition
During 2020, following the declaration of the COVID-19 pandemic by the WHO, the Ecuadorian government issued multiple state of emergency decrees and subsequent renewals. The first state of emergency was declared on March 16, 2020, due to the public calamity caused by the pandemic. It was renewed on May 15, 2020, due to the high risk of contagion for the population. The second state of emergency was implemented on June 15, 2020, aiming to mitigate widespread contagion and address the economic recession. This second state of emergency was also renewed on August 14, 2020, to continue controlling the disease. Finally, the third state of emergency was enacted on December 21, 2020, due to a significant increase in COVID-19 infections and it lasted 12 days.
These regulations imposed various restrictions, including a nationwide mandatory quarantine, suspension of freedom of mobility and assembly, establishment of curfews, and the suspension of in-person work hours. However, certain activities, such as those related to accessibility, basic services, public services, strategic sectors, and the provision and acquisition of essential goods were exempted from these restrictions.
This study defines the treated group as companies operating in the industries affected by the pandemic containment measures imposed by the government. The decree, which restricted economic activities, affected sectors such as construction, accommodation and food services, education, wholesale and retail trade, and manufacturing. In contrast, the control group consists of companies that were not required to cease their operations. This includes the wholesale and retail (related to food supply), human health and social work activities, financial and insurance activities, and manufacturing (vital goods activities).
The financial statements published by the Ecuadorian Superintendence of Companies serve as the data source for this study. The database includes income and financial position statements of approximately 95,603 companies. However, companies in health and strategic sectors such as energy, telecommunications, non-renewable resources, and water-which are predominantly operated by the public sector-are not considered. The focus is on analyzing the impact of the pandemic on companies in the private sector. Additionally, we do not consider agricultural companies because they were exempt from the COVID containment measures, thus making it difficult to capture the effect of the pandemic on these companies. Therefore, the base of our analysis consists of manufacturing, trade, and service companies. This selection contributes to the variation in the implementation of the model.
4.3. Descriptive statistics
Based on the availability and comparability of financial data from the Superintendency of Companies' database, the years 2019, 2020, and 2021 were selected for the comparative analysis of the impact of COVID-19. We consider companies that had been in the market for at least 1 year in 2019 and have complete information during the study period. The 71.25% of the companies in the database belong to the treated group, while the remaining 28.75% belong to the control group (Table A2).
Table 2 summarizes descriptive statistics that characterize firms in panel data, which are based on financial information, and shows the impact of the COVID-19 pandemic on the main firm financial indicators. For instance, average ROA companies decreased by -18.6 percentage points (p.p.) for 2020 compared to 2019, which may respond to the decrease in operational margin and sales turnover. The description of the dependent variables is detailed in Table A1.
Data shows that the average liquidity indicators slightly increased during the pandemic period. In the case of asset leverage, there was a decrease in the average indicator. Table 2 also shows that COVID-19 pandemic is associated with the increase in companies' operating expenses, financial expenses and costs of sales. The ratio operational expenses increased by 4.3 p.p., and the financial burden impact increased by 0.3 p.p. during the pandemic year. Additionally, the cost of sales ratio also experienced an increase of 2.3 p.p., which clearly affected the profitability of the companies in that period.
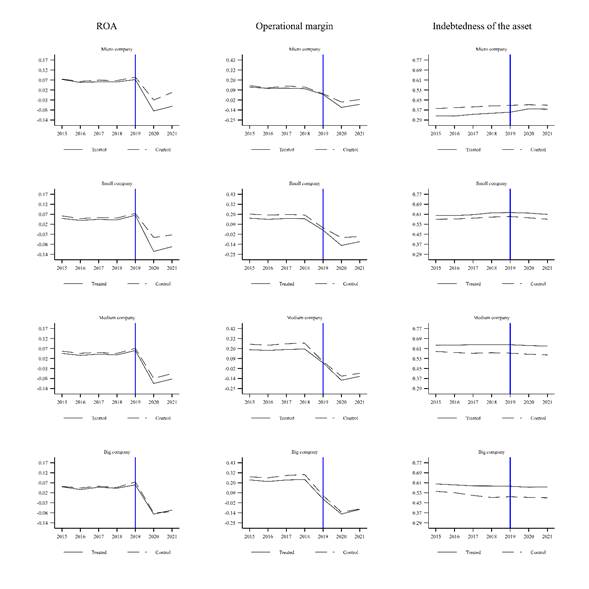
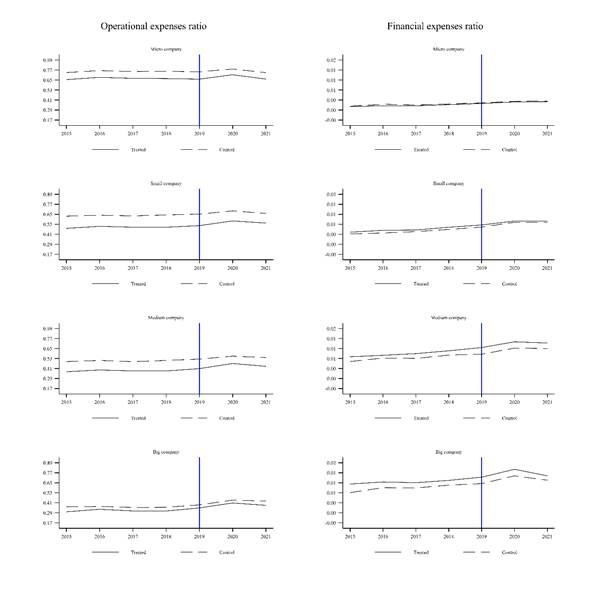
Data presented in Figure A1, A2 and A3 shows an important difference in the corporate performance of the companies between the control and treated groups; thus, the control group has a lower profitability than the treated group. At the same time, the level of indebtedness of the companies in the control group is slightly higher than that of the treated group. The treated companies also show better performance in terms of liquidity and management than the companies in the control group. These differences between the groups will be used to determine the impact of the pandemic on the corporate performance of companies. Descriptive statistics also reveal an improvement in 2021 in several financial indicators, although pre-pandemic levels are not observed. Section 5 determines if this effect remains in the empirical analysis.
4.4. Model specification
In the simplest case, the model to estimate the impact of COVID-19 with two time periods is:
 (1)
(1)
Where the subscript i, j and t represent unit, sector and time, respectively. The variable y is the outcome of interest, Treat is a dummy that assumes the value of 1 if the company belongs the treatment group, and Post is a dummy for the pandemic period. α is the base result for control group prior pandemic, β gives the difference between the treatment and control group prior pandemic, δ captures the year effect that is assumed common across observations, and θ is the DID coefficient of the interaction and gives an estimation of differences in y between the treatment and control group in the pandemic period. This estimate is known as the Difference-in-Difference estimator implemented in a linear regression model. X ijt controls the characteristics of the companies that can affect the company's financial performance that can change over time, ϵ ijt is the disturbance term.
4.5 Heterogeneity effects
The effects of the COVID-19 pandemic may depend on firm characteristics and the financial situation of the firm before the pandemic. Such heterogeneous effects could be captured using a triple difference model. The varied impact of COVID-19 is assessed for micro, small, and medium-sized enterprises and is compared with the effect on large companies.
Table 2 Descriptive statistics of panel data
| Variable | Year | Number of firms | Mean | Std. Dev. | Min | Max | Median |
|---|---|---|---|---|---|---|---|
| ROA | 2019 | 22,428 | 0.070 | 0.088 | 0.000 | 0.974 | 0.047 |
| 2020 | 22,432 | -0.115 | 0.470 | -7.346 | 0.834 | 0.002 | |
| 2021 | 22,432 | -0.122 | 0.514 | -7.912 | 0.906 | 0.020 | |
| Operating margin | 2019 | 22,428 | 0.076 | 0.101 | 0.000 | 0.745 | 0.044 |
| 2020 | 22,432 | -0.175 | 0.507 | -7.895 | 0.702 | 0.002 | |
| 2021 | 22,432 | -0.162 | 0.581 | -8.923 | 0.815 | 0.023 | |
| Sales turnover | 2019 | 22,428 | 1.197 | 1.166 | 0.001 | 26.151 | 0.957 |
| 2020 | 22,432 | 0.999 | 1.001 | 0.004 | 15.386 | 0.763 | |
| 2021 | 22,432 | 1.105 | 1.046 | 0.008 | 18.907 | 0.895 | |
| Acid test | 2019 | 24,894 | 1.767 | 2.830 | 0.063 | 58.634 | 1.058 |
| 2020 | 24,892 | 2.108 | 3.963 | 0.054 | 67.713 | 1.135 | |
| 2021 | 24,892 | 2.139 | 4.690 | 0.057 | 76.835 | 1.121 | |
| Asset indebtedness | 2019 | 32,478 | 0.602 | 0.273 | 0.000 | 4.258 | 0.603 |
| 2020 | 32,483 | 0.594 | 0.315 | 0.000 | 5.007 | 0.595 | |
| 2021 | 32,483 | 0.603 | 0.316 | 0.000 | 5.055 | 0.606 | |
| Impact of administrative and sales expenses | 2019 | 25,808 | 0.335 | 0.460 | 0.000 | 11.083 | 0.223 |
| 2020 | 25,809 | 0.378 | 0.506 | 0.000 | 15.685 | 0.262 | |
| 2021 | 25,809 | 0.361 | 0.629 | 0.000 | 16.619 | 0.232 | |
| Financial burden impact | 2019 | 25,808 | 0.016 | 0.020 | 0.000 | 0.125 | 0.008 |
| 2020 | 25,809 | 0.019 | 0.026 | 0.000 | 0.178 | 0.009 | |
| 2021 | 25,809 | 0.016 | 0.022 | 0.000 | 0.177 | 0.008 |
Source: own elaboration using Superintencia de Compañías database for the period 2019 and 2020.
Following Gruber's (1994) , the triple difference approach, referred to as Differences in Differences in Differences (DDD), consists of comparing the change experienced by the firms of interest in the treated sectors during the pandemic period with the change experienced by the firms of interest in the untreated sectors. In a subsequent step, the above result is compared with the change experienced by the firms not considered in the treated sectors relative to the change experienced by these firms in the untreated sectors. Thus, this method provides an estimate of the average outcomes that MSEs (Micro and Small Enterprises) would likely have experienced in the affected sectors in comparison to the changes experienced by large firms in the same sectors. Simultaneously, it controls for other factors that may influence the results.
We would expect to see a significant positive or negative specific coefficient in the interaction term, increasing or decreasing the COVID-19 pandemic impact depending on the type of firm relative to the reference group. Equation 2 formalizes the heterogeneous effects of COVID-19 through the triple-difference model.
 (2)
(2)
k n is a dummy variable that takes the value 1 if the firm is of type n. The model considers four types of firms-micro, small, and medium-and compares them with large companies. α represents the baseline result for the control group before the pandemic. β and λ capture time-invariant characteristics of the treated sectors and the analysed firms, respectively. δ measures changes in the indicators over time. θ controls for changes over time in the affected sectors. ε j measures change over time for companies of interest nationwide. ϕ j estimates the change in time-invariant characteristics of the targeted firms in the sectors concerned. Finally, φ j is the coefficient of DDD, which captures the variation in the financial indicator of the firms of interest (relative to the remaining firms) in the affected sectors (relative to the unaffected sectors) in the years following the pandemic (relative to before the pandemic). This estimation is referred to as the Differences-in-Differences-in-Differences (DDD) applied to a linear regression model. A statistically significant DDD coefficient indicates that the pandemic had a differentiated impact on financial performance depending on the type of company.
5. Results
The section below presents the main results of the empirical analysis. The analysis is organized according to the impact of the COVID-19 pandemic on the profitability, solvency, liquidity, and management of companies.
Our hypothesis is that the impact of COVID-19 varied among different types of companies. To analyze this, the model includes heterogeneous effects through the interaction of the DID effects with dummies for firm size. Table 3 presents the effects of the COVID-19 pandemic on firm profitability. The results indicate that the DID coefficient for Treated*Post is statistically significant, thus suggesting a negative impact of the pandemic on company profitability. According to the results, the COVID-19 pandemic led to a decrease in ROA by -0.040, which is statistically significant compared to the change observed in the control group. However, this result hides significant heterogeneity in the impact of the pandemic on different types of companies. Column 2 of the table reveals this heterogeneity; small firms experienced the greatest impact, with a statistically significant negative effect on ROA for treated firms (-0.134) compared to the change observed in large companies. Similarly, the interaction coefficient for micro companies was negative (-0.122). The interaction coefficients for medium-sized enterprises (-0.062) were lower than those for MSEs. This evidence indicates that the impact of the pandemic has been unevenly distributed, with considerable variation between company sizes, and highlights the dependence of the spread and impact of the COVID-19 pandemic on the type of company.
Table 3 reveals a substantial decline in the operating margin of -0.058 percentage points (p.p.) compared to the control group. Column 4 of Table 3 demonstrates a significant finding that aligns with the global impact of the COVID-19 pandemic: a notable effect on MSEs. The Table shows a strong contraction of the operating margin in all companies, in particular, micro and small enterprises.
Table 3 Impact of COVID-19 on firm profitability: Return on Assets (ROA) and operational margin
| ROA | Operational margin | |||
|---|---|---|---|---|
| (1) | (2) | (3) | (4) | |
| Post | -0.246*** | -0.238*** | -0.182*** | -0.265*** |
| (0.011) | (0.020) | (0.013) | (0.023) | |
| Treated | 0.013 | 0.014*** | -0.017*** | -0.010 |
| (0.008) | (0.004) | (0.002) | (0.006) | |
| Treated*Post | -0.040*** | 0.062*** | -0.058*** | 0.021 |
| (0.010) | (0.021) | (0.006) | (0.013) | |
| Treated*Post*Micro | -0.122*** | -0.085*** | ||
| (0.026) | (0.014) | |||
| Treated*Post*Small | -0.134*** | -0.086*** | ||
| (0.021) | (0.017) | |||
| Treated*Post*Median | -0.062*** | -0.065*** | ||
| (0.017) | (0.013) | |||
| Micro company | -0.020 | 0.047*** | -0.005 | -0.014 |
| (0.013) | (0.009) | (0.012) | (0.012) | |
| Small company | -0.029*** | 0.008*** | -0.009 | -0.010 |
| (0.010) | (0.002) | (0.010) | (0.012) | |
| Medium company | -0.027*** | -0.006* | -0.014 | -0.009* |
| (0.005) | (0.003) | (0.010) | (0.005) | |
| Post Micro | -0.041* | 0.095*** | ||
| (0.021) | (0.016) | |||
| Post Small | 0.027 | 0.093*** | ||
| (0.028) | (0.017) | |||
| Post Median | 0.003 | 0.053*** | ||
| (0.019) | (0.018) | |||
| Treat Micro | 0.001 | -0.006 | ||
| (0.004) | (0.006) | |||
| Treat Small | 0.001 | -0.015** | ||
| (0.006) | (0.007) | |||
| Treat Median | 0.003 | -0.008** | ||
| (0.003) | (0.003) | |||
| Constant | 0.089*** | 0.044*** | 0.058*** | 0.064*** |
| (0.018) | (0.012) | (0.010) | (0.012) | |
| N | 55791 | 55791 | 55791 | 55791 |
| Adj. Rsq | 0.073 | 0.075 | 0.077 | 0.077 |
All regressions are estimated using annual data. The base category for company size is large companies. Complete results are available upon request. All regressions control for province and company age. Statistical significance indicated at the *** 1 percent, ** 5 percent and * 10 percent level. Standard errors clustered at provincial level are in parenthesis.
Source: own elaboration using Superintendency of Companies database several years.
The findings indicate a reduction in company profitability, which is consistent with the studies conducted by Roy & Das (2020) , Shafi et al. (2020) , Amnim et al. (2021) , Hwang et al. (2021) , and Labadze & Sraieb (2023) , who established the negative impact of the COVID-19 outbreak on the profitability of companies involved in the production of essential goods, such as manufacturing. Consequently, this negative impact had a multiplier effect, affecting other sectors including agriculture, tourism, accommodation, and transportation services due to the worldwide implementation of confinement measures (Demmou et al., 2021; Kökény et al., 2022). Furthermore, it is crucial to acknowledge that profitability is influenced by specific characteristics of each industry; therefore, it varies among different types of enterprises (Phan et al., 2015).
Table 4 illustrates the impact of the COVID-19 pandemic on solvency, which varies depending on the company size. According to column 1, asset indebtedness increased by 0.013 because of the pandemic, compared to the change observed in the control group. Column 2 shows that asset indebtedness increased by 2.5 p.p. in microenterprises in relation to the observed change during the pandemic. No statistically significant differentiated effect is observed for the rest of the companies. Overall results can be attributed to the fact that small and micro enterprises resorted to increasing or acquiring debts and outstanding obligations to address the lack of liquidity and cover expenses related to the acquisition of goods, inventories, rights, and other resources. Furthermore, medium and large manufacturing companies did not experience a high impact on their debt due to their capacity to meet obligations with shareholder capital and through inventory turnover. Additionally, firms in the service sectors particularly accumulated accounts payable due to their inability to operate normally, resulting in insufficient resources to cover expenses and an increase in liabilities. Maintaining a low level of indebtedness is crucial for companies as it directly contributes to their profitability and helps consolidate their market position, which prevent from closure (Achim et al., 2022; Gajdosikova et al., 2022; Zajmi, 2021). Nguyen et al. (2022) propose that the vulnerability and sensitivity of companies to the risk of accumulating debt can explain the increase in corporate indebtedness (Alshammari, 2020). Goel & Garralda (2020) and Didier et al. (2021) point out that companies significantly increased their indebtedness during the pandemic, as they had low levels of cash reserves and used these credits to cover liquidity deficits and increase their reserves. Thus, Zheng (2022) emphasizes the importance of reserves to face COVID-19 pandemic. Similarly, Bloom et al. (2021) emphasize that large companies had the advantage of accessing lines of credit, which provided support during periods of loss, unlike micro and small businesses. According to Didier et al. (2021), the substantial increase in indebtedness among companies in the services sector can be attributed to limited flexibility in debt negotiations and the absence of reserves, which forces companies to resort to indebtedness for survival.
Table 4 Impact of COVID-19 on firm solvency, liquidity, and management
| Indebtedness of the asset | Acid test | |||
| (1) | (2) | (3) | (4) | |
| Post | 0.008 | -0.004*** | 0.190*** | 0.147 |
| (0.006) | (0.001) | (0.022) | (0.250) | |
| Treated | -0.013* | 0.091*** | 0.055 | -0.532* |
| (0.007) | (0.017) | (0.064) | (0.270) | |
| Treated*Post | 0.013*** | -0.004 | -0.089** | -0.014 |
| (0.004) | (0.005) | (0.034) | (0.188) | |
| Treated*Post*Micro | 0.025** | -0.209 | ||
| (0.010) | (0.284) | |||
| Treated*Post*Small | 0.009 | 0.006 | ||
| (0.007) | (0.224) | |||
| Treated*Post*Median | 0.006 | 0.078 | ||
| (0.004) | (0.101) | |||
| Micro company | -0.089 | 0.004 | 1.292*** | 0.467*** |
| (0.055) | (0.056) | (0.290) | (0.106) | |
| Small company | 0.077** | 0.105*** | 0.304 | 0.045 |
| (0.028) | (0.017) | (0.204) | (0.103) | |
| Medium company | 0.066*** | 0.082*** | 0.013 | 0.120 |
| (0.005) | (0.009) | (0.155) | (0.129) | |
| Post Micro | 0.025*** | 0.085 | ||
| (0.009) | (0.275) | |||
| Post Small | -0.004 | 0.066 | ||
| (0.006) | (0.276) | |||
| Post Median | -0.009* | -0.141 | ||
| (0.005) | (0.131) | |||
| Treat Micro | -0.163*** | 1.208*** | ||
| (0.019) | (0.320) | |||
| Treat Small | -0.043** | 0.290 | ||
| (0.020) | (0.280) | |||
| Treat Median | -0.022 | -0.081 | ||
| (0.018) | (0.116) | |||
| Constant | 0.562*** | 0.501*** | 1.894*** | 2.328*** |
| (0.030) | (0.026) | (0.118) | (0.159) | |
| N | 97322 | 97322 | 61268 | 61268 |
| Adj. Rsq | 0.040 | 0.045 | 0,028 | 0.028 |
All regressions are estimated using annual data. The base category for company size is large companies. Complete results are available upon request. All regressions control for province and company age. Statistical significance indicated at the *** 1 percent, ** 5 percent and * 10 percent level. Standard errors clustered at provincial level are in parenthesis.
Source: own elaboration using Superintendency of Companies database several years.
Table 4 presents the estimation results of equation 1 for company liquidity in columns 3 and 4, measured using a fundamental indicator: the acid test ratio. In the first specification, the DID coefficient is statistically significant, indicating an average reduction of 8.9 p.p. in the acid test ratio for the companies compared to the control group. The coefficient of the interaction term for company size is not statistically significant, which indicates a non-differentiated effect of the pandemic on liquidity. These findings align with previous studies conducted by Alshammari (2020) , Hanim et al. (2021) , and Khatib & Nour (2021) , which also demonstrate a negative impact during the pandemic period. Similarly, Karim et al. (2021) found that the liquidity indices of companies were severely affected during the second quarter of 2020, emphasizing the critical link between liquidity and the primary objective of businesses’ profitability. The results do not support a heterogeneous impact on company liquidity, as indicated by Blanco et al. (2021) , Eggers (2020) , Labadze & Sraieb (2023) , and Shafi et al. (2020) .
To assess the impact of the COVID-19 pandemic on company management, the analysis considers sales turnover ratio, the burden of administrative and sales expenses, and the burden of financial expenses. In the first specification (column 1 of Table 5), when all companies are aggregated, the DID coefficient is negative and statistically significant. This suggests a significant overall change in sales turnover for the companies. When examining the impact of the pandemic based on company size, column 2 reveals a significant heterogeneity of the pandemic on sales turnover. Specifically, there was a decrease of -0.433 and -0.050 in sales turnover for micro and small companies, respectively. Additionally, the results demonstrate a negative effect (not statistically significant) of the pandemic on medium-sized companies. This decline reflects the significant contraction in sales experienced by MSEs companies. The results align with the studies conducted by Shen et al. (2020) and Shafi et al. (2020) , which highlight the restrictive effect of the pandemic on company production, leading to reduced sales and profits. Once again, the evidence emphasizes that the effect of the COVID-19 pandemic is reliant on the size of the companies and the specific sector of activity.
Analysis for operating expenses (administrative and sales expenses) confirms previous findings. According to Table 5, the operating expenses ratio increased by 6.1 p.p. during the pandemic period compared to the control group. As expected, the effect of the pandemic on expenses varied depending on the size of the company, with micro companies experiencing the greatest im-pact. The rise in operating expenses for small companies is due to the costs incurred for adapting and reducing expenses in an uncertain economic environment, including safety and compliance-related expenses. This is significant because the rise in expenses directly translates into a reduction in profitability, especially for service companies. These results are consistent with those found by Wang et al. (2023) , who observed a greater increase in administrative expenses between 2019 and 2020 compared to previous years. Additionally, the decline in sales further exacerbated the situation, leading to a decrease in overall company performance (Shen et al., 2020).
Financial expenses were also impacted by the pandemic, as evidenced by a 0.1 increase in the financial expense ratio compared to the control group (Column 5, Table 5). The results do not show a differentiated effect according to company size.
Table 5 Impact of COVID-19 on firm management: impact of administrative and sales expenses, impact of financial expenses and cost of sales ratio.
| Sales turnover | Impact of administrative and sales expenses | Impact of financial expenses | ||||
|---|---|---|---|---|---|---|
| (5) | (6) | (1) | (2) | (3) | (4) | |
| Post | -0.363*** | -0.094*** | 0.019** | 0.059*** | 0.001*** | 0.003** |
| (0.046) | (0.020) | (0.007) | (0.017) | (0.000) | (0.001) | |
| Treated | 0.017 | -0.379** | 0.069*** | 0.057** | 0.002*** | 0.001 |
| (0.116) | (0.145) | (0.013) | (0.027) | (0.000) | (0.002) | |
| Treated*Post | -0.206*** | -0.059*** | 0.061*** | 0.013 | 0.001*** | 0.001 |
| (0.043) | (0.016) | (0.009) | (0.030) | (0.000) | (0.002) | |
| Treated*Post*Micro | -0.433*** | 0.091*** | -0.001 | |||
| (0.061) | (0.019) | (0.002) | ||||
| Treated*Post*Small | -0.050* | 0.010 | -0.001 | |||
| (0.028) | (0.040) | (0.002) | ||||
| Treated*Post*Median | -0.012 | 0.015 | 0.000 | |||
| (0.026) | (0.028) | (0.002) | ||||
| Micro company | 1.558*** | 1.459*** | 0.295*** | 0.260*** | -0.016*** | -0.014*** |
| (0.064) | (0.078) | (0.024) | (0.035) | (0.001) | (0.002) | |
| Small company | 0.631*** | 0.434*** | 0.132*** | 0.127*** | -0.010*** | -0.010*** |
| (0.033) | (0.073) | (0.014) | (0.035) | (0.001) | (0.002) | |
| Medium company | 0.220*** | 0.128*** | 0.025 | 0.084* | -0.004*** | -0.005* |
| (0.020) | (0.040) | (0.026) | (0.047) | (0.000) | (0.003) | |
| Post Micro | -0.467*** | -0.079*** | -0.003** | |||
| (0.117) | (0.019) | (0.001) | ||||
| Post Small | -0.142*** | 0.003 | -0.002 | |||
| (0.016) | (0.027) | (0.001) | ||||
| Post Median | -0.061* | -0.023 | -0.001 | |||
| (0.033) | (0.021) | (0.001) | ||||
| Treat Micro | 0.655*** | 0.060 | 0.000 | |||
| (0.048) | (0.041) | (0.002) | ||||
| Treat Small | 0.367*** | -0.004 | 0.001 | |||
| (0.085) | (0.036) | (0.002) | ||||
| Treat Median | 0.159*** | -0.070* | 0.002 | |||
| (0.038) | (0.037) | (0.003) | ||||
| Constant | 0.899*** | 1.016*** | 0.330*** | 0.340*** | 0.020*** | 0.019*** |
| (0.119) | (0.122) | (0.018) | (0.025) | (0.001) | (0.002) | |
| N | 55791 | 55791 | 63178 | 63178 | 62988 | 62988 |
| Adj. Rsq | 0.094 | 0.095 | 0.042 | 0.045 | 0.072 | 0.073 |
All regressions are estimated using annual data. The base category for company size is large companies. Complete results are available upon request. All regressions control for province and company age. Statistical significance indicated at the *** 1 percent, ** 5 percent and * 10 percent level. Standard errors clustered at provincial level are in parenthesis.
Source: own elaboration using Superintendency of Companies database several years.
This result reflects the strategies employed by companies to mitigate the pandemic's effects and indicate that companies had to rely on external financing to face the challenges posed by the pandemic, which lead to a higher burden of financial expenses. Medium companies with stronger financial foundations and higher investments in equity and assets enjoyed better access to credit channels; this enabled them to address the challenges posed by the pandemic. In contrast, small companies with limited access to credit faced difficulties in obtaining necessary funds.
5.1 Economic recovery in 2021 and its impact on business performance
In this section, we examine how the economic recovery in 2021 influenced the financial performance of companies. Our analysis is based on the following model:
 (3)
(3)
Post st is an indicator variable that takes the value of 1 for the j-th period after treatment and 0 otherwise. The variables are defined in the same way as in Equation 2. The results in Table 6 and Table 7 show the post-COVID-19 recovery phase's impact on corporate financial performance. The negative effects of the pandemic continue in 2021, but with differences according to the company size. That year, the ROA of the companies decreased by 5.2 percentage points in the treated group compared to the control group. In addition, the size of the company determined the impact on ROA: micro and small companies faced a significant negative impact. However, the impact on medium com-panies was not statistically significant, indicating an economic recovery. The operating margin experienced a significant decrease of -3.6 percentage points compared to 2019. This decline can be attributed to the ongoing increase in expenses and business costs throughout 2021. In addition, no statistically significant effects were observed that year with respect to the level of asset leverage or the acid test with respect to firm size, except for micro firms. This suggests that the impact of the pandemic on solvency and liquidity was mainly limited to 2020.
Table 6 Impact of COVID-19 on financial performance in 2021: profitability, solvency and liquidity
| ROA | Operational margin | Indebtedness of the asset | Acid test | |||||
|---|---|---|---|---|---|---|---|---|
| (1) | (2) | (3) | (4) | (5) | (6) | (7) | (8) | |
| Post1 | -0.246*** | -0.238*** | -0.182*** | -0.265*** | 0.008 | -0.004*** | 0.190*** | 0.147 |
| (0.011) | (0.020) | (0.013) | (0.023) | (0.006) | (0.001) | (0.022) | (0.250) | |
| Post2 | -0.218*** | -0.187*** | -0.186*** | -0.226*** | 0.003 | -0.003 | 0.443*** | 0.079 |
| (0.010) | (0.009) | (0.014) | (0.027) | (0.008) | (0.004) | (0.036) | (0.215) | |
| Treated | 0.028*** | 0.024*** | -0.009*** | -0.006 | -0.011 | 0.092*** | 0.084 | -0.515* |
| (0.009) | (0.003) | (0.002) | (0.005) | (0.007) | (0.017) | (0.053) | (0.265) | |
| Treated*Post1 | -0.040*** | 0.062*** | -0.058*** | 0.021 | 0.013*** | -0.004 | -0.088** | -0.014 |
| (0.010) | (0.021) | (0.006) | (0.013) | (0.004) | (0.005) | (0.034) | (0.188) | |
| Treated*Post2 | -0.052*** | 0.016 | -0.036*** | -0.011 | 0.020*** | 0.003 | -0.208*** | 0.035 |
| (0.009) | (0.022) | (0.008) | (0.016) | (0.006) | (0.004) | (0.053) | (0.127) | |
| Treated*Post1*Micro | -0.122*** | -0.085*** | 0.025** | -0.209 | ||||
| (0.026) | (0.014) | (0.010) | (0.285) | |||||
| Treated*Post2*Micro | -0.096*** | -0.050*** | 0.030*** | -0.362 | ||||
| (0.032) | (0.013) | (0.010) | (0.253) | |||||
| Treated*Post1*Small | -0.134*** | -0.086*** | 0.009 | 0.006 | ||||
| (0.021) | (0.017) | (0.007) | (0.224) | |||||
| Treated*Post2*Small | -0.073*** | -0.012 | 0.006 | -0.262 | ||||
| (0.022) | (0.018) | (0.009) | (0.197) | |||||
| Treated*Post1*Median | -0.062*** | -0.065*** | 0.006 | 0.078 | ||||
| (0.017) | (0.013) | (0.004) | (0.102) | |||||
| Treated*Post2*Median | -0.044 | 0.023 | -0.005 | 0.166 | ||||
| (0.027) | (0.029) | (0.005) | (0.189) | |||||
| Micro company | -0.040*** | 0.037*** | -0.002 | -0.021* | -0.083 | 0.004 | 1.392*** | 0.457*** |
| (0.011) | (0.007) | (0.012) | (0.010) | (0.057) | (0.056) | (0.315) | (0.108) | |
| Small company | -0.048*** | 0.000 | -0.009 | -0.015 | 0.075** | 0.105*** | 0.350 | 0.036 |
| (0.006) | (0.002) | (0.011) | (0.010) | (0.032) | (0.017) | (0.241) | (0.104) | |
| Medium company | -0.033*** | -0.011*** | -0.013 | -0.012*** | 0.063*** | 0.082*** | 0.019 | 0.115 |
| (0.006) | (0.003) | (0.012) | (0.004) | (0.006) | (0.009) | (0.165) | (0.125) | |
| Post1 Micro | -0.041* | 0.095*** | 0.025*** | 0.085 | ||||
| (0.021) | (0.016) | (0.009) | (0.275) | |||||
| Post2 Micro | -0.044** | 0.069*** | 0.015 | 0.554* | ||||
| (0.016) | (0.016) | (0.012) | (0.313) | |||||
| Post1 Small | 0.027 | 0.093*** | -0.004 | 0.066 | ||||
| (0.028) | (0.017) | (0.006) | (0.276) | |||||
| Post2 Small | -0.030 | 0.030 | -0.008 | 0.380 | ||||
| (0.019) | (0.021) | (0.017) | (0.323) | |||||
| Post1 Median | 0.003 | 0.053*** | -0.009* | -0.141 | ||||
| (0.019) | (0.018) | (0.005) | (0.131) | |||||
| Post2 Median | -0.000 | -0.011 | -0.007* | -0.143 | ||||
| (0.016) | (0.029) | (0.004) | (0.102) | |||||
| Treat Micro | 0.009 | -0.002 | -0.162*** | 1.209*** | ||||
| (0.007) | (0.005) | (0.019) | (0.324) | |||||
| Treat Small | 0.008 | -0.011** | -0.043** | 0.296 | ||||
| (0.008) | (0.005) | (0.020) | (0.284) | |||||
| Treat Median | 0.008 | -0.005* | -0.022 | -0.078 | ||||
| (0.004) | (0.003) | (0.018) | (0.116) | |||||
| Constant | 0.046*** | 0.032*** | 0.052*** | 0.064*** | 0.557*** | 0.499*** | 1.789*** | 2.295*** |
| (0.009) | (0.010) | (0.012) | (0.012) | (0.032) | (0.027) | (0.153) | (0.140) | |
| N | 83.685 | 83.685 | 83.685 | 83.685 | 145.979 | 145.979 | 91902 | 91902 |
| Adj. Rsq | 0,049 | 0,051 | 0.044 | 0,044 | 0.036 | 0,038 | 0.028 | 0.03 |
All regressions are estimated using annual data. The base category for company size is large companies. Complete results are available upon request. All regressions control for province and company age. Statistical significance indicated at the *** 1 percent, ** 5 percent and * 10 percent level. Standard errors clustered at provincial level are in parenthesis.
Source: own elaboration using Superintendency of Companies database several years.
Table 7 shows the impact of the economic recovery in 2021 on asset management. As in 2020, results indicate a decrease in sales turnover for micro and small companies, with declines of -0.443 and -0.069, respectively. Conversely, there is no statistically significant effect in the case of medium-sized companies. Similar to 2020, micro companies experienced an increase in financial expenses in 2021. This can be explained because from that year on micro and small businesses resumed paying the interest rates that had been temporarily suspended during the pandemic. As a result, their financial expenses increased. In summary, a complete recovery from the effects of the pandemic is still not evident in 2021.
Table 7 Impact of COVID-19 on financial performance in 2021: asset management
| Sales turnover | Operational expenses ratio | Financial expenses ratio | ||||
|---|---|---|---|---|---|---|
| (1) | (2) | (3) | (4) | (5) | (6) | |
| Post1 | -0.363*** | -0.094*** | 0.019** | 0.059*** | 0.0012*** | 0.0033** |
| (0.046) | (0.020) | (0.007) | (0.017) | (0.0003) | (0.0014) | |
| Post2 | -0.309*** | -0.061*** | 0.007 | 0.093** | 0.0013*** | 0.0006 |
| (0.064) | (0.018) | (0.008) | (0.043) | (0.0002) | (0.0009) | |
| Treated | -0.010 | -0.391*** | 0.065*** | 0.056* | 0.0016*** | 0.0009 |
| (0.107) | (0.134) | (0.010) | (0.028) | (0.0001) | (0.0022) | |
| Treated*Post1 | -0.206*** | -0.059*** | 0.061*** | 0.013 | 0.0005*** | 0.0011 |
| (0.043) | (0.016) | (0.009) | (0.030) | (0.0002) | (0.0020) | |
| Treated*Post2 | -0.144*** | 0.018 | 0.056*** | -0.032 | 0.0004*** | 0.0018 |
| (0.036) | (0.025) | (0.009) | (0.046) | (0.0001) | (0.0013) | |
| Treated*Post1*Micro | -0.433*** | 0.091*** | -0.0009 | |||
| (0.061) | (0.019) | (0.0021) | ||||
| Treated*Post2*Micro | -0.443*** | 0.110** | -0.0016 | |||
| (0.046) | (0.053) | (0.0013) | ||||
| Treated*Post1*Small | -0.050* | 0.010 | -0.0012 | |||
| (0.028) | (0.040) | (0.0019) | ||||
| Treated*Post2*Small | -0.069** | 0.067 | -0.0020 | |||
| (0.027) | (0.046) | (0.0013) | ||||
| Treated*Post1*Median | -0.012 | 0.015 | 0.0004 | |||
| (0.026) | (0.028) | (0.0015) | ||||
| Treated*Post2*Median | -0.044 | 0.085 | -0.0006 | |||
| (0.036) | (0.052) | (0.0019) | ||||
| Micro company | 1.435*** | 1.474*** | 0.282*** | 0.262*** | -0.0159*** | -0.0145*** |
| (0.043) | (0.077) | (0.022) | (0.034) | (0.0010) | (0.0023) | |
| Small company | 0.618*** | 0.446*** | 0.129*** | 0.129*** | -0.0100*** | -0.0100*** |
| (0.035) | (0.072) | (0.015) | (0.034) | (0.0011) | (0.0023) | |
| Medium company | 0.205*** | 0.136*** | 0.031 | 0.085* | -0.0035*** | -0.0051* |
| (0.023) | (0.039) | (0.027) | (0.047) | (0.0003) | (0.0025) | |
| Post1 Micro | -0.467*** | -0.079*** | -0.0030** | |||
| (0.117) | (0.019) | (0.0013) | ||||
| Post2 Micro | -0.462*** | -0.129** | -0.0000 | |||
| (0.100) | (0.050) | (0.0008) | ||||
| Post1 Small | -0.142*** | 0.003 | -0.0015 | |||
| (0.016) | (0.027) | (0.0011) | ||||
| Post2 Small | -0.091** | -0.054 | 0.0017** | |||
| (0.040) | (0.041) | (0.0007) | ||||
| Post1 Median | -0.061* | -0.023 | -0.0011 | |||
| (0.033) | (0.021) | (0.0012) | ||||
| Post2 Median | -0.053 | -0.050 | 0.0013 | |||
| (0.045) | (0.043) | (0.0014) | ||||
| Treat Micro | 0.646*** | 0.057 | 0.0003 | |||
| (0.047) | (0.040) | (0.0023) | ||||
| Treat Small | 0.359*** | -0.006 | 0.0010 |
All regressions are estimated using annual data. The base category for company size is large companies. Complete results are available upon request. All regressions control for province and company age. Statistical significance indicated at the *** 1 percent, ** 5 percent and * 10 percent level. Standard errors clustered at provincial level are in parenthesis.
Source: own elaboration using Superintendency of Companies database several years.
5.2 Impact of the pandemic on exporting companies
In this section, we examine how the export behavior of companies influences the impact of the pandemic on business performance. The COVID-19 pandemic has had a global impact on companies, with restrictions and social isolation measures significantly affecting world trade. Trade and transportation costs have increased, impacting the costs of imports and exports (Minondo, 2021; Vo & Tran, 2021). As a result, the export behavior of companies becomes crucial in determining the effects of the pandemic.
The challenges primarily occurred within supply chains due to uncertainty in international trade. Several studies highlight the severity of export declines, particularly for small agricultural enterprises that are economically vulnerable, while larger enterprises showed better resilience. Similarly, trade costs induced by COVID-19 hindered companies' operations by making it difficult to import raw materials and export products or services. Research on the Asian context reveals that supply chains experienced significant disruptions that affected the trade of goods in countries like China, Japan, and South Korea. The study emphasizes that if an exporting country imports raw materials from heavily affected pandemic areas, its exports of related goods decline. Additionally, international companies operating in global markets faced greater impacts from the pandemic compared to local companies. However, these international firms demonstrated more resilience, underscoring the importance of global connections and international trade in mitigating the effects of crises (Borino et al., 2021; Hayakawa & Mukunoki, 2021; Lin & Zhang, 2020; Vo & Tran, 2021).
For a more simplified analysis, we consider only three indicators: ROA, operating margin and sales turnover. To classify the companies according to their export behavior, a non-hierarchical cluster analysis was carried out using the k-means method, which allowed establishing the thresholds to identify the companies. In this analysis, a company is considered an exporter if its exports exceed 43.31% of total sales.
Following Equation 4, Table 8 shows how the COVID-19 pandemic affected exporting and non-exporting companies. Results reveal that the pandemic affected those firms differently.
 (4)
(4)
Where Exp j = 1 for non-exporters, 0 otherwise. The rest of the variables are defined as in Equation 3. Table 8 illustrates the impact of the COVID-19 pandemic on the profitability of exporting companies. The analysis of the ROA, based on the size of the companies, reveals significant results for the Ecuadorian context, i.e., an increase in this indicator among micro and small exporting companies during the analysis period. In contrast, medium and large companies experienced significant declines of 0.224 and 0.097, respectively, during 2021.This phenomenon could be attributed to the specific composition of this market segment, where micro and small enterprises, having a greater involvement in professional service activities, were less affected by the crisis generated by COVID-19. However, medium and large enterprises, more heavily involved in activities such as manufacturing and commerce, experienced the consequences more prominently, given the significant impact of the pandemic on these sectors.
Table 8 Impact of COVID-19 on profitability of exporting and non-exporting firms
| ROA | ||||
|---|---|---|---|---|
| Micro | Small | Medium | Large | |
| Post1 | -0.320*** | -0.263*** | -0.228*** | -0.179*** |
| (0.005) | (0.011) | (0.014) | (0.007) | |
| Post2 | -0.287*** | -0.260*** | -0.202*** | -0.169*** |
| (0.004) | (0.012) | (0.012) | (0.016) | |
| Exporter | -0.014 | 0.010 | 0.004 | -0.010 |
| (0.017) | (0.009) | (0.009) | (0.008) | |
| Exporter*Post1 | 0.119*** | 0.018 | -0.259*** | -0.174* |
| (0.029) | (0.052) | (0.079) | (0.086) | |
| Exporter*Post2 | 0.018 | 0.020 | -0.224** | -0.097* |
| (0.087) | (0.065) | (0.094) | (0.047) | |
| Constant | 0.033*** | 0.086*** | 0.073*** | 0.053*** |
| (0.011) | (0.008) | (0.018) | (0.011) | |
| N | 32790 | 31011 | 13497 | 6378 |
| Adj. Rsq | 0.048 | 0.055 | 0.062 | 0.055 |
| Operational margin | ||||
| Micro | Small | Medium | Large | |
| Post1 | -0.214*** | -0.221*** | -0.245*** | -0.247*** |
| (0.012) | (0.008) | (0.012) | (0.023) | |
| Post2 | -0.198*** | -0.214*** | -0.229*** | -0.233*** |
| (0.009) | (0.008) | (0.008) | (0.022) | |
| Exporter | -0.002 | 0.002 | -0.013** | -0.004 |
| (0.012) | (0.006) | (0.006) | (0.023) | |
| Exporter*Post1 | 0.066*** | 0.078*** | -0.006 | -0.023 |
| (0.020) | (0.021) | (0.024) | (0.035) | |
| Exporter*Post2 | 0.058** | 0.051 | 0.011 | -0.024 |
| (0.022) | (0.043) | (0.030) | (0.050) | |
| Constant | 0.006 | 0.048*** | 0.068*** | -0.021 |
| (0.007) | (0.006) | (0.011) | (0.024) | |
| N | 32790 | 31011 | 13497 | 6378 |
| Adj. Rsq | 0.036 | 0.046 | 0.052 | 0.069 |
| Sales turnover | ||||
| Micro | Small | Medium | Large | |
| Post1 | -0.895*** | -0.312*** | -0.211*** | -0.144*** |
| (0.080) | (0.011) | (0.013) | (0.025) | |
| Post2 | -0.808*** | -0.184*** | -0.122*** | -0.039** |
| (0.106) | (0.029) | (0.011) | (0.014) | |
| Exporter | 0.691*** | 0.858** | 1.036** | 0.682** |
| (0.089) | (0.401) | (0.488) | (0.272) | |
| Exporter*Post1 | 0.277*** | -0.105 | 0.073 | 0.076*** |
| (0.085) | (0.096) | (0.074) | (0.022) | |
| Exporter*Post2 | 0.105 | -0.143** | -0.344** | -0.133 |
| (0.124) | (0.059) | (0.147) | (0.096) | |
| Constant | 2.514*** | 1.599*** | 1.007*** | 0.691*** |
| (0.114) | (0.061) | (0.032) | (0.021) | |
| N | 32790 | 31011 | 13497 | 6378 |
| Adj. Rsq | 0.035 | 0.034 | 0.062 | 0.081 |
All regressions are estimated using annual data. The base category for company size is large companies. Complete results are available upon request. All regressions control for province and company age. Statistical significance indicated at the *** 1 percent, ** 5 percent and * 10 percent level. Standard errors clustered at provincial level are in parenthesis.
Source: own elaboration using Superintendency of Companies database several years.
This result is similar to that found for the operating margin, where medium and large enterprises experienced a decrease due to the increased costs imposed by the COVID-19 pandemic. These costs include higher rental and container transportation expenses, elevated freight charges, port delay fees, extended delivery times, and inventory maintenance costs. However, it is important to note that these results were not significant. Similarly, the findings suggest that both medium and large enterprises experienced a negative impact on sales due to COVID-19 in 2021, with reductions of 34 and 13 p.p., respectively. The economic standstill and the resulting uncertainty triggered a domino effect: the decrease in sales and revenue made it challenging to convert inventories into available cash, thus leading to a reduction in net profit.
5.3 Robustness checks
Parallel trend assumption
To ensure the accuracy of the findings, we conducted a parallel trend analysis, which also verified the stability of the data. In order to analyze the fulfillment of the parallel trends’ assumption, we examined the evolution of the average financial indicators for the control and treatment groups during the period 2015-2020, corresponding to the availability of comparable information. The results of the parallel trend test are presented in Figure A1, A2 and A3. The graphs are constructed to check the assumptions underlying the triple difference model, which is based on the assumption that the trends between the treated and control groups were comparable prior to the onset of the pandemic. For example, the figure shows the evolution of microenterprises in the treated sector compared to microenterprises in the control group, along with the evolution of large enterprises in the treated group compared to large enterprises in the control group. The data show that the performance variation trend of both the high-impact group and the low-impact group was comparable prior to the onset of the pandemic in most cases. This indicates that variables successfully comply with the assumption of parallel trends. This similarity in trends between the control and treated groups supports further modeling.
Event study estimates
To evaluate potential pre-existing trends between the treatment and control groups, we conducted an event study. This entails a gradual estimation design in which units may receive the treatment (the pandemic) at different time intervals, and there may be units that have never been treated (Sun & Abraham, 2021). In an event study, a hypothetical situation is examined, specifically evaluating the impact that the treatment would have in one or more periods before the actual treatment. The expectation is that there is no treatment effect on those treated in one or more periods preceding the reference period. The most common criterion to evaluate the presence of pre-existing trends is the individual significance of the coefficients estimated before the treatment (Rambachan & Roth, 2023). Building upon the methodology proposed by Sun & Abraham (2021), we formally introduce the equation to estimate the coefficients in the event study.
 (5)
(5)
Where the subscript s denotes the time elapsed from a reference period, in our case, a period before the actual treatment is considered, i.e., 2015-2021, which corresponds to the availability of comparable information. The coefficient corresponding to the year 2019 is normalized to zero.
Figure 1 and Figure 2 presents the triple interaction coefficients pre- and post-pandemic (φ ns ) along with the 95% confidence interval. In each estimate, it is compared relative to the change observed in large companies. There is no evidence of pre-trends in most cases, except for the acid test and sales turnover of small enterprises, and the expenses ratio of medium-sized enterprises, from which we cannot draw further conclusions. These results support the assumption of parallel trends, thereby validating the main findings. The results also highlight the differentiated impact of the pandemic and economic recovery on the financial performance of companies. The effect depends significantly on the size of the company, a crucial element when considering policies for reactivation and mitigation of the effects of the pandemic.
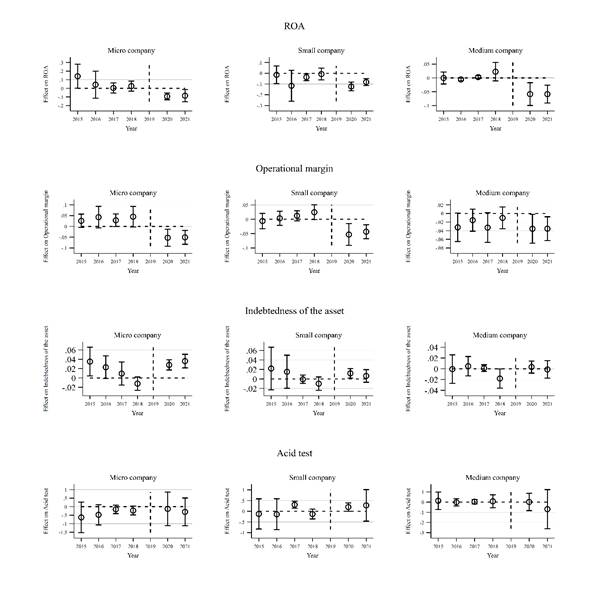
All regressions are estimated using annual data. The base category for company size is large companies. All regressions control for province, sector of activity, and company age. Standard errors clustered at provincial level are in parenthesis. Source: own elaboration using Superintendency of Companies database several years.
Figure 1 Event study estimation.

All regressions are estimated using annual data. The base category for company size is large companies. All regressions control for province, sector of activity and company age. Standard errors clustered at provincial level are in parenthesis Source: own elaboration using Superintendency of Companies database several years.
Figure 2 Event study estimation.
6. Conclusions
This paper aims to assess the impact of the COVID-19 pandemic on the corporate performance of companies in Ecuador focusing on profitability, solvency, liquidity, and asset management. The analysis considers company size to reveal specific country peculiarities. A Difference-in-Difference (DID) model and a triple difference model (DDD) are applied to a panel dataset at the company level. The estimated effects of the pandemic, while controlling for other relevant factors, demonstrate that the impact varied depending on company type. Micro and small companies were most affected, while large companies experienced a smaller impact. These findings are consistent with previous studies and highlight the varying impact of the pandemic across industries.
Furthermore, the study indicates that the negative effects of the pandemic on financial performance ex-tended into 2021 across most of the financial indicators of the companies. However, there are also indications signaling the commencement of a business recovery. It is important to note that the analysis for 2021 confirms that the impact of the economic recovery differs based on the company's size.
The results have policy implications and highlight the need to identify factors that determine the pandemic's impact on business performance. Understanding these factors can help prioritizing sectors for economic reactivation efforts and mitigating future effects on companies.