


 English (pdf)
 Article in xml format
 Article references
 Send this article by e-mail
 Cited by SciELO
  Cited by Google
  Similars in
SciELO
Similars in
SciELO  Similars in Google
 Permalink
ABBREVIATIONS
EMT Electromagnetic Transient
IBG Inverter Based Generation
DSOGI Double Second Order Generalized Integrator
IGBT Insulated Gate Bipolar Transistor
FLL Frequency Locked Loop
FRT Fault Ride Through
HVRT High Voltage Ride Through
LVRT Low Voltage Ride Though
PCC Point Common Coupling
PLL Phased Locked Loop
TSO Transmission System Operator
WTG Wind Turbine Generator
1. INTRODUCTION
Nowadays, electric power systems are in a rapid change of the global energy matrix pushed mainly by decarbonization goals and cost reduction of new technologies [1]. This aspect has made a fast-growing installation of generation based on wind and solar sources, which are based on new conversion technologies. Currently, the most used technologies for these conversion types are Inverter Based Generation (IBG) sources, which have entirely different dynamics in the power system.
Several studies have been carried out dealing with the new dynamics of IBG sources in power systems. For example, a comprehensive review of the IBG technology dealing with the inertia and frequency control issues is presented in [2], [3]. Additionally, the effect of these types of sources on fault detection has been studied. Studies like [4], [5], and, more recently [6], [7], present the differences between IBG and synchronous machines' short-circuit behavior since IBG currents respond to control logic. This control system limits the short circuit current to protect the inverter and modify the output waveform differently to fulfill a predefined control strategy. Usually, the maximum short-circuit currents are not higher than 1.2 times the rated current, which is significantly lower than the injected by conventional synchronous machine with the same nominal power. Additionally, the three-phase output characteristics depend mainly on the inverter’s control strategy, generating infinite behavior possibilities.
In this sense, IBGs are introducing new dynamics to the power system that may be studied in detail to analyze the power system’s impact, particularly to the already installed control and protection equipment [3], [8]. In [7] established that IBG unbalanced short-circuit current injection is contemplated in very few studies. Additionally, in [9], [10] is presented that the suppression of negative sequence components in the short-circuit current can cause protection scheme misoperation, making regulators establish requirements about negative sequence current injection in order to enhance the protection schemes performance [11].
Different efforts have been made to develop models that may reproduce the new dynamics of the IBGs. In [6], it is established that although multiple studies evaluate the IBG generation behavior as voltage sources, IBGs have not been thoroughly analyzed as current sources. Additionally, many of these studies use commercial software (CYME, DIgSILENT, and PSCAD/EMTDC), which do not present detailed descriptions and present several differences in the short-circuit current between these software tools. In agreement, [12] shows the importance of improving models and strategies for short-circuit calculation with wind turbines in commercial software packages since those fault analysis programs do not adequately capture the fault behavior of Wind Turbine Generator (WTG).
Further, in [12] [13], it is presented that IBG detailed models are delivered as black boxes due to the manufacturer's confidential politics, which prevents an exhaustive analysis of the potential hazards and drawbacks of integrating these plants into power systems.
Understanding the importance of IBGs accurate modeling for transient studies and the difficulty of obtaining the manufacturer detailed EMT models, studies such as [14], [15] propose type-4 WTG generic EMT full models based on detailed fault ride Through (FRT) studies. The generic model dynamic response is validated against field WTG measurements under various voltage deviations during faults and post-fault recovery. However, these studies do not consider negative sequence current injection.
Authors of [16] present the results of a survey carried out with different companies in the electricity sector about the type of model used according to the type of study to be carried out (see Figure 1). Where it can be seen how the RMS resolution is usually the most used on average, however, they point out that the trend in the future contemplates an increase in the use of EMT models from 22 % to 37 % on average. In the same direction, the authors of [17] state that advanced modeling and simulation tools are required to ensure the reliability and safety of future power systems. The high IBG penetration implies a decrease in the system strength, increasing stability problems for which EMT models are necessary.

Additionally, real-time simulators and hardware in the loop are increasingly used to face high IBG penetration issues.
Moreover, [18], [19] shows the importance of EMT models for interconnection studies of IBG sources in weak grids (with low inertia and short-circuit level), which localization usually are in remote regions where large renewable resources can be founded too. Therefore, implementing a versatile and economic EMT IBG model can benefit many Transmission System Operators (TSO). On the other hand, authors of [20], [21] describes the advantages of having generic WTG models. However, it is pointed out that a large part of the generic models developed only consider positive sequence and ignore control details such as grid synchronization. Thus, the models are unreliable for IBG power plants interconnection studies, especially in weak grids.
This paper discusses integrating a generic EMT IBG power plant model as a controlled current source as an enhanced version of the article presented in Symposium X SICEL 2021. This model is implemented in EMTP/ATP software, including all the necessary functionalities to evaluate short circuit studies and protection schemes. The main functionalities are a flexible positive-negative current control injection, current limitation, dynamic reactive power support, and programmable fault ride-through. It has advantages such as less computational load, fast initialization, and the capability to be executed with time step sizes up to 200 μs with average errors of less than five percent. The implemented inverter model considers control and protection characteristics that allow calculating the short-circuit current and understanding the dynamic behavior of IBG to different types of internal and external faults, according to the design and control strategy implemented in the inverter. This paper’s structure is presented below; chapter 2 presents the methodology for the developed model using a voltage-controlled current source, describing the considered functionalities, and evaluating its behavior for unbalanced short-circuit events; chapter 3 presents the discussion of the proposed model. Finally, chapter 4 presents the conclusions.
2. METHODOLOGICAL ASPECTS
The proposed model for EMT simulation for fault studies is based on a controlled current source representation [22] since this representation allows low computational load. This model avoids the detailed switching behavior of power electronic components; however, the model is accurate enough for reproducing the dynamics of the short circuit currents at the fundamental frequency.
2.1 Grid side inverter control
The developed model has five blocks describing the grid side inverter’s main components in IBG power plants and one additional block to improve the simulation initialization.
Three-phase grid synchronization under unbalanced voltage conditions
Flexible control strategy for current injection.
Peak current limitation of current injection.
Dynamic reactive power control.
Fault Ride Through (FRT) characteristic.
Controlled current initialization.
Figure 2 presents the structure of the Grid Side Control implemented for the controlled current source model.

2.1.1 Unbalanced grid synchronization
Since most short-circuit events in three-phase grids are unbalanced, and this imbalance is noticeable enough to be neglected, correct grid synchronization for unbalanced voltage dips is required. In this case, a Double Second Order Generalized Integrator - Frequency Locked Loop (DSOGI - FLL) is implemented as presented in [23]. The implemented DSOGI - FLL uses the Lyon transformation to decompose in time domain a three-phase signal in symmetric components and the Point Common Coupling (PCC) voltage in the αβ reference frame as shown in (1) and (2).


Where, [T αβ ] is the αβ transformation matrix, [T + ] and [T - ] are the well-known Fortescue transformation matrix for symmetrical components. Simplifying (1) and (2), (3) and (4) are obtained, where q operator represents 90-degree lagging-phase shift in the time domain.


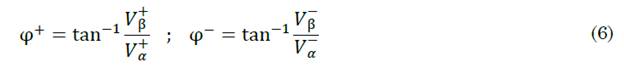
Finally, the Positive - Negative Sequence Calculator (PNSC) block calculates the positive and negative sequence voltage in αβ reference frame, as shown in (5). Additionally, the positive-negative sequence voltage angle (φ + , φ-) can be calculated using (6). Figure 3 shows the structure of DSOGI - FLL.


2.1.2 Injection current control
The IBG power plants use a control block in charge of generating the current references to meet an active and reactive power setpoint given a PCC voltage condition. Moreover, for three-phase inverters, the zero sequence components are ignored, then the instantaneous active and reactive power in the PCC could be calculated using (7) and (8).


Where the indices “+” and “−” represent the positive-negative sequence. The active-reactive power equations are grouped into two terms respectively, P ̅ and Q ̅ are the active and reactive powers resulting from the interaction between the voltages and currents of the same sequence. On the other hand, P ̃ and Q ̃ are the active and reactive powers resulting from the interaction of the voltages and currents of different sequences. Additionally, the “⊥” operator denotes a 90-degree lead-phase shifting vector rotation.
Due to IBG’s current injection depends on the control scheme, current references can be defined in many ways according to specific objectives, which impact the magnitude and phase of the short-circuit current injected per phase [23]. In [24] are presented a flexible positive-negative sequence current control strategy which allows modulating positive-negative sequence components participation in the short-circuit current through two scalar values k p and k q , this is presented in (9) and (10).


Adjusting k p and k q , could have infinite control modes where several authors focus in three particular control strategies [7], [24]:
- Constant active power control: There is cancellation of the active power oscillations, and there is negative sequence current participation. (k p = 1 y k q = −1).
- Balanced current control: The injected current only has a positive sequence component and oscillations in the active and reactive power. (k p = 0 y k q = 0).
- Constant reactive power control: There is negative sequence current participation and the cancellation of the reactive power oscillations (k p = 1 y k q = −1).
Authors in [25], [26] also propose similar strategies using k p and k q parameters to control the amplitude of injected active-reactive power, pointing out that these constants have a considerable impact on the PCC voltage response to different voltage dips and network characteristics.
2.1.3 Injection current limitation
As presented in the previous section, current references are built using active-reactive power references and the PCC voltage condition. This means that under severe faults (large low voltage drops, if the power references are not modified, the current reference could be greater than the maximum current bearable by Insulated Gate Bipolar Transistor (IGBT). For this model, it is implemented a current limitation strategy based on the ellipsoid theory described in [23], [24] with (11) - (14).


The active power limit is found by setting a reactive power reference and vice versa. Therefore, in (15) - (18) determine the maximum active power allowed considering the reactive power reference without exceeding the maximum IGBT’s peak current supportability.


Equations (19) - (22) determine the maximum reactive power allowed considering the active power reference without exceeding the maximum IGBT’s peak current supportability.


Where m, n, r, s, x and y are scalar values given by (23) - (25):


Equation (26) define parameter γ that allows computing the maximum active and reactive power for phases B and C.

Therefore, the active-reactive power limit (P lim , Q lim ) is constrained by the lower active-reactive maximum power between all phases as shown in (27) and (28).


2.1.4 Dynamic reactive power control
Reactive power support control in IBG power plants is necessary to achieve better short-term voltage stability [22] and protection coordination performance studies [27]. For this reason, many TSO grid codes establish that under voltage sags, the reactive power has priority and must meet dynamic reactive current support requirements [7]. In [13] is implemented reactive power support proportional to the voltage deviation, including a dead band. For the model presented in this paper, a similar strategy is implemented.
Figure 4 shows the general structure of the dynamic power control. This strategy calculates an additional reactive power quantity to be added to the pre-fault reactive power.
This new reactive power setpoint is an input for the active power curtailment block and the current reference generator.

2.1.5 Fault Ride Through (FRT)
Most TSO grid codes require that IBG power plants keep their operation during voltage disturbances to increase the security of the operation over short-circuit events [7], [11], [22]. For simulating FRT voltage capability of IBG, two programmable vector curves were implemented by phase; the first one details the Undervoltage requirements - Low Voltage Ride Through (LVRT), and the second details the Overvoltage requirements - High Voltage Ride Through (HVRT). This feature allows analyzing protection relays vs FRT tripping times for external faults. Figure 5 shows an example of the FRT characteristics configured for the implemented model.
2.1.6 Controlled current source initialization
For EMT short circuit studies is very important to have fast initialization to improve computational load. Traditionally, the power-flow initial condition is adjusted to set appropriate values; however, it could be cumbersome for large studies where load and generation condition is varied. This work proposes soft transient grid synchronization initialization based in two stages of the current injection setting:
Second-Order Band Pass filter with cut frequency ω n = 377 rad and quality factor Q = 0.5 in the first 50 ms of simulation. This stage reduces the current components with different frequencies from the nominal.
Ramp start from 0 p.u to 1 p.u. in the first 50 ms of simulation. This stage generates linear growth in order to avoid PCC voltage distortion. Figure 5 shows IBG current during the initialization stage, going from zero to its nominal value in 50 ms. Also, at this point, the reader may notice how the controlled current source model approach takes approximately 50 ms to initialize, which improves the initialization efficiently.

Figure 6 shows IBG current during the initialization stage, going from zero to its nominal value in 50 ms. Also, at this point, the reader may notice how the controlled current source model approach takes approximately 50 ms to initialize, which improves the initialization efficiently.

2.2 IBG model validation
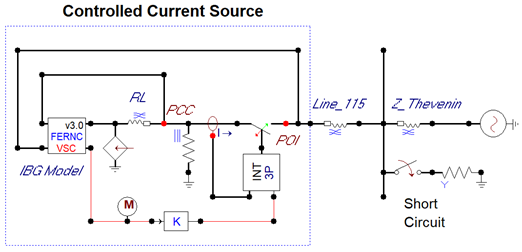
This section analyzes the IBG model for single-phase faults and evaluates its performance on time step simulation. Figure 7 shows the study case of the grid implemented for testing the performance of the IBG controlled current source model. The circuit includes a Thevenin’s Voltage Source (Grid), a positive-zero sequence impedance to connect the IBG Power Plant to the grid, a resistive branch to the ground for short circuit events, and finally, the IBG model without a transformer. Additionally, Table 1 shows the parameters used for the grid configuration. In all cases, a single-phase fault of 0.1 Ω is simulated at 50 ms and cleared at 150 ms except for the case of FRT.
2.2.1 Grid synchronization
The frequency estimation by the DSOGI - FLL is verified and the decomposition of the PCC voltage in positive and negative sequence with their respective angles. Figure 8 shows the PCC voltage and its positive-negative sequence decomposition, the estimated frequency, and the positive-negative sequence voltage angles. A DSOGI - FLL relevant aspect is the smooth response to sudden voltage changes produced by switch events like the fault inception or the fault clearance.

2.2.2 Current control strategies
The control strategies and current limitation play the major dynamic variation on short circuit conditions. Figure 9 is presented the results for three current control strategies, with a slope Q k = 1 and a current limitation of I max = 1.2 I nom . For constant active power control, the current of the fault phase increases its value and is limited by the current limitation module. On balanced current control, the current is enhanced balanced in the three phases and once is limited by the current module. Furthermore, in the constant reactive control, the current of the fault phase is reduced its value, and the other two are enhanced. These dynamics generate different challenges for detection using traditional protection schemes.

Source: Created by the authors.
Figure 9 IBG power plant response under short-circuits event (a) - Constant active power control (b) - Balanced current control (c) - Constant reactive power control
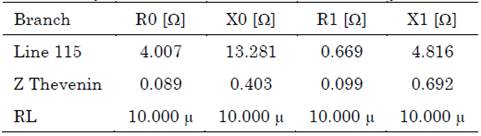
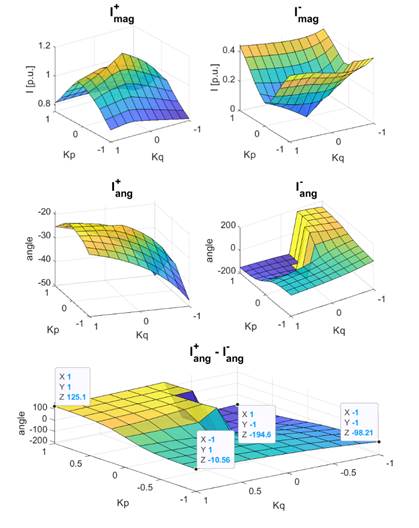
Since several protection schemes use negative sequence, Figure 10 shows the sensitivity of positive and negative current amplitude when the control variables k p and k q are swept between [−1, 1]. The peak current limitation is settled in I max = 1.2 I nom .
Source: Created by the authors.
Figure 10 Flexible Positive - Negative sequence current control for different k p - k q values
From k p - k q swept analysis, we can notice that the maximum negative sequence quantity appears in extreme parameter values, and the significant positive sequence quantity appears with the closest to zero parameter values. The reader can also notice how the positive-negative sequence current angle is more sensitive to the k q factor. Additionally, the phase angle difference (Iang +-Iang -) for constant active power control is the shortest −10.56º (Iang + approximately in phase with Iang -) and for constant reactive power control is the largest −194.5º (Iang + approximately opposite to Iang -). For this reason, phase A current magnitude is the largest in the first case and the shortest in the second case. This behavior is quite different from a synchronous machine with the same rated power. Figure 11 is shown the dynamic of the current and power when a single-phase fault occurs.

Source: Created by the authors.
Figure 11 Short-circuit current and instantaneous active-reactive power for a synchronous machine single phase to ground failure
It can be seen how there are oscillations in the active-reactive power delivered by the synchronous machine under fault conditions. However, the reactive power magnitude oscillations are more than twice the active power magnitude oscillations, finding that the reactive power oscillations are predominant for the synchronous machine under single phase to ground short-circuit. Additionally, the current of the failed phase is greater than the healthy phases presenting a similar behavior similar to the constant active power control current strategy without current limitation shown in Figure 8 (Of course, with an IBG lower peak current).
2.2.3 Dynamic reactive power support
For this section, an impedance fault sweep is performed to verify the active-reactive power injected related to the PCC voltage deviations considering the three control modes and the inverter current limitation.
The dynamic reactive power control is configured with a slope Q k = 1. Figure 12 shows the dynamic reactive power injection with the active-reactive power curtailment due to limiting peak current for single-phase to ground failures (Ag) and isolated two-phase failures (AB).
Considering that the amount of reactive power to compensate is equal for the three control strategies, it is clear how the Balanced Current Control strategy offers better performance regarding power injection. Furthermore, the behavior of the reactive power support does not depend on the type of short-circuit events attending to the slope Q k desired and the configured dead-band.

2.2.4 Fault ride through
The PCC voltage per phase is compared with the HVRT and LVRT curves to decide if the plant should be kept connected or may be disconnected from the network. Figure 13 shows the FRT behavior, presenting IBG disconnection close to 1.2 seconds, presenting that IBG plant remained under abnormal voltage conditions for more than 1.1 seconds.

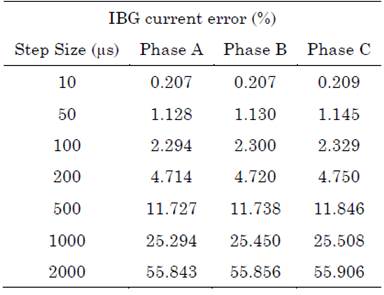
2.2.5 Time step performance
This section presents the average error of the IBG injected current for different simulation step sizes. The theoretical waveform will result from the simulation with a step size of 1μs. Table 2 shows the obtained results from this analysis. In contrast, [12] presents a generic type IV wind generator model that, under the controlled voltage source approximation, manages simulations with a step size of 50 µs with acceptable accuracy. It is not clear which accuracy is acceptable. However, this article's controlled current source model can manage simulations with step sizes up to 200 µs with an average error of less than five percent.
3. RESULTS AND DISCUSSION
As mentioned in this paper introduction, authors in [18] established that for IBG integration impact assessment in weak grids, EMT simulations are required, mainly due to the grid strength impact on synchronization algorithms (PLL). However, EMT simulations require detailed EMT models (usually not supplied by manufacturers due to know-how issues) and generate a higher computational cost. In contrast, normally for large grids, RMS simulations are common, but the results of this kind of simulation in weak grids are not accurate.
With this aim, an IBG model in EMT resolution with a low computational cost suitable for simulations with big-time steps is proposed in this work. In [22] authors present a description of the different types of interfaces for these EMT inverter models:
-Discrete switch model: Essentially, it requires modeling each of the discrete switches (IGBT, Diode, Thyristor, etc.). As an advantage, the results are the most accurate, but it requires small simulation steps (less than 10 µs) and requires inner PI control and a PWM module for switch activation-deactivation. As a consequence, it is the interface type that generates the bigger computational load.
-Average switch model: Collapse in each time step the discrete switches in a Thevenin equivalent using a forward-backward process. It is more efficient than the Discrete Switch Model. Requires inner PI control; it reproduces the Discrete Switch Model overall response including harmonics correctly but without the ripple.
-Simple source model: Takes output current reference signals and injects these signals into the grid as current injections. It is exceptionally efficient as it does not need IGBTs or inner PI control. Also, it does not generate harmonics due to IGBT operation. A disadvantage is that it can be quite unstable in a non-iterative solution and are not appropriate for detailed studies.
In this paper, a "Simple Source Model" approach is implemented as is the most economic interface in terms of computational cost. This model is accurate enough for short circuit and stability simulations with objective protection studies and control stability of the inverter in weak grids during faults processes (fault and fault clearing).
4. CONCLUSIONS
This paper presented a generic simplified EMT model for IBG power plants focused on short-circuit and short-term voltage stability to perform studies, including protection coordination. The presented voltage-controlled current source focus is practical and efficient that allows simulations with initialization times close to 50 ms and simulation step sizes of up to 200 us with errors of less than 5%. It integrates all the necessary functions to perform accurate simulations about transient and steady-state IBG behavior in EMT simulations. The presented model offers grid synchronization under all types of unbalanced voltage dips, making all kinds of perturbation feasible. Further, this model integrates flexible positive-negative sequence current injection, which makes possible the study of the impacts of suppressing negative sequence quantities. This model offers peak current limitation, which is IBG limitation in terms of reactive short-circuit current capacity and affects protection schemes.
The model's features allow us to understand and evaluate the behavior of IBG generation during faults and give recommendations to improve the performance of protection systems in grids with high IBG penetration. The presented model also has dynamical reactive power support under-voltage conditions. This feature is necessary to reproduce the IBG response under-voltage deviations. Finally, this model includes programmable FRT capabilities, which accurately indicate how IBG will ride through abnormal voltage conditions for analyzing voltage stability and protection coordination. This model obtains reliable results due to it considers technical and mandatory requirements of inverter-based generation.
The challenges of building an EMT model in the ATP program as a controlled current source include several aspects that mainly focus on simulation voltage distortion and stability due to current sudden changes impact PCC voltage. Initialization is complex because it requires a soft and progressive current injection to avoid numeric oscillations in the PCC voltage due to the current injection into the series RL branch. Also, during the initialization stage, the IBG control needs to filter the current to be injected because FLL is still synchronizing, and the PCC voltage measurement is still not accurate. Another difficult aspect was the stability of the IBG negative sequence control when the grid is operating in a balanced condition, or during voltage recovery after faults. A final challenge was the turning off of the IBG because the current cutting led to voltage numeric oscillation, making it not real. Required to approach a current zero-crossing extinction to avoid problems when several power plants were involved and some of them were disconnected due to FRT violated capability.

