


 Spanish (pdf)
 Article in xml format
 Article references
 Send this article by e-mail
 Cited by SciELO
  Cited by Google
  Similars in
SciELO
Similars in
SciELO  Similars in Google
 Permalink
INTRODUCTION
In recent years, the massive use of devices that affect the quality of the supply voltage waveform by introducing harmonic distortion in distribution networks has increased. Some single-phase loads that cause such distortion are fluorescent and LED lights, battery chargers, variable speed drives, PV inverters, computers, and TVs, among other devices that use wave rectifiers (Bosovic et al., 2016; Busatto et al., 2019; Dghim et al., 2018; Roy et al., 2020; Soni & Soni, 2014).
Moreover, there are devices which are regarded as harmonic sources for their non-linear voltage-current characteristics, such as saturated transformers, arc furnaces, and over-excited induction motors (Chang et al., 2004). The intensive use of these non-linear devices in the network produces negative effects on it and in devices connected to it, such as the heating of conductors and components, equipment malfunction, and interference in communication equipment, among others (Blanco et al., 2015; Brunoro et al., 2017; Marulanda et al., 2017; Moreno-Cañón et al., 2014; Roy et al., 2020; Soni & Soni, 2014).
Therefore, researchers have focused their efforts on understanding and modeling the behavior of non-linear loads, particularly single-phase induction motors (SPIM) since they are most used in industrial and household applications, as is the case of compressors, air conditioners, heating-circulating pumps, fans, centrifugal, sewing and washing machines, etc. (Chasiotis & Karnavas, 2020; Sharma & Singh, 2021).
Arif et al. (2018) presented a state of the art of load modeling, which relates that an induction motor can be studied with a dynamic load model (IM), a complex load model (CLOD), or a circuit model based on wave rectifiers. Pérez-Londoño et al. (2015) compiled methodologies to obtain composite load models and proposed one based on measurements which allows reproducing the dynamic nature of a load against a disturbance.
However, the inherent nonlinearities in the electromagnetic construction of these motors make their modeling and design difficult. Models in the frequency domain are used to represent the behavior of the non-linear voltage-current characteristics of the load. The most commonly used models are the current source model and the harmonic impedance model (Chang et al., 2004). These help estimate the impact of voltage and current signals on the waveform and have proven be effective in modeling non-linear loads, regardless of the characteristics of the distribution network (Caicedo et al., 2017b; Fölting et al., 2014; Ge & Liu, 2020; Guo et al., 2019; Meyer et al., 2016; Xiao et al., 2017b).
Although there are single-phase induction motors with a current waveform showing significant percentages of the third harmonic component due to the saturation of their magnetic elements (Soni & Soni, 2014), the application of frequency-domain models to study their nonlinear characteristics is rather scarce. Hasan and Parida (2018) presented the modeling and analysis of a single-phase induction motor to study the effects of this kind of loads on a microgrid by using a two-axis model. Cale et al. (2020) described an experiment to optimally obtain the parameters of a single-phase induction motor with a starter capacitor. Yao and Xiao (2020) used the two-axis modeling of a single-phase motor to propose a speed control method with the purpose of improving its performance and efficiency.
For this reason, the objective of this work was to use the Norton equivalent model in order to model the behavior of a single-phase induction motor used as an air extractor with non-linear voltage-current characteristics. To this effect, two approaches were applied, i.e., the Norton model with both coupled and decoupled admittance matrix (Caicedo et al., 2017a; Fölting et al., 2014; Senra et al., 2017; Tavukcu et al., 2019).
Likewise, the model parameters found were evaluated via the Training approach, and the models were validated from the estimation errors in the active and non-active power parameters, as well as by calculating the NRMSE error and THDi index, considering four specific stress signals.
METHODOLOGY
This section presents the Norton equivalent model approaches used, the methodology for acquiring data from an experimental setup in a laboratory, the characteristics of the selected load, the test scenarios used to validate the load model, and the mathematical approach used to estimate the power parameters and current harmonic distortion indices (THDi).
Norton equivalent model
Nassif et al. (2010) proposed the solution of the Norton equivalent model from two approaches that consider the dependence between the harmonic distortions in voltage and current. The general expression of the model is
 , where
 is the current vector,
 is the reference current vector,
 are the variations of the voltage signal, and
 is the admittance matrix, whose dimensions are H for the highest odd harmonic components of the current signals and K for the highest odd harmonic components of the voltage signals.
Equation (1) describes the coupled admittance matrix model approach and Equation (2) the decoupled admittance matrix one.

To obtain the parameters of the model, the matrix approach of the general equation

 must be carried out as follows:
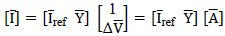 . Now, clearing the concatenated matrix
 from the general equation yields Equation (3), which can be applied to obtain the parameters with m measurements performed in the laboratory.

Characteristics of the selected load
The studied motor is a permanent split capacitor single-phase induction motor (PSCM), in which the main and auxiliary windings are connected to the power supply. Moreover, a capacitor in series is connected to the auxiliary winding for starting and running the motor. Figure 1 shows the basic circuit diagram of a PSC single-phase induction motor.
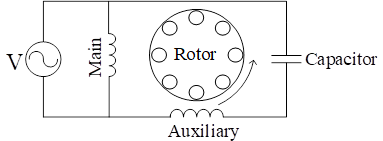
Moreover, the studied motor is a TD-SILENT 500/150-160 silent centrifugal air extractor, (127 V, 66 W, and 2.466 RPM). This extractor is used as a forced ventilation instrument in the intelligent air conditioning system installed in the interior spaces of a building located in the central campus of Universidad Industrial de Santander (Bucaramanga, Colombia).
Experimental assembly
Figure 2 shows the experimental setup for the study of the selected load. A Chroma programmable source, a PQube3 network analyzer, and a computer were used. The 1.500 VA Chroma 61701 source (3P-N-G) allows distorted signals to be generated. The PQube3 Class 0,2 s network analyzer is a monitoring instrument with features to identify power quality problems, which was configured to acquire 128 samples per cycle at a fundamental frequency of 60 Hz for the measured voltage and current signals.

Test scenarios
Experimentation was carried out in two stages: a frequency sweep with 144 measurements in order to obtain the Norton models and the application of four special signals used for validation.
Frequency sweep: First, the load was supplied with voltage signals at the fundamental frequency (60 Hz) with magnitude values between 115 and 150 V (ΔV = 1 V), as well as with phase angle equal to 0 °. A total of 36 measurements were made. Second, the load was supplied with voltage signals made up only of a third, fifth, or seventh harmonic component, with magnitude values of 1, 3, 5, 10, 15, or 20 V, with variations in phase angles between 0 and 300° with a 60° step, considering an RMS value for the voltage of 127 V at 60 Hz, for a total of 108 measurements.
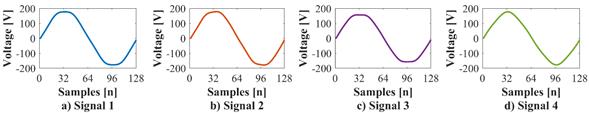
Special voltage signals: In order to validate the models obtained, four representative signals were selected: two voltage signals, typical of the university building where the load is installed (Signals 1 and 2), and two typical voltage signals for low-voltage networks: a flat-top waveform signal present in residential networks (Signal 3) and a pointed-top waveform signal present in industrial networks (Signal 4) (Blanco et al., 2013).
Power parameters and total harmonic distortion indices (THD) estimation
The RMS values of the voltage and current signals were determined via Equations (4) and (5), where v n and i n represent the sample vectors of the voltage and current signals and N is the length of each sample vector. The values of the single-phase active power are calculated as P=ΣN i=1(𝑣𝑛[𝑖] ∗𝑖𝑛[𝑖])/N, and the values of the single-phase apparent power are calculated as S=V RMS *I RMS .

Likewise, the non-active power can be calculated from two approaches: the Fryze model as QF=(S2-P2)1/2 and the Budeanu model as QB= ΣN i=1 (𝑣𝑛[𝑖] ∗𝑖𝐵𝑛[𝑖])/N, where i Bn is the sample vector of the Budeanu current signal. Furthermore, the total harmonic distortion indices of voltage ( THD v ) and current ( THD i ) are calculated via Equations (6) and (7), where h is the harmonic component order number, I 0 and V 0 are the DC components value of the voltage and current signals, I 1 and V 1 are the fundamental frequency components RMS value of the voltage and current signals, and I h and V h are the harmonic components RMS value of the current and voltage signals.

Training and validation of the model
The application of the Training approach allowed adapting or adjusting the estimated model parameters. This technique evaluates the level of unreliability or errors that a model could have from the measured data in order to verify its level of confidence. To this effect, current signals are estimated by applying the general equation of the Norton model. The input variables are the admittance matrix and the voltage signals of the frequency sweep used to estimate the Norton model parameters. The difference between the calculated and measured current signals is analyzed with the percentage error for the magnitude values and the absolute error for the phase angle. Boxplot diagrams were the tool used to show the results of the technique.
The validation of the models considered the four special voltage signals. For this quality verification process, results were obtained from calculating the percentage error for the measured and estimated active and non-active power values. Additionally, the NRMSE error index and the THDi values were calculated for the measurements, as well as estimated by the models.
RESULTS
This section presents an analysis of the power parameters for the special signals selected, the results of estimating the admittance matrix of each method of the Norton equivalent model, and the validation process of each model.
Figure 3 presents the voltage signal at the fundamental frequency and the current signal demanded by the air extractor. Figure 3a shows a voltage signal with a magnitude of 127 V and a 0° phase angle (blue line), as well as a current signal (orange line) that is slightly distorted and ahead the voltage signal by approximately 20°. Figure 3b describes the distortion of the current signal from the harmonic spectrum. Specifically, there is a presence of the third and fifth harmonic components of 7,0 and 0,8%, respectively. These harmonic components of the current signal when the load is connected to a sinusoidal power supply signal could be the result of the saturation of the motor’s magnetic core. Furthermore, it should be noted that the active power value at nominal voltage is less than the nominal power value, and that a capacitive behavior is observed when obtaining a non-active power value of -22 VAR.

Analysis of power parameters
Tables 1 and 2 present information on the special signals used in the selected load, the power parameters, and the total harmonic distortion indices. They also show characteristic values of the selected load operation before the special voltage signals. The voltage values (V1, V3, V5, V7) and the alpha values (α1, α3, α5, α7) in Table 1 specify the magnitude values and the phase angle of each harmonic component. The results of the non-active power values presented in Table 2 indicate a capacitive behavior of the air extractor, which is due to the capacitor in series of the auxiliary winding that allows the motor to start and run. The values calculated for the reactive power at the fundamental frequency component (Q1) and the values of the harmonic component of the non-active power calculated with the Budeanu approach (DB) confirm that the negative values of the non-active power are the result of the compensation of the capacitor while starting and running the motor.
Table 1 Characteristics values of the voltage special signals
| Signal | VRMS | V1 | α1 | V3 | α3 | V5 | α5 | V7 | α7 | IRMS |
| [V] | [V] | [°] | [V] | [°] | [V] | [°] | [V] | [°] | [A] | |
| 1 | 129,3 | 129,1 | 0 | 0,17 | 23,8 | 2,45 | 176,4 | 0,42 | 34,0 | 0,51 |
| 2 | 128,7 | 128,5 | 0 | 0,33 | 84,9 | 1,82 | 186,4 | 0,95 | 64,0 | 0,51 |
| 3 | 116,7 | 116,6 | 0 | 2,37 | 0,0 | 1,66 | 180,0 | 0,89 | 0,0 | 0,49 |
| 4 | 120,2 | 120,0 | 0 | 3,05 | 180 | 1,66 | 0,00 | 0,05 | 0,0 | 0,50 |
Source: Authors
Table 2 Power parameters and total harmonic distortion indices of the voltage special signals
| Signal | P | QF | QB | Q1 | DB | S | fp | THDv | THDi |
| [W] | [VAR] | [VAR] | [VAR] | [VAR] | [VA] | [%] | [%] | ||
| 1 | 61,4 | 23,9 | -22,7 | -22,9 | 7,33 | 65,9 | 0,93 | 2,5 | 11,5 |
| 2 | 60,7 | 23,5 | -22,6 | -22,7 | 6,22 | 65,1 | 0,93 | 2,1 | 9,4 |
| 3 | 54,3 | 19,4 | -18,8 | -18,8 | 4,72 | 57,6 | 0,94 | 3,0 | 10,4 |
| 4 | 56,2 | 20,8 | -20,1 | -20,2 | 5,38 | 59,9 | 0,94 | 3,5 | 10,7 |
Source: Authors
Figure 4 presents the waveforms of the four special voltage signals selected for the validation of the models. Signals 1 and 2 show some similarities because they are voltage signals from the same network, albeit measured at different times of the day. The third signal is a flat-top waveform, where the third and fifth harmonic components are higher than the seventh harmonic component. Finally, the fourth signal is a pointed-top waveform, where the third harmonic component is higher than the others.
Norton equivalent model parameters
Figure 5 presents the coupled admittance matrix and decoupled admittance matrix of the Norton model for the air extractor.
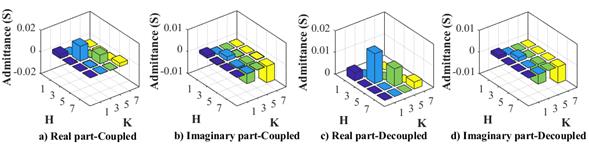
The admittance values obtained to form the Y matrix represent the interaction between the odd harmonics of current H and the odd harmonics of voltage K from the measurements carried out in the frequency sweep, considering that these experiments were performed using a single harmonic component at a time. It should be noted that the predominance of the relationship of the third-order harmonic component of voltage and current in the models describes the characteristic nature of the air extractor.
Figure 6 presents the boxplot diagrams that analyze the behavior of the coupled and decoupled admittance matrix model parameters against the data measured for their estimation. Deviations in the percentage errors can be observed for the magnitude of the fundamental frequency component and the harmonic components, as well as deviations in the absolute errors in the phase angles.

The position of the blue boxes in the diagrams indicate that the distribution error is skewed positively, which happens when the red line (the mean value of all the data) is close to the bottom whisker in the diagram, which represents the minimum value.
Likewise, it can be pointed out that 75% of the magnitude errors of the fundamental frequency component of the coupled admittance matrix Norton model are below 12% and 75% of the errors of the harmonic components are below 5%, while the errors of the decoupled admittance matrix Norton model are less than 6%. On the other hand, 75% of the absolute errors of the phase angles of the two models were between 0 and 4°.
Model validation
The coupled and decoupled admittance matrix models were validated by measuring the estimation quality with the four special voltage signals. Figure 7 presents a comparison of the magnitude values and phase angles of the fundamental frequency and the harmonic components of the measured signals, as well as the signals estimated by each model.
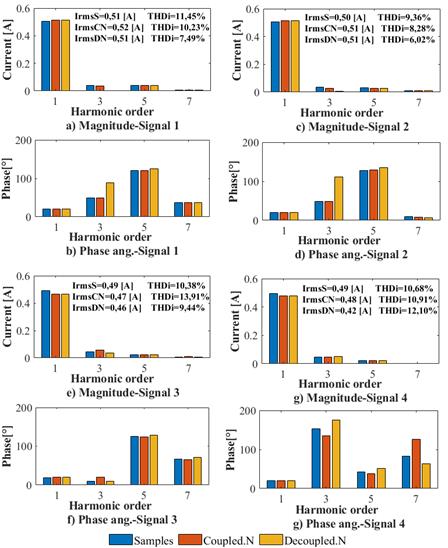
The results indicate that the errors of the magnitude values of the coupled admittance matrix Norton model are less than 3%, in contrast to those of the decoupled admittance matrix Norton model, which were less than 4%. In general, it could be said that the studied models successfully estimate the behavior of the air extractor current.
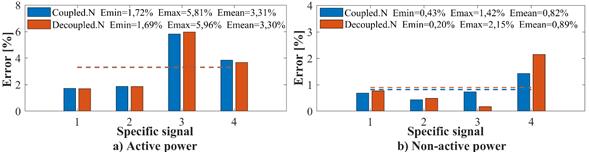
Power errors, NRMSE, and THDi indices analysis
Figure 8 presents the parameter estimation errors for the four specific signals. In Figures 8a and 8b, it is noted that the errors in the active power estimated by the coupled and decoupled admittance matrix Norton models are less than 6%. On the other hand, the errors regarding non-active power obtained by the coupled admittance model are less than 2%, unlike those of the decoupled admittance matrix model (less than 3%).
Likewise, Figure 9 presents the NRMSE index for the current signal, which, for the coupled admittance matrix model, ranged between 0,7 and 2,3%, whereas the decoupled matrix model errors were among 2 and 2,8%.
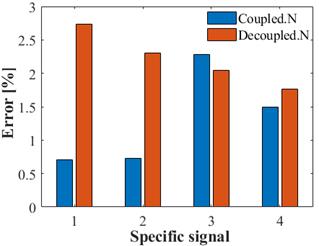
Figure 10 shows the THDi indices. In general, for the coupled admittance matrix model, better estimates of the index were obtained, as compared to the decoupled admittance matrix model. It was possible to observe an index close to 14% as estimated by the model.

In general, the results obtained indicate that the models can estimate the current measured in the laboratory with a certain degree of accuracy, just as the power errors estimated by the two models do not show any considerable differences.
CONCLUSIONS
This paper presents the parameter estimation of the Norton equivalent model under the coupled and decoupled admittance matrix approaches for a single-phase air extractor whose nature is non-linear due to the constant presence of harmonic components in the demanded current signal.
The results obtained indicate that the two approaches can estimate the current demanded by the air extractor with a certain degree of accuracy, with the estimation of the coupled matrix approach being more successful (NRMSE < 2%). Likewise, the results showed the estimation quality of the approaches, obtaining errors of the order of 6% regarding the active power and 3% for the non-active power, as well as values of less than 14% for the THDi index.
The increased use of devices based on power electronics has made it possible to explore the modeling of nonlinear loads in the frequency domain, as it does not require the circuit information of the load and exhibits ease of estimation when compared to time-domain modeling.
Frequency-domain modeling for motors is relatively unexplored in the literature. However, single-phase induction motors are essential loads present in any electrical system, so the results obtained in this work may allow the use of single-phase induction motor frequency-domain models in the power flow analysis of transmission or distribution networks.

