


 English (pdf)
 Article in xml format
 Article references
 Send this article by e-mail
 Cited by SciELO
  Cited by Google
  Similars in
SciELO
Similars in
SciELO  Similars in Google
 Permalink
1. INTRODUCTION
In recent decades, in the asphalt technology sector, the development of hot asphalt mixtures for the construction of treads in pavement structures has prevailed (Pérez-Acosta & Lemus-Franco, 2018). It is known that the production of asphalt mixtures is associated with environmental pollution problems, which generates significant economic impacts. In addition to this, high oil production costs imply inconsistent markets in prices per barrel (Ledesma, 2015), indicating the need to seek new technological proposals in the paving sector.
The need to review the impacts of hot asphalt mixtures has been a categorical trend in recent years (Al-Busaltan et al., 2012; de la Rosa et al., 2018; Rondón-Quintana et al., 2010; Ruiz et al., 2014). In that sense, space has been gained in the implementation of cold asphalt mixtures, under the premise of reducing energy consumption and alleviating the environmental impact generated by greenhouse gases emitted by hot asphalt production plants (Chelego et al., 2018).
On the other hand, cold asphalt mixtures are produced from fine and coarse aggregates by adding an asphalt emulsion, without the need to heat the components, as is the case of hot asphalt mixtures (Bulla-García et al., 2017). In this regard, several peculiarities have been analyzed and studied in recent years, given benefits such as the easy extension and compaction of the material, improved adhesion between particles, and mixture stability (Reyes et al., 2018).
The prevailing need to create and design new models that meet the demands of sustainability in the asphalt mix technology sector has led to reductions in design quality standards and manufacturing temperatures (and compaction), as well as to substantial improvements in workers’ health, among others.
Table 1 shows several international experiences addressing the use of multi-criteria models when evaluating asphalt mixtures. It is necessary for each of these studies to be analyzed with the particularities and specific parameters of each case.
Table 1 Multi-criteria models in the flexible pavement technology sector
| Author | Multi-criteria models used | Purpose of the study |
|---|---|---|
| Bueche & Dumont (2016) | EPFL‐LAVOC Model | To assess warm mix asphalt (WMA) and hot mix asphalt (HMA) |
| Santos et al. (2017) | Life cycle cost/Life cycle assessment | To measure the efficiency of environmental and economic aspects |
| "Choosing by Advantages" (CBA tool) | ||
| Arroyo et al. (2018) | Multi-criteria decision-making method | To use the End Life of Tires (ELT) in asphalt mixtures in developing countries |
| Slebi-Acevedo et al. (2019) | The Weighted Aggregate Sum Product Assessment (WASPAS) methodology | To select fibers for bituminous mixtures |
| Technique for Order of Preference by Similarity to Ideal Solution (TOPSIS) | ||
| Fuzzy Analytic Hierarchy Process (FAHP) | ||
| Pasha et al. (2020) | Fuzzy Analytic Network Process (FANP) | To select the ideal pavement alternative (ranking) |
Source: Authors
Although there are numerous applications and multicriteria models with certain objectives, there is a significant lack of models that allow characterizing and evaluating constructive solutions in an integrated way. In other words, the model proposed in this study provides a new perspective of evaluation and comparison between two materials that can be homologated in terms of their economic, operational, and environmental aspects.
2. SYSTEM LIMITS
For the development of this study, two constructive pavement solutions were used. On the one hand, an alternative based on a binder mixture and hot aggregate (DHD, dense hot mix- manufactured and compacted) and a cold dense mixture (DC, dense-cold) was selected. It is important to mention that the experimental characterization of each of the selected alternatives has been developed by Bulla-García et al. (2017) and has served as a basis for comparing the responses with the proposed multi-criteria model.
The study conducted by Bulla-García et al. (2017) sought to analyze different technical, economic, and environmental aspects. The analysis presented in this study considers the use of the ‘modified Marshall’ methodologies for the DHD and the ‘Marshall Illinois’ ones for the DC. Asphalt mixtures have been characterized with AC 60-70 and CRL-1 emulsions for DHD and DC, respectively, using the same aggregate for both solutions.
The adoption of the variables treated in the study by Bulla-García et al. (2017) allowed calibrating the decision-making methodology proposed in this work. The transition from an experimental phase to the methodological phase is a complement between different areas of analysis and evaluation, i.e., a starting point in juxtaposition and comparison when evaluating flexible pavement components.
It is important to highlight that only those two types of asphalt mixes have been defined in this study. However, the method can be applied to various types of comparable materials. The parameters and indicators used in this study were defined by the characteristics of the materials themselves. Thus, the parameters should be adjusted when evaluating other constructive solutions with regard to their technological responses.
3. MIVES MULTI-CRITERIA ANALYSIS FOR THE CASE OF THE ASPHALT SUSTAINABILITY INDEX
Multi-criteria decision-making (MCDM) occurs when the decision-maker must select between a group of alternatives or solutions, considering the diversity of criteria and assessments (Zavadskas et al., 2014). The MIVES method is a multi-criteria analysis methodology that assesses alternatives with the clear objective of solving a specific problem.
This methodology was designed based on the utility theory, obtaining a ‘value index’ (of each alternative), a product of the weighted total of the assessments of the criteria and the indicators considered (Aguado et al., 2006). It is important to highlight that the MIVES methodology allows configuring and characterizing all the preferences of the decision-maker in a phase prior to the creation of possible alternatives.
This implies that the decision-maker defines the aspects to be assessed from the start and their form of evaluation. The advantage of this approach means that decision-making is not affected by the responses of the alternatives, thus reducing the possibility of any type of subjectivity.
Figure 1 depicts the seven stages of the MIVES multi-criteria methodology. In the case of the first stage, called "Delimitation of the decision" the system limits and boundary conditions are defined. Decision-making is organized, observing the agents that intervene before the problem can be solved.

On the other hand, the limits of the system condition the decision-making process in three main axes: requirements, components (to be analyzed), and life cycle (of the problem). In these stages, the circumstances surrounding the decision-making process are observed (i.e., temporal, geographical and environmental factors, as well as workers’ health, among others) (Aguado et al., 2006).
In light of the above, Table 2 reflects the different applications of the MIVES model in the construction sector. It shows the methodological advances, application areas, and main attributes represented in each case.
Table 2 MIVES applications in the construction sector
| Methodology | Application attributes | Application area/Methodological advances |
|---|---|---|
| Aguado et al. (2012) | Procedures to assess sustainability in structural concrete structures Spanish Code | Structural concrete legislation/Annex 14 structural concrete |
| del Caño et al. (2012) | Concrete works during all life cycle | Structures of concrete/Life cycle |
| Technology in educational structures | ||
| D’Aula (2012) | Acoustic Quality: Index of Architecture | Architecture/Evaluation models in the field of acoustics. |
| Pons and de la Fuente (2016) | Reinforced concrete elements, mechanical conditions, geometry and their processes | Structures/Functional - structure. |
| Reyes et al. (2014) | Construction projects integrating health and safety issues | Occupational Health & Safety/Social impact |
| de la Fuente et al. (2016) | Sewer pipes | Sewer systems/Sanitation and new materials |
| Hosseini et al. (2016) | Provisional housing, reduce environmental and economic impacts | Civil Construction/Social welfare |
| de la Fuente et al. (2016b) | Wind turbines | Renewable energy |
| Advantages and limitations for sustainable measures | ||
| Gilani and Fuente (2016) | Facades in housing | Civil Construction/Architecture criteria |
| Pujadas et al. (2018) | Urban pavements capacity and damage | Public politics |
| Villegas and Parapinski dos Santos (2013) | Analysis of new materials under the sustainable context | Civil construction |
Source: Authors
The requirements tree is elaborated with the clear objective of ordering and grouping the variables selected in the first phase. The third stage defines the value functions for the entire system. The objective of the value functions is to integrate and transfer variables with different units of measurement (for example, US $, emissions, tons, %, etc.). In the allocation of weights (fourth stage), the degree of importance between the different variables conceived in the first phase is assigned and determined. That is, each variable or attribute has a relative importance with respect to the need for decision-making. For this, the priority assignment tool defined by Saaty (2004) has been used, which deals with the comparison of variables by means of a square matrix and degrees of consistency.
After defining the structure of the problem and the established weights, the alternatives that support the decision are specified. It is important to highlight that there is no limitation to evaluate alternatives if they are comparable and homologous between them.
The evaluation of alternatives (sixth phase) is conducted via the mathematical instrument provided by the MIVES methodology, which will be detailed in subsequent sections. Finally, a sensitivity analysis is staged to observe the incidence of each of the variables analyzed with respect to the measuring instrument and the responses of each selected alternative.
Figure 2 shows the diagram and methodological organization of the MIVES methodology. It is important to highlight that the alternatives are outside the creation and structure of the decision-making process, reducing the possibility of subjective approaches and biases during the evaluation process. MIVES represents a significant advance in the evaluation of variables with different units of measurement, following an approach that observes the life cycle of each decision.

The MIVES method has been conceived and used (initially) to evaluate construction projects on a sustainable basis. Such initiatives are aimed at measuring alternatives ranging from the analysis and evaluation of investments in the public construction sector (Pujadas et al., 2017) to environmental valuations associated with the sector that allow measuring the responses of indicators throughout the entire cycle of the project (Viñolas et al., 2009).
There are different applications that have been used to measure the responses of the indicators in the industrial sector (Pons et al., 2016; San-José et al., 2007; San-José & Cuadrado-Rojo, 2010) by means of MIVES. This methodology has been used to analyze the networks of infrastructure works such as tunnels (Ormazabal et al., 2008), to compare structural hydraulic networks (Pardo-Bosch & Aguado, 2014, 2016), and in civil construction projects (Pons & Aguado, 2012; Casanovas, 2014), allowing to compare alternatives with sustainable rigor.
It is important to note that the structural concrete code has been evaluated through this multi-criteria methodology, with satisfactory results (CPH, Spanish Structural Concrete Standard, 2008) (Mel et al., 2015). Finally, for the specific case of works on land roads (paving), Pujadas et al. (2017) and Aguado et al. (2012) integrate concepts of quality in paving, evaluating it with the MIVES multi-criteria methodology.
Other sectors have also been studied through the MIVES model. De la Fuente et al. (2016b) establish the necessary indicators aiding in the selection of wind turbines. The authors compare solutions to claims in urban areas. Villegas-Flores (2009) contextualizes the comparison of indicators that measure the performance of university departments, obtaining criteria for the distribution of financial resources based on teacher productivity.
The diversity and application of studies carried out under this multi-criteria model has gained strength in the last decade. Figure 3 depicts the tree of requirements defined for this specific case study. The structure of the tree has been arranged in three axes or requirements: environmental, economic, and operational. The decision-making process has been conceived in such a way that all criteria and indicators are measurable with some ease and scientific rigor.
Environmental requirements have been limited to the context of environmental pollution, namely regarding the reduction of performance temperatures, harmful emissions, and raw materials consumption. As for performance temperatures, two types of temperatures have been considered: those involved in the manufacturing of the asphalt mixture and those involved in compaction. These indicators have been selected by assuming that there is a need to reduce environmental impacts, given the high temperatures taking place in both processes.
In this case, particular care has been taken to address the various concepts of emission reduction expressed at the 21st Conference of the parties to the United Nations Framework Convention on climate change, held in Paris in December 2015. This accord will be adopted from 2021, aiming to keep the global temperature rise below 2°, thus promoting climate resilience and low-carbon development (UN-CEPAL, 2018a).
This study contemplates the reduction and consumption of thermal energy and carbon dioxide emissions (which are contemplated in the emission criteria) that favor meeting the current regional guidelines and tasks of the 2030 Agenda for sustainable development in Latin America and the Caribbean (UN-CEPAL, 2018b).
It is important to note that performance temperatures have been weighted with greater importance, i.e., with 65% importance for compaction and, 35% for manufacturing. It is understood that such weight is guided by the number of operators that participate (and are affected) in these processes.
The allocation of these weights has been specified by means of the AHP (analytical hierarchy process) methodology defined by the decision matrix proposed by Saaty (2017). Thus, the allocation of weights has been defined by the consensus of different specialists related to the road sector (contractors, construction executors, supervisors, etc.).
For the determination of the value function and the weight of each indicator, 35 interviews have been conducted for different specialists in land roads, builders, academics, asphalt pavement supervisors, and public agents of the asphalt technology sector.
As for the form of each value function, the nature of each indicator has been analyzed, seeking better performance in the three requirement axes: environmental, economic, and operation, i.e., the responses of asphalt mixtures with lower environmental impacts, reduced costs, and increased mechanical performance.
Table 3 Tree of requirements
| Requirements | Criteria | Indicator | Value function |
|---|---|---|---|
| Environment (40%) | Temperature performance (50%) | Manufacturing °C (35%) |
|
| Compaction °C (65%) |
|
||
| Emissions (35%) | Emissions to the atmosphere in units of thermal energy (ETE), Mj/ton (20%) |
|
|
| Emissions to the atmosphere in unitary fossil energy consumption (EFEC), Mj/ton (20%). |
|
||
| Emissions to the atmosphere in carbon dioxide (CO2), kg/ton (40%) |
|
||
| Emissions to the atmosphere, NOx kg/ton (10%) |
|
||
| Emissions to the atmosphere, SOx kg/ton (10%) |
|
||
| Consumption (15%) | Raw materials used for asphalt mixing (aggregates) %/Tn (100%) |
|
|
| Economic (12%) | Cost (100%) | Cost of manufacturing and transportation US$/m3(60%) |
|
| Cost of emissions to the atmosphere in units of thermal energy (ETE), US$/ton (10%) |
|
||
| Cost of atmospheric emissions in unitary fossil energy consumption (EFEC), US$/ton (10%) |
|
||
| Cost of atmospheric emissions in carbon dioxide (CO2), US$/ton (20%) |
|
||
| Operation (48%) | Characterization (40%) | Stability, N (40%) |
|
| Flow, mm (40%) |
|
||
| Retained resistance, % (20%) |
|
||
| Deformability (60%) | Warp speed range from 105 to 120 minutes, μm/min (15%) |
|
|
| Resilient modulus, Mpa (45%) |
|
||
| Fatigue deformation (traffic level equivalent to 750.000 axes, equivalent to 8,2 tons in the design lane), μm/min (20%) |
|
||
| Fatigue deformation (traffic level equivalent to 2.500.000 axes, equivalent to 8,2 tons in the design lane) μm/min (20%) |
|


Source: Authors
A relative value of 65% has been given (compaction) with respect to 35% of manufacturing of the mixture due to the execution deficiencies that often arise at the construction site, thus promoting correct and good execution practices.
An analysis of nitrogen oxides (NOx) emissions has been included, as they are regarded as polluting gases that destroy stratospheric ozone. NOx in different amounts of oxygen and nitrogen are mainly formed in combustion processes at high temperatures (for example, while manufacturing asphalts) (Castillo et al, 2017).
These substances are responsible for negative effects such as smog, pollution fogs, and acid rain, threatening human health and polluting the environment. Exposure to these gases causes eye irritation, long-term skin corrosion, and chronic respiratory diseases in workers.
We decided to study the effect of sulphury oxides (SOx) on the manufacture and operation of asphalt mixtures, which is produced by the combustion of coal and oil. SOx are irritating and toxic gases that affect the mucus and lungs of the operators, causing coughing, which, with prolonged periods of contact, may in turn cause bronchitis, asthma reactions, respiratory arrest, and bronchial congestion.
On the other hand, in the economic axis, a unique criterion that defines the balance of costs between both alternatives has been considered. This criterion involves the evaluation and comparison between the costs related to the manufacturing, transportation, and placement processes of both asphalt dense mixtures (hot and cold). Equivalently, the economic comparison variables between the emissions and consumption considered in the environmental requirements have been integrated.
The operation axis has been divided into two main criteria: material characterization and deformation. The former is understood as the characterization of a hot asphalt mixture (DHC) and a cold dense one (DC), which allows analyzing and evaluating parameters of stability, flow, and retained resistance. The incorporation of these variables allows determining the value index with respect to the two alternatives’ performance level, which may support decision-making.
It should be noted that the evaluation of asphalt mixture stability and flow through methodological tools is limited. The MIVES methodology adopts a form of comprehensive and analytical comparison within its evaluation model. Although the increase (or reduction) in the stability of one mixture with respect to another has not been experimentally analyzed, the response has been considered satisfactory in a global context.
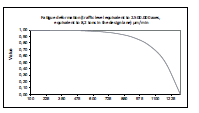
The requirements implied by the deformation criterion has been included, which aims to compare the theoretical basis with respect to the rigidity of the material. This study contemplates fatigue deformation at different equivalent traffic levels (for equivalent axes, i.e., 750.000 and 2.500.000).
In that sense, organizing and grouping the attributes (variables) developed by the MIVES multi-criteria methodology are a process governed by analyzing the responses of each of the components selected for decision-making (in this case criteria and indicators). Such analysis represents a significant advance in analyzing variables with different origins, measuring the response in an integrated and sustainable way.
The weights of the attributes (requirements, criteria, and indicators) have been specified through the analytical hierarchy methodology (Saaty, 2017). We decided to use this methodological tool because it considers mathematical, analytical, and psychological aspects empirically contrasted with a great deal of applications (Hernández-Santibáñez et al., 2017; Hernández-Suárez et al., 2015).
The psychological basis of the AHP is oriented towards the analysis of attributes through comparisons already under study since the last century. The concept addressed by this tool assumes that the human mind makes evaluations and comparisons between two different attributes. However, when a third party or more attributes intercede, confusion of assessment arises (Miller, 1965).
Table 4 shows the numerical scale of the AHP tool, along with the verbal comparison scale and, to some extent, the appreciation of such comparison. It is important to highlight that the weights are defined between the groups with the same criteria or origin.
Table 4 Comparison for weight allocation according to the AHP
| Numerical scale | Verbal scale | Explanation |
|---|---|---|
| 1 | Attributes with equal importance | The two attributes also contribute to the criterion |
| 3 | One attribute is moderately more important than another | Judgment and previous experience favor one attribute over the other |
| 5 | One attribute is strongly more important than another | Judgment and previous experience strongly favor one attribute over the other |
| 7 | The importance of one attribute is much stronger than that of another | An attribute dominates strongly. Its domination is proven in practice. |
| 9 | Extreme importance of one attribute over that of another | One attribute dominates the other with the greatest possible order of magnitude. |
Source: Authors
Table 5 indicates the application of the tool for the three requirements proposed for the case study. It is observed that the operation requirement represents 48% of the weight with respect to the other two pillars of the study (11,40 and 40,50). It is understood that the alternative to be evaluated must meet the functional and operation requirements before addressing environmental and economic needs.
Table 5 Weights of the requirements for decision-making
| Requirement | Environmental | Economic | Operation | Weights (%) |
|---|---|---|---|---|
| Environmental | 1 | 3 | 1 | 40 |
| Economic | 0,33 | 1 | 0.2 | 12 |
| Operation | 1 | 1 | 1 | 48 |
Source: Authors
It is important to mention that the radius of consistency (CR) according to the matrix has been calculated at 3% (for 3 x 3 CR < 5% matrices) as the main characteristic of the AHP methodology and that it serves the consistency of the values indicated. In addition to the weights obtained via the AHP, as shown in Table 5, the rest of the indicators have been arranged in matrix form, obtaining the column vector that expresses their weights.
3.1. Characterization of the value function
To quantify the response of each indicator, MIVES incorporates the value or utility function. Such a concept suggests the mathematical articulation shown in Equation (1). The model characterizes and converts qualitative indicators into quantitative indicators on a scale of 0 to 1 (the worse response is associated with values close to 0, and values tending towards 1 imply a high satisfaction).
The value functions used in this research paper include units associated with costs (US $), emissions (kg/ton), energy consumption (Mj/ton), and temperatures (°C), among others, which have been converted and transferred to one-dimensional units.
The value function, specifically for the MIVES multi-criteria model, involves the characterization of five main parameters, configuring form and type according to the specific restrictions of each indicator. Four forms of the value function have been defined for this study: concave, convex, linear, and S-shaped.
This is mathematically described in Equation (1), where Xmín describes the axis of the abscissa, which is occasionally equal to 0; and Pi describes the slope of the value function itself.

For cases where the Pi parameter <1, the curve maintains a concave configuration. While for, Pi > 1, the curve can take an S-shape. In cases where Pi = 1, the format is characterized linearly. Equation (1) considers other parameters such as Ci and Ki, which allow the inflection of the curve itself. Finally, the Xmáx parameter refers to the value of the abscissa that generates a value close to 1. The B parameter is calculated by means of Equation (2).

Table 6 illustrates the values of each value function with respect to Equations (1) and (2) of the MIVES multi-criteria model. It is understood that each of these values have been reproduced to provide the study with traceability.
Table 6 Considerations of the value functions
| Indicators | Xmín | “Xmáx | C | K | P |
|---|---|---|---|---|---|
| Manufacturing | 165 | 15 | 50 | 0,65 | 0,5 |
| Compaction | 165 | 15 | 50 | 0,85 | 1,05 |
| Emissions to the atmosphere in units of thermal energy (ETE) | 240 | 90 | 180 | 0,65 | 0,3 |
| Emissions to the atmosphere in unitary fossil energy consumption (EFEC) | 500 | 100 | 340 | 0,65 | 0,55 |
| Emissions to the atmosphere, carbon dioxide (CO 2 ) | 30 | 8 | 19 | 0,68 | 0,85 |
| Emissions to the atmosphere, NOx | 0,06 | 0,018 | 0,039 | 0,65 | 0,8 |
| Emissions to the atmosphere, SOx | 0,4 | 0,12 | 0,204 | 0,65 | 0,8 |
| Raw materials used for asphalt mixing (aggregates) | 100 | 30 | 35 | 0,65 | 0,8 |
| Cost of manufacturing and transportation | 200 | 60 | 150 | 0,1 | 1 |
| Cost of emissions to the atmosphere in units of thermal energy (ETE) | 4 | 0,6 | 2,5 | 0,1 | 1 |
| Cost of atmospheric emissions in unitary fossil energy consumption (EFEC) | 6 | 0,7 | 4 | 0,25 | 1 |
| Cost of atmospheric emissions in carbon dioxide (CO2) | 1 | 0 | 0,6 | 0,09 | 1 |
| Stability | 15.000 | 4.990 | 11.400 | 0,15 | 0,55 |
| Flow | 4 | 1,8 | 2,46 | 0,1 | 1 |
| Retained resistance | 100 | 0,1 | 90 | 0,25 | 1 |
| Warp speeds range from 105 to 120 minutes | 30 | 1 | 18,4 | 2 | 0,45 |
| Resilient modulus | 18.000 | 1.000 | 16.000 | 0,5 | 0,35 |
| Fatigue deformation (traffic level equivalent to 750.000 axes, equivalent to 8,2 tons in the design lane) | 1.300 | 90 | 937 | 6 | 1 |
| Fatigue deformation (traffic level equivalent to 2.500.000 axes equivalent to 8,2 tons in the design lane) | 1.300 | 50 | 1.050 | 6 | 1 |
Source: Authors
Each indicator has been selected by discriminating between the alternatives considered (in this case, two types of asphalt mixtures). Likewise, indicators that do not contribute or incorporate significant difference between the solutions have not been considered.
On the other hand, manufacturing costs, emission reductions, and mechanical responses have been considered under that discriminatory plane. The characterization of the value functions has been carried out through the opinions of asphalt specialists regarding their experience, recognized values, and design regulations.
3.2. Performance/manufacturing temperature value function
One of the fundamental stages in the evaluation of decision-making is the configuration and selection of the curve of the value function for each of the indicators. In this study, each of the value functions has been constructed based on different assessments or aspects, such as compliance with regulations, environmental requirements, and the physical and operational performance of the different indicators analyzed.
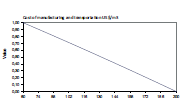
For the manufacturing indicator corresponding to the performance temperatures criterion a value function with a decreasing curve has been suggested. Figure 3 shows that the curve guides a reduction in the manufacturing process of asphalt mixtures with different technologies.

This means that, as asphalt technology produces technological solutions with the use of lower temperatures, it has a direct impact on environmental issues, and especially on workers’ health. In that sense, solutions with temperature reduction deal with an increase in the approval of the decision-maker (close to 1 in the value axis) regarding the value function.
The indicator is characterized by the parameter C = 50 °C, with the inflection points of the abscissa axis, K = 0,65, and the slope of the curve has been defined with P = 0,50. For Xmín and Xmáx, values of 15 and 150 (°C) have been indicated, respectively. Importantly, the Xmín and Xmáx values have been defined by two scenarios: the experience of the decision-maker and a review of international experiences of different technologies for manufacturing asphalt mixtures.
3.3. Manufacturing and transportation cost value function
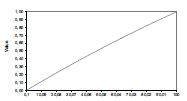
Figure 4 depicts the indicator defined for the manufacturing (and transportation) costs of an asphalt mixture. It is understood that the indicator has been incorporated into the study given the clear possibility of different costs between the two construction alternatives.

This indicator is characterized by the value of C = 150,00 (US $/m3), as well as the inflection point K = 0,1 and a proportional slope (p = 1) in the form of a decreasing line. The treatment of this indicator attempts to reflect construction (and material) solutions with lower manufacturing and transportation costs on a regular and consistent basis.
In addition, the values of Xmín and Xmáx have been defined as 60 and 200 US $/m3. Such values have been established via a careful analysis of studies and projects that deal with both hot and cold dense asphalt mixtures.
It is important to highlight that all the value functions for all the indicators proposed in the decision-making tree have been characterized. Although there is the possibility of modifying the trends and shapes of the curves, the moment of each indicator has been reflected at the time of the evaluation in its three proposed axes (environmental, economic, and operation).
4. RESULTS
Table 7 presents the sustainability index calculated for the two alternatives, as well as the values that reflect the performance in each requirement and each criterion. The application of the MIVES multi-criteria model guides the decision-making process according to the main pillars of sustainability.
Table 7 Asphalt sustainability indices for each requirement and criterion evaluated
| Asphalt Sustainability Index | Alternatives | |
|---|---|---|
| Dense hot mix (DHD) | Dense cold mix (DC) | |
| Each alternative | 0,57 | 0,76 |
| By requirement | ||
| Environmental | 0,16 | 0,38 |
| Economic | 0,06 | 0,09 |
| Operation | 0,35 | 0,28 |
| By criterion | ||
| Performance temperatures | 0,39 | 0,98 |
| Emissions | 0,43 | 0,96 |
| Consumes | 0,36 | 0,92 |
| Cost | 0,52 | 0,8 |
| Characterization | 0,65 | 0,84 |
| Deformation | 0,76 | 0,4 |
Source: Authors
The results obtained from this study have allowed discriminating responses in different scenarios: environmental, economic, and operation. In the same way, the model used allows reviewing the response of the studied alternative under different conditions. That means that the alternative can be evaluated from a single criterion, for example, with respect to performance temperatures or simply through the physical response of the material (deformability).
With the results obtained, a clear response of a better construction solution has been identified: the cold dense asphalt mixture, with a value index (sustainability) of 0,76 with respect to the hot solution (0,57). These results indicate that the cold asphalt mix alternative has better responses in the three axes proposed for the study (environmental, economic, and operation).
With respect to the environmental axis, the DC solution has better responses in terms of reducing manufacturing and compaction temperatures with respect to DHD. Importantly, the responses obtained in each of the value functions of both alternatives had significant differences in the results of the indicators evaluated.
In addition, the variables measured with respect to the emissions of each construction solution have important differences. The DC provides a value index close to maximum satisfaction (0,92), whereas the DHD has a value of 0,43 (on a scale of 0 to 1). In the same way, regarding consumption, the same behavior was evidenced by both construction solutions.
The results can be leveraged by a clear concern of the decision-maker to admit construction solutions, in this case of asphaltic materials, aiming for improvements in the reduction of emissions to the environment and, consequently, with regard to workers’ health.
Finally, with respect to the values obtained in the axis of operation, a value of 0,29 was obtained by the DHD solution and 0,27 by DC. This indicates that both proposals represent the same technological answer regarding the speed of deformation, stability, and the resilient modulus.
5. CONCLUSIONS
This research paper proposes to enhance the procedures to evaluate different technological solutions in asphalts by means of value analysis, considering the variables in an integral approach in a sustainable regime. The use of innovative evaluation structures using tools such as the MIVES methodology has allowed selecting the variables to be studied, as well as quantifying the responses of each of the indicators.
The evaluation of hot and cold dense asphalt mixtures through the MIVES multi-criteria methodology means a great methodological advance when measuring and comparing variables with different nature and units of measurement (emissions, costs, tons, etc.).
This study provides quantitative elements through the application of a mathematical model, with the clear objective of addressing the fundamental aspects of sustainability: economic, environmental, and social (in this case, the impact on workers’ health).
The characterization and deformation of both construction solutions implies equivalent responses. However, the values obtained should be addressed in detail in other iterations with respect to the degree of deformability and fatigue deformation.
Finally, the study represents the synergy of different work areas, i.e., the responses of bituminous-asphaltic materials and the characterization of such responses in a multi-criteria model. The results obtained allow for decision-making criteria to meet the implementation strategies of other technological solutions that correspond to current material performance needs with sustainable rigor.
The application of a multi-criteria model based on utility theory has been proposed, with the support of analytical hierarchy (AHP-MIVES) and value functions, which allowed comparing two solutions of dense asphalt mixtures with hot and cold alternatives.

