Introduction
Arboviral infections are a public health challenge worldwide due to their epidemic potential1. denghe, Zika and chikungunya are arboviral diseases that are transmitted by Aedes spp. mosquitoes. There are still limitations in understanding their epidemiological aspects2. Furthermore, they are of special interest in the Americas because of the re-emerging and emerging characteristics of Zika and chikungunya in this region, respectively3,4. However, these arboviral infections as well as their epidemiological behaviors have been associated with climatic variables5 (temperature, humidity, and precipitation), environmental phenomena (El Nino-Southern Oscilation), and geographic variables (altitude).
The climatic variables have an impact on the larval development of vectors belonging to the Aedes genus and can favor their spreading among human populations. Also, the geographical concomitance of arboviruses would facilitate epidemics and coinfections by these pathogens. It is also important to highlight that the presence of clusters of cases of arboviral infections could be explained by sociodemographic and human behavioral variables (poverty), as well as risk behaviors (failure to prevent and eliminate breeding sites, failure to properly dispose of garbage, failure to use awnings, mosquito repellent or clothing that covers skin exposed areas), either because of lack of knowledge of habits6. Consequently, multiple health-social determinants (HSD) have the potential when combined to facilitate the incidence and consequences of this virally transmitted infection. Therefore, the evaluation of the disease’s epidemiological behavior in each geographical location can provide relevant information to prioritize areas that may benefit from control and prevention strategies5,7,8.
Nearly 90 % of the Colombian territory is located within risk areas for transmission of these arboviral infections and the financial cost for dengue alone is approximately $131,700,000 American dollars9. Despite the control strategies implemented in the country, the Valle del Cauca department (including Cali) has historically been an endemic and susceptible region to having more cases of arboviral infections, compared to the rest of the Colombian territory10. Since these viral infections have a negative impact on people’s health as well as serious economic and social implications, it is essential to gather information regarding their spatio-temporal distribution with the purpose of identifying critical zones and prioritizing prevention and control actions8,11,12. Therefore, this study was aimed at assessing the spatio-temporal distribution of the reported risk for dengue, Zika, and chikungunya diseases and its relationship with both climatic factors and the aedic index, during the 2014-2016 time period, in Cali, Colombia.
Materials and methods
Design
A multi-method study was conducted, which combined descriptive and cross-sectional approaches to describe the frequency and demographic characteristics of the population impacted by dengue, Zika, and chikungunya viruses from 2014 to 2016. In addition, an ecological approach was applied to assess the spatio-temporal distribution of case incidence frequencies of these arboviruses. Finally, the correlation of these viral pathogens with the aedic index, temperature, and precipitation was analyzed from October 2014 to December 2016.
Study area
The city of Cali is the capital of the Valle del Cauca department and is located in the southwestern region of Colombia, on the western side of the Cauca River. The city is located at an altitude of 1018 meters above sea level and has 2,227,642 residents (based on the 2018 census carried out by the National Administrative Department of Statistics, DANE), who are distributed in 22 communes.
This department has registered important clusters in terms of the spatio-temporal distribution of dengue, Zika, and chikungunya viruses, which, in Cali shows that they are related to its tropical weather with two hot-dry and two cold-humid seasons. The hot-dry seasons run from December to February and from June to September (maximum average temperature of 31.9 °C and average monthly precipitation of 54.6 mm). In contrast, the cold-humid seasons run from March to May and from October to November (maximum average temperature of 28.0 °C and average monthly precipitation of 107.4 mm)13.
Information sources
The database of the Public Health Surveillance System (Sivigila) of the Public Health Department of Cali was used. Regarding reported cases, only confirmed or suspected cases of dengue, chikungunya, and Zika from the urban city of Cali were included. In contrast, the following were excluded: cases discarded by laboratories, cases discarded after Sivigila adjustments, records without geographic data, and cases from either rural areas or other cities.
The total precipitation (mm) and temperature data (°C) were obtained virtually from the 11 stations of the Regional Autonomous Corporation of Valle del Cauca (CVC) and it was used only for academic purposes. The aedic index data from the sewerage system of Cali were provided by the Health Department of the city. For the purpose of the analysis, the aedic index was classified as: <1 %: very low; 1 to 1.99 %: low; 2 to 2.99 %: medium; 3 to 3.4 %: high; and >4 %: very high.
Spatial analysis
Initially, the database was filtered using Microsoft Excel® and the home address variable of each reported case was transformed into a code (DG: diagonal; AV: avenue; CL: street; PJ: passage; KR: carrera; and TV: transversal). Before the address number, the numeral sign (#) was added to be geographically referenced using the geocoding service of the Spatial Data Infrastructure of Santiago de Cali (IDESC), through the urban road network, in order to determine the geographical location of each event. Finally, the obtained layers were adjusted to the local Cartesian coordinate system (Magna-Sirgas origin Cali 2009 “MAGNA_Cali_Valle_del_Cauca_2009”; reference coordinate system of Santiago de Cali).
Once the cases were geographically referenced, the existence of clustering or dispersion of cases was determined. To this end, the analytical procedure called “the average of the nearest neighbor” was carried out for each year with the purpose of identifying a clustering radius. Thus, the distances from each case to the closest one were averaged and the clustering or dispersion tendencies were obtained, with a value of 100 m. Then, the hot and cold spots were calculated, identifying geographical areas where there were cases grouped in a statistically significant manner (Getis-Ord Gi*).
The heat maps were created using the Kernel density geoprocess, obtaining continuous density surfaces, where point entities (disease cases) per area unit (km2) are concentrated. The precipitation (mm/year) and temperature (Celsius) data during the study period were collected from the CVC stations, which were georeferenced through the map found on the institution’s official website14.
The aedic index map was constructed from information related to the location of the neighborhoods and Aedes spp. breeding sites that were reported in those areas. From these data, the locations were classified through a color scale, ranging from blue (Aedes spp. breeding site number low and less than 1 %) to red (Aedes spp. breeding site number high and greater than 4 %).
Statistical analysis
An exploratory analysis was conducted for each variable, with the objective of evaluating their distribution as well as identifying extreme values and lost or missing data, making sure to ensure the quality of the database entry. Subsequently, a univariate analysis with each parameter was conducted in order to assess their behavior. The normality of these data was assessed through the Kolmogorov Smirnov test (n>30), where the data of categorical variables were presented as means and percentages. Finally, after verifying the behavior of variables, a Spearman’s correlation analysis was performed to statistically determine the correlation between the arboviral infections studied and the environmental variables.
Results
46,857 cases of arboviral infection cases were reported and studied during the study time period. However, 14.7 % of the cases were excluded due to non-georeferenceable nomenclature. Thus, 59.2 % of the 40,158 remaining cases were caused by dengue, 34.1 % by Zika, and 6.7 % by chikungunya. The average age of the individuals with dengue, Zika, and chikungunya was 29.6, 41.6, and 32.7 years, respectively. The chikungunya and Zika viruses more frequently affected women, compared to male individuals (64.3 % vs. 35.7 % for chikungunya, and 62.4 % vs. 37.6 % for Zika). In contrast, dengue cases occurred in a similar proportion in both genders.
In terms of health care insurance, it is noticeable that the majority of cases of dengue (82.2 %), Zika (90.9 %), and chikungunya (75.6 %) belonged to the contributory health system. On the other hand, 12.4 %, 4.75, and 19 % of the dengue, Zika, and chikungunya cases affected individuals were from the subsidized system, respectively. In addition, 3.9 % of the dengue cases, 3.7 % of the Zika cases, and 3.2 % of the chikungunya cases affected individuals were affiliated to special health care insurances. Finally, less than 2.2 % of the cases included individuals with no affiliation to any health care insurance.
33,340 cases were geocoded, which represents an 83.2 % of the total number of patients. On the other hand, 455 individuals were found outside of the defined geographical limits. The analysis of clusters of each event, and for all three combined, revealed the appearance of significant groups, with probabilities of less than 1 % for the chance for them to occur randomly (Table 1).
Table 1 Analysis of clusters for dengue, Zika, and chikungunya in Cali, Colombia between 2014 and 2016
*NNR: Nearest Neighbor Ratio.
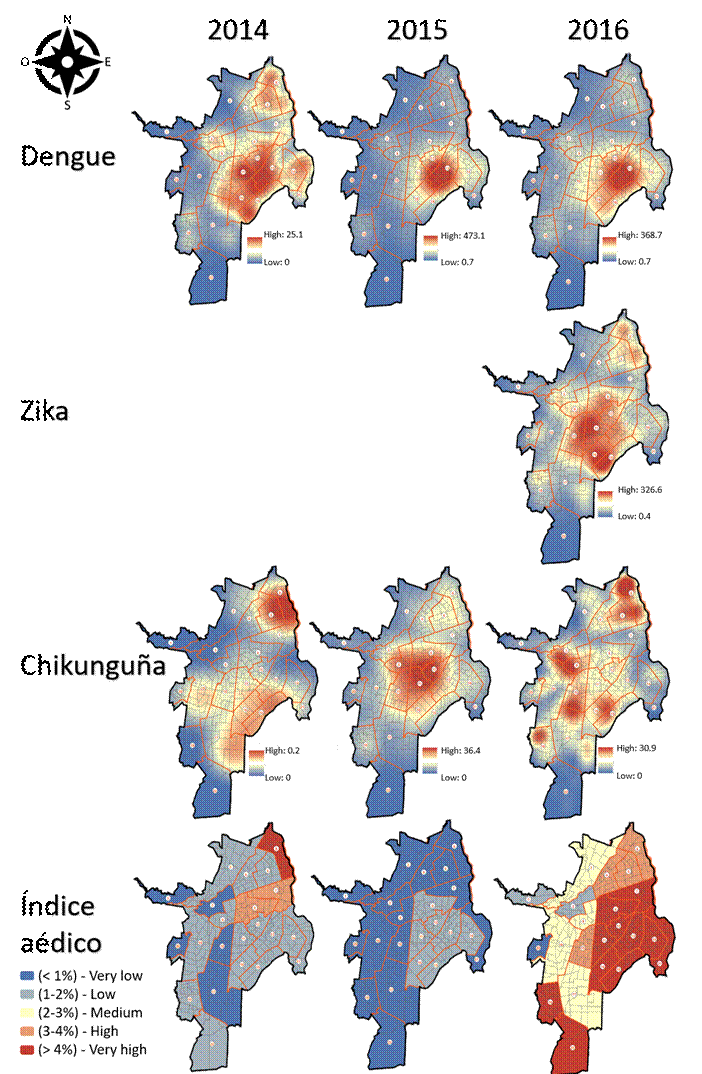
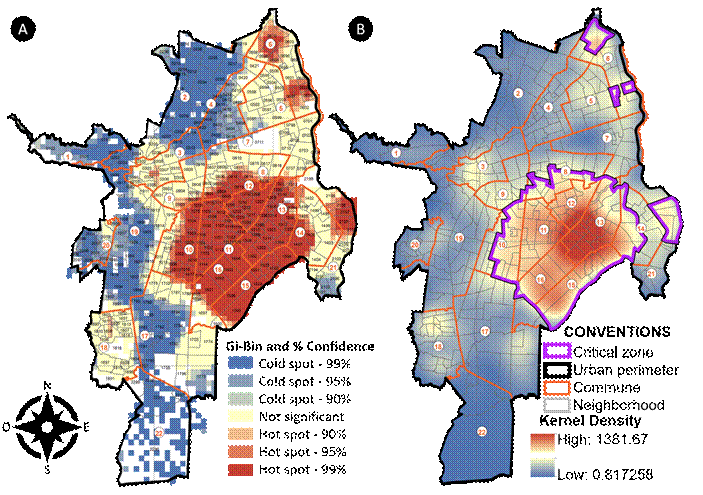
Figure 1 depicts the spatiotemporal distribution and Kernel density for each studied arbovirus, showing that the Zika cases could only be georeferenced for the year 2016. In 2014, an aedic index of >4 % was recorded for the commune 6, while communes 7 and 8 had indexes ranging from 3 % to 4 % (Figure 1). The pattern recorded in 2015 showed low aedic index levels in the eastern area of Cali, whereas a critical pattern was observed in almost all of the city during 2016. The most affected areas were the north, east, and center of Cali, which, together with communes 21 and 22, showed >4 % indexes. In contrast, the remaining seven communes distributed between the western and southern areas of the city presented rates fluctuating between low and medium. The analysis of hot spots and Kernel density were key to identifying critical zones in the center-east and northeast part of Cali (Figure 2).

Figure 1 Spatiotemporal distribution and Kernel density for dengue, Zika, and chikungunya, and the aedic index in Cali (Colombia), 2014-2016

Figure 2 Analysis of hot spots (A) and heat map (B) (Kernel density), with critical zones identified for dengue, Zika, and chikungunya between 2014 and 2016 in Cali, Colombia
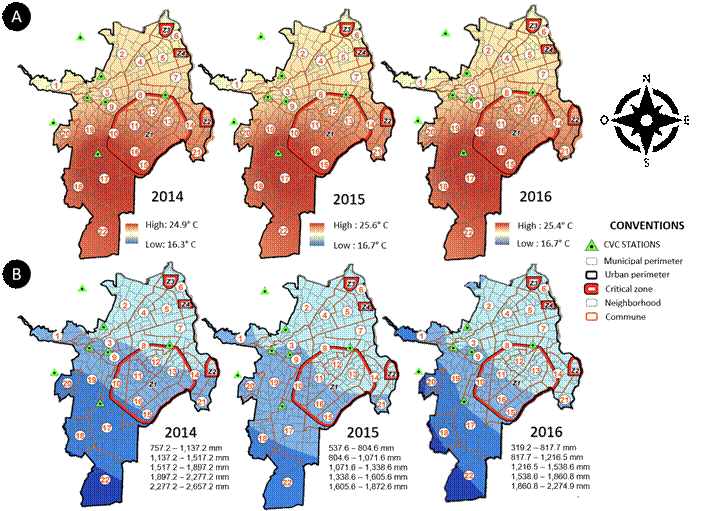
During the study period, the temperature of the city followed an almost constant pattern and the precipitation had a fluctuating behavior, showing the year 2014 as the one with the highest precipitation levels (Figure 3).
The average temperature recorded in the communes included in all the clusters was 21.5°C, which remained almost constant. In contrast, the rainfall recorded in the same communes fluctuated between 767.2 mm and 1517.2 mm. In 2014, the precipitations varied from 757.2 mm to 2657.2 mm, showing large fluctuations, but in general they were higher compared to the studied period. The northern and northwestern areas had the lowest rainfall (757.2 mm - 1137.2), while the central and eastern areas experienced rainfall levels ranging from 1137.2 mm to 1517.2 mm.
2015 was the driest year, with rainfall levels ranging between 537.6 mm and 1872.6 mm. The north and northeast regions showed levels between 537.6 mm and 837.6 mm, whereas the remaining eastern part of the city recorded rainfall values between 804.6 mm and 1071.6 mm. Finally, the precipitation level in 2016 was even lower, fluctuating between 319.2 mm and 2274.9 mm. The northern, central, and eastern areas, together with some neighborhoods in Z1, recorded values between 319.2 mm and 817.7 mm, while the remaining neighborhoods of Z1 showed figures between 817.7 mm and 1216.5 mm.
The score of the Spearman’s correlation coefficient for the aedic index, arboviral infections, and the studied environmental variables was p>0.05, indicating that there is no correlation. Nevertheless, the Spearman’s Rho value showed correlations between the cases and temperature and precipitation variables.
Discussion
The spatiotemporal study of cases of dengue, Zika and chikungunya in an endemic city for arboviral infections in Latin America during an epidemic period shows that these pathogens spread throughout Cali. However, there were case clusters in the center-east and northeast of the city, which could be generated by interactions between multiple eco-epidemiological and bio-psychosocial variables, together with the temperature, precipitation and the aedic index registered during the epidemic period.
The critical zones 6, 8, 10, 11, 12, 13, 14, 15, 16 and 21 recorded cases of at least one of the three arboviruses, highlighting the zones 11 and 12 as they reported cases of dengue, Zika, and chikungunya. These findings are consistent with a previous study conducted also en Cali, which identified the communes 11 and 12 as the most affected areas by Zika15. This observation could also indicate a risk for coinfections, which could make epidemiological surveillance difficult16-17. Also, the bio-psychosocial conditions of the center-east and northeast region of Cali must be considered, as majority of households from these areas live in poverty conditions18.
The prevention and control of arboviral infections represent a public health challenge since multiple variables (environmental and non-environmental) may affect their behaviors19. For instance, several eco-epidemiological and bio-psychosocial factors may affect transmission dynamics in the region, including temperature, precipitations, and humidity. In addition, other HSDs such as geographic, psycho-behavioral, and social factors must also be considered19-21. A previous study assessed the role of socioeconomic and environmental factors on a dengue outbreak at a neighborhood level22. The authors demonstrated that infection cases concentrated in areas with higher population densities and uncontrolled artificial breeding sites, while areas with higher socioeconomic levels had fewer cases22.
Another previous study investigated the local context involved in the transmission of the same arboviruses in Cali23. The authors reported that proximity to water channels, the presence of garbage, construction activities, community actions, and safety of neighborhoods affected the spread of these viral infections23. An additional research also conducted in Cali identified that the risk for arboviral infections and homicides is geographically clustered, specifically in the central-eastern region and in households belonging to the lowest social strata21. Therefore, additional studies are necessary to assess the underlying causes of the clusters of the analyzed arboviruses in more detail. Likewise, it is essential to investigate the acceptability and effectiveness of control strategies, since multiple HSDs may be hindering prevention and control of these viral infections20,23.
Although this study did not find a correlation between the analyzed variables, it is essential to consider possible substantial underreporting circumstances as evidenced by notable fluctuations of the aedic index during the study period. Furthermore, previous studies have demonstrated the influence of climate on the incidence of arboviral infections in different regions, highlighting associations with temperature, relative humidity, and precipitation24-28. Despite these findings, challenges still persist, such as assessing the influence of undocumented variables and temporal lags, which vary depending on the geographic location and their eco-epidemiological and bio-psychological contexts25,29-30.
In Cali, the time lags mentioned above can vary from one week to six months for dengue, which depends on the analyzed variable. Also, the peak of cases can appear after two to four weeks of a warm-dry period13. This time delay could explain the lack of correlation seen in our study and highlights the importance of future spatio-temporal analyses that consider these factors. Furthermore, the inclusion of bio-psychosocial variables of communities should be considered. Indeed, Dey et al.31 were able to predict the behavior of arboviruses through the simultaneous assessment of climate and socioeconomic variables of communities.
Public health strategies should be guided according to context data. Specifically for the city of Cali, given the potential influence of other factors different than temperature, precipitation, and the aedic index, an inter-institutional and multidisciplinary approach is necessary. This proposed methodology should include communities and simultaneously address aspects such as32: (i) epidemiological surveillance, with the inclusion of local environmental variables20-24,27,32; (ii) risk communication, which should strengthen and guide strategies towards the most vulnerable populations through the most commonly used communication media and with evidence-based methodologies33-35; (iii) vector control, which should combine individual activities of the communities to eliminate breeding sites and other control strategies, especially in the highest risk areas36; and (iv) comprehensive approach of other HSDs such as social and economic support, involvement of communities in their own care, reduction of violence in the city, infrastructure improvement, problems related to climate change, and access and safe storage of drinking water.
Conclusions
This spatio-temporal study has identified critical areas from the center-east and northeast of Cali, which are at risk for dengue, Zika, and chikingunya viral infections during an epidemic period, due to its environmental and geographical conditions. The observed spatio-temporal behavior of these pathogens could not be explained only by factors such as the temperature, precipitation and aedic index during epidemic periods. Thus, further research that includes additional variables is needed. However, the evidence presented here suggests that the behavior of these arboviral infections could be affected by interactions of environmental, entomological, epidemiological, and psycho-behavioral factors. Therefore, an inter-institutional and multidisciplinary collaborative approach is suggested in order to control arbovirus epidemics in Cali. This proposed strategy must involve communities and cover aspects such as epidemiological surveillance, risk communication, vector control, and the comprehensive approach of other potential HSDs.
This study faced several limitations. First of all, only a few of multiple variables that could affect the arboviruses behavior were evaluated. Nevertheless, all available data were included in the study. Secondly, the sources of information had considerable under-recording issues, which is why ethnicity and employment of patients were excluded from this study. Thus, effective strategies to verify the quality of the information reported to Sivigila are needed. Finally, additional under-registration issues could be caused by economic, social, and multi-causal difficulties, which impeded proper access to health care. However, we were able to report findings that are consistent with previous studies regarding the spatio-temporal distribution of arboviral infections.


