Introduction
Most roads worldwide have been constructed using hot mix asphalt (HMA). Due to its high manufactu ring temperatures (between 140 and 190 °C. [1]), it generates large quantities of greenhouse gases (GHG) and increases the consumption of fossil fuels during the processes of manufacturing, transport, and laying [2]. In response to these envioromental impacts engineers and researchers have deve loped asphalt mixtures than can be produced and applied at reduced temperatures [3]. Warm Mix Asphalt (WMA) is described as being produced at lower temperatures (between 100 and 140 °C) than HMA [4]. Warm Mix Asphalt (WMA) emerged in Europe as a response to the need for a bituminous mixture that offered energy savings while maintai ning the performance of hot bituminous mixtures. Some researchers have reported potential energy savings of about 30% [5]. Silva et al. [6] and New-comb [7] reported that WMA could reduce CO2 emissions by 46%. Blankendaal et al. [8] evaluated the environmental performance of WMA using life cycle assessment (LOA) and reported a 33% reduc tion in negative impact.
Other advantages of warm mix asphalt include reduced compaction effort, quicker turnover to traffic, and better working conditions due to the absence of harmful gases and reduced asphalt temperature [9]. The mechanical performance of WMA has also been studied. Xie et al. [10] com pared the mechanical impact of several types of WMA additives in the mixture; Sasobit, Rediset, and Evotherm were employed, with Evorthem reporting the lowest tensile strength. On the other hand,, the use of WMA additives in manufacturing modified asphalt mixtures with crumb rubber or other polymers has been mentioned. It was found that crumb rubber WMA had higher tensile stren gth, better moisture damage resistance, and fati gue performance than HMA incorporating crumb rubber [11]. Other authors mention a reduction between 20 and 30 Celsius degrees without affec ting the mechanical properties of the mixture [12].
From the point of view of aging, WMA pre sents better short-term oxidation of the asphalt binder due to the lower temperatures in the manufacturing, extension and compaction processes, which can positively impact fatigue resistance and cracking at low temperatures [13]-[15].
There are different methods to produce WMA, and it can be produced by adding organic mate rials, chemical additives, and foaming the asphalt [16], [17]. WMA additives reduce the viscosity of the binder to facilitate mixing with the aggregates, coating them better and improving their mixing process at lower temperatures.
The main objective of this research is to evaluate the effects of incorporating two types of additives when preparing Warm Mix Asphalt (WMA), whose base is an asphalt binder with a 60-70 penetration degree. The two commercially available additives were dosed gravimetrically at 2.00% and 3.00% concerning the binder weight. The inclusion effects analysis considers two aspects. The first is on the variations in the asphalt binder (ductility, visco sity, penetration index, softening and flame point). The second is on the changes in the asphalt mix ture (Marshal stability, flow, density, voids). The results are contrasted with the records of a typical Hot Mix Asphalt (HMA).
Materials and methods
The physical characteristics of 60-70 penetration grade binder and aggregates (coarse and fine) are presented in tables 1 and 2. The testing plan is reported in table 3 as a function of Binder content, Additive type and Additive content.
Materials
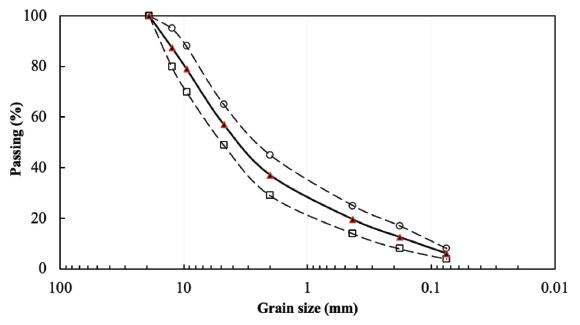
This study utilized conventional bitumen with a penetration grade of 60-70 to prepare specimens. Table 1 details the technical properties of the bin der. Siliceous aggregates, milled from river stone materials, were used as coarse and fine fractions, as well as filler material. The grading curve emplo yed in manufacturing the specimens followed the specifications of the National Roads Institute of Colombia (ÍNVIAS, by its acronym in Spanish), with a nominal maximum aggregate size of 19 mm intended for use as a wearing course in the asphalt pavement structure. Table 2 and figure 1 illustrates the properties and gradation curves employed in preparing samples.
Table 1 Specifications of 60-70 penetration grade binder
| Property | unit | Standard | Value | Specification |
|---|---|---|---|---|
| Penetration | 0.1 mm | INV - E 706 | 65 | 60 - 70 |
| Softening point | °C | INV - E 712 | 48 | 48 - 54 |
| Absolute viscosity 60°C | P | INV - E 716 | 1850 | min 1500 |
| Ductility | cm | INV - E 702 | >110 | min 100 |
| Ignition point | °C | INV - E 709 | 274 | min 230 |
Source: The authors.
Table 2 Basic properties of coarse and fine aggregates
| Property | unit | Standard | Value | Specification |
|---|---|---|---|---|
| Coarse aggregate | ||||
| Specific gravity | g/cm3 | INV - E 223 | 2.44 | - |
| Angeles abrasion | (%) | INV - E 218 | 25 | < 25 |
| Fine fraction | ||||
| Specific gravity | g/cm3 | INV - E 222 | 2.39 | - |
| Sand equivalent | (%) | INV - E 133 | 81 | > 50 |
Source: The authors.
As depicted in the figure, the black lines out line the upper and lower limits of the particle size distribution, while the grey line represents the gradation curve used for the sample preparation. Regarding the additives, two commercial WMA additives were used in this research. The first addi tive is a conventional surfactant additive compo sed of amines, referred to in this study as the "G" product. The other one, denoted as a "K" product in this research, has a solid granular appearance at 25°C. Its melting point of 147°C facilitates rapid addition and adhesion into the asphalt. It is employed to enhance the rheological properties of both conventional and polymer-modified binders. According to the providers, the K product decrea ses viscosity at temperatures above 110°C. The recommended dosage oscillates between 2.00% and 3.00% by weight of the bituminous binder.
Testing plan and methods
Firstly, the performance of the additives will be evaluated on the asphalt binder scale. Conse quently, the additives were mixed with the asphalt binder using a rotational mixer at 300 revolutions for 10 minutes. The modifiers were added in 2.00 and 3.00% per cent by weight of asphalt mixture. In this phase, the mixing temperature was approxi mately 155°C. The rheological properties of the binder were evaluated through the ductility test (INV - E - 702 - 07), where a standard-size brique tte of asphalt binder stretches to its failure brea king point. The penetration index was also defined to measure the consistency of the asphalt binder following the INV - E - 702 - 07 standard norma tive. The ring ball apparatus was also employed to determine the softening point of the bitumen (INV - E - 702 - 07). The flashpoint was calculated through INV - E - 709 - 07. Finally, the viscosity test was carried out to determine the mixing and compaction temperature of the asphalt mixture according to INV - E - 715 - 07.
In the second phase, the warm additives were assessed at the asphalt mixture scale through the density, voids test, Marshall Stability (MS), and flow test procedure (INV - E - 748 - 07). The concept of the design of experiments (DOE) was considered to deal with the experimental designs. This tool was very useful in determining the total number of mixtures produced. The complete factorial design was taken into consideration, and the control variables were the binder content (4.00%-6.00%), the type of additive, either G, K, or no additive (N), and its additive content (2.00%-3.00%). Four repli cates per mixture design were performed to con duct the statistical analysis. Table 3 shows the set of 25 experimental designs considered for manu facturing and analysis.
Table 3 Pertinent information of the experimental de signs assessed in the research
| Number | Design | BC* (%) | AT** | AC*** |
|---|---|---|---|---|
| 1 | 4.00-N-0.00 | 4.00 | - | 0.00 |
| 2 | 4.50-N-0.00 | 4.50 | - | 0.00 |
| 3 | 5.00-N-0.00 | 5.00 | - | 0.00 |
| 4 | 5.50-N-0.00 | 5.50 | - | 0.00 |
| 5 | 6.00-N-0.00 | 6.00 | - | 0.00 |
| 6 | 4.00-G-2.00 | 4.00 | G | 2.00 |
| 7 | 4.50-G-2.00 | 4.50 | G | 2.00 |
| 8 | 5.00-G-2.00 | 5.00 | G | 2.00 |
| 9 | 5.50-G-2.00 | 5.50 | G | 2.00 |
| 10 | 6.00-G-2.00 | 6.00 | G | 2.00 |
| 11 | 4.00-G-3.00 | 4.00 | G | 3.00 |
| 12 | 4.50-G-3.00 | 4.50 | G | 3.00 |
| 13 | 5.00-G-3.00 | 5.00 | G | 3.00 |
| 14 | 5.50-G-3.00 | 5.50 | G | 3.00 |
| 15 | 6.00-G-3.00 | 6.00 | G | 3.00 |
| 16 | 4.00-K-2.00 | 4.00 | K | 2.00 |
| 17 | 4.50-K-2.00 | 4.50 | K | 2.00 |
| 18 | 5.00-K-2.00 | 5.00 | K | 2.00 |
| 19 | 5.50-K-2.00 | 5.50 | K | 2.00 |
| 20 | 6.00-K-2.00 | 6.00 | K | 2.00 |
| 21 | 4.00-K-3.00 | 4.00 | K | 3.00 |
| 22 | 4.50-K-3.00 | 4.50 | K | 3.00 |
| 23 | 5.00-K-3.00 | 5.00 | K | 3.00 |
| 24 | 5.50-K-3.00 | 5.50 | K | 3.00 |
| 25 | 6.00-K-3.00 | 6.00 | K | 3.00 |
Note: * Binder content. ** Additive type *** Additive content
Source: The authors.
Initially, 1200 g of dry, cleaned, and blended aggregates were initially measured for manufac turing each sample. The mixed aggregates were heated and thoroughly mixed. Then, the hea ted bitumen with the additive was added to the aggregates mix until a homogeneous mixture was achieved. The mixing and compaction tempera ture depended on the results obtained from the viscosity test. The compaction method was done through the Marshall Hammer by applying 75 blows per face.
Once the cylindrical specimens were manu factured, the bulk-specific gravity and air voids properties were determined by measuring their volumetric properties. Afterwards, the stability and flow tests were performed. The Marshall Stabi lity corresponds to the maximum load to produce failure at the standard test temperature of 60°C. The load is applied at a constant strain of 50.8 mm/ min. The Marshall flow is the strain at the failure point expressed in 0.01 inch or 0.25 mm units.
Results
The research results are presented in two lines. The first corresponds to the asphalt binder and the additive's effects. The second refers to Warm Mix Asphalt and their Bulk specific gravity, VMA, air voids, VFA, Marshall stability and flow value.
Asphalt binder
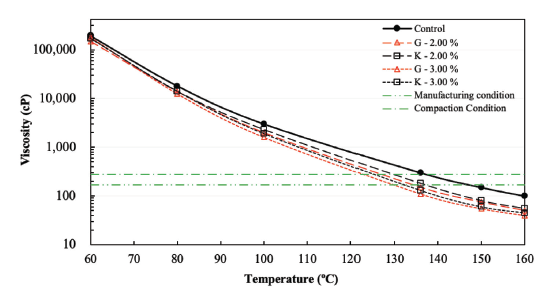
Table 4 shows the effects of WMA additives on the characterization properties of the bituminous bin der. According to the results, the penetration value slightly increased with adding the "G" product, while it remained almost constant with adding the "K" additive. In the same way, the WMA modified with additives increased the softening point, duc tility, and flash point properties. Although it was expected that with these modifiers, the viscosity was reduced and workability was improved, at these temperatures, the softening point tended to be higher because the microparticles tend to sti ffen the bitumen at these temperatures [18]. This phenomenon is clearly observed in figure 2. Visco sity is an indicator of the resistance to flow and its internal friction. The results show that the modi fied binders' viscosity is lower than the control binder as the temperature increases. Waxes have melting points inferior to the bituminous binder, which can become scattered during mixing. As the wax content increased, the viscosity decreased for higher temperature ranges. This phenomenon was observed equally in both additives.
Table 4 Effects of WMA additives to characterization properties of asphalt binder
| Binder property | Control value | G - 2.00% | G - 3.00% | K - 2.00% | K - 3.00% |
|---|---|---|---|---|---|
| Penetration [0.1 mm] | 65 | 67 | 68 | 65 | 66 |
| Softening point °C | 48 | 48.2 | 49.8 | 49.5 | 49 |
| Ductility [cm] | 140 | 142 | 144 | 145 | 144.6 |
| Flash point [°C] | 274 | 280 | 278 | 282 | 279 |
Source: The authors.
Based on the results of the viscosity curve, it was possible to determine the manufacturing and compaction temperatures of the bituminous mixtures. The manufacturing temperatura criterion yielded a viscosity value of 170 cP. The compaction temperatura was obtained for a value of 280 cP. Consequently, the range of manufacturing and compaction temperaturas can be observed in table 5.
Table 5 Manufacturing and compaction temperatures obtained from viscosity test
| Temperature / binder | Control value | G - 2.00% | G - 3.00% | K - 2.00% | K - 3.00% |
|---|---|---|---|---|---|
| Manufacturing [°C] | 146 - 154 | 132 - 135 | 126 - 130 | 132 - 137 | 128 - 131 |
| Compaction [°C] | 135 - 141 | 125 - 129 | 121 - 124 | 127 - 129 | 121 - 124 |
Source: The authors.
According to the results, the incorporation of either additives reduced the manufacturing and compaction temperatures of the mixture. Both admixtures functioned effectively, yielding quite similar values. Additionally, in both cases, a higher additive content led to a more significant reduction in temperature. This temperature reduction results in decreased energy consumption, greenhouse gas emissions, and a cooler working environment for asphalt workers [18].
Warm Mix Asphalt WMA
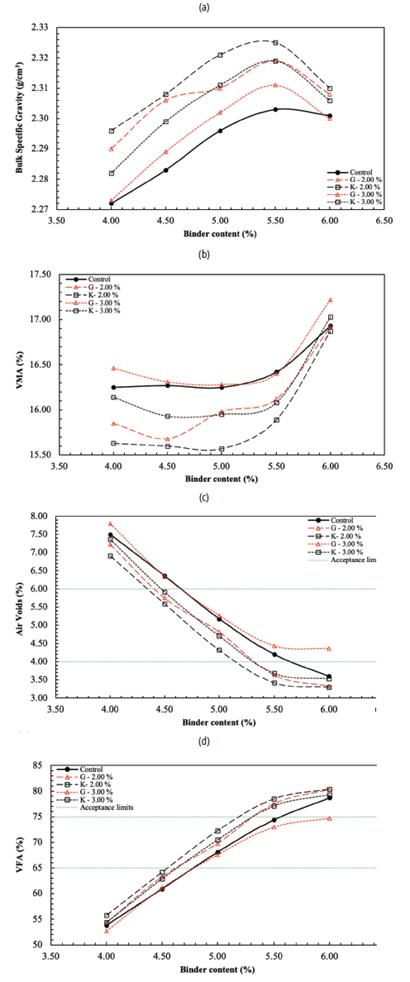
In compliance with Colombian regulations for designing dense-graded asphalt mixtures, bulk spe cific gravity, air voids, voids in the mineral aggre gate (VMA), voids filled with asphalt (VFA), Marshall stability, and flow value are the main parame ters used for quality control. Figure 3 displays the results regarding bulk density and volumetric pro perties. The black dotted lines indicate the limits set by Colombian regulations for high traffic levels.

Source: The authors.
Note: (a) bulk specific gravity; (b) Voids in the mineral aggregate; (c) air voids; (d) voids filled with asphalt.
Figure 3 Bulk Specific Gravity and volumetric properties of the mixtures
As depicted in figure 3a, the additives increa sed the bulk density of the mixture for the different bitumen contents. Regarding the VMA property, all mixes exhibited values greater than 15, the minimum suggested by Colombian norms for the wearing course. Concerning air voids pro perty, both additives led to a reduction as binder content increased, as observed in figure 3 c. The air voids ranged between 4.00 and 6.00% over a wide range of binder content, meeting the requirement of Colombian norms. Finally, VFA represents the voids in the mineral aggregate framework filled with bitumen. Consequently, the addition of the "K" product showed higher values than the con trol mixture, while in the case of "G'' product, the increment in this property was less noticeable.
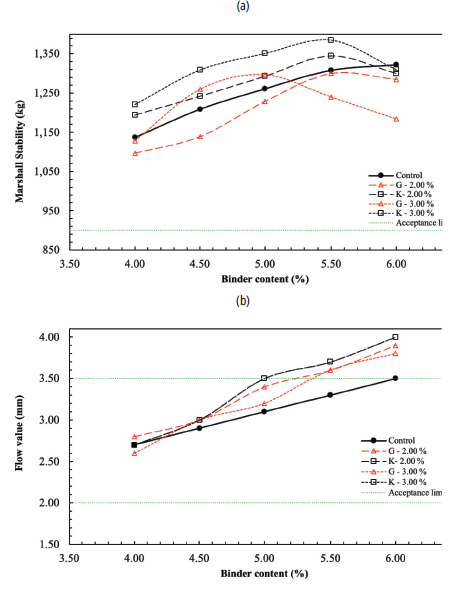
The Marshall Stability and flow value for the mixes were calculated, as shown in figure 4. The MS is a good indicator of the mixture's durability, while the flow indicates the asphalt mixture's flexibility, plasticity, and workability. Higher MS values were obtained with additive K at 3.00%, followed by the same additive at 2.00% by weight of asphalt binder. All mixes exhibited MS values greater than 900 kg, the minimum recommended in the Colombian specifications. Regarding flow value, the results suggest that the flow increases as the additive is added. The control mix had admissible flow values for the entire range of bitumen increments.

Source: The authors.
Note: (a) Marshall Stability; (b) Flow value.
Figure 4 Evaluation of mechanical parameters
On the other hand, in the WMA, the flow tended to be higher than 3.50 mm for bitumen contents between 5.00 and 5.50 %. This aspect is a clear indicator that warm mixes can contribute to the workability of the mix by allowing it to flow better. It is worth mentioning that mixes with significant stability and low flow value are not desirable since they are prone to developing cracks due to heavy moving loads.
The optimal binder content (OBC) for the five mixtures was calculated based on the average value of the following four criteria. i) The binder content (BC) associated with the maximum stabi lity (fig. 4a), ii) The (BC) related to the maximum bulk density (fig. 3a), iii) The average value of (BC) with which "air voids" range between 4.00% and 6.00% (fig. 3c), iv) The average value of (BC) with which "voids filled with asphalt" range between 65.00% and 75.00% (fig. 3d). Consequently, the OBC of the mixtures is shown in table 6.
Table 6 Optimum Binder Content OBC of the asphalt mixtures
| Asphalt mixture | N - 0.00 | G - 2.00 | G - 3.00 | K - 2.00 | K - 3.00 |
| OBC (%) | 5.50 | 5.20 | 5.30 | 5.10 | 5.20 |
Source: The authors.
According to the results, the mixture without any additive displayed the highest OBC, followed by the mixes G - 3.00, K - 3.00, G - 2.00, and K - 2.00. Including warm additives can reduce binder con tent by 0.2 to 0.4%. More significant reductions were achieved with the "K" product instead of the "G" one. WMA with K additives notably increased the Marshall stability and bulk density and decrea sed the total air voids inside the mix.
Conclusions
This study assessed the impact of two WMA addi tives on the characteristics of asphalt binder and asphalt mixtures. The "G" and "K" products were dosed by 2.00 and 3.00% by weight of asphalt bin der. Based on the laboratory tests, the following conclusions can be drawn:
Concerning binder characteristics, minimum changes were observed in penetration and softe ning point, ductility, and flash point. The impact of additives was notably noticed on the viscosity property of the asphalt binder. Both additives reduced the viscosity as the temperature in the mixture increased. The reduction in the manu facturing and compaction temperature leads to a decrease in energy consumption, greenhouse gas emissions, and a colder working environment for asphalt workers.
Concerning asphalt mixtures, incorporating additives tended to increase the bulk density, the voids filled with asphalt, and decrease the air voids inside the mix. Similarly, higher MS and lower flow number values were observed in WMA instead of the control mixture. Incorporating these addi tives can reduce the optimal bitumen content by between 0.2% and 0.4%.


