


 English (pdf)
 Article in xml format
 Article references
 Send this article by e-mail
 Cited by SciELO
  Cited by Google
  Similars in
SciELO
Similars in
SciELO  Similars in Google
 Permalink
The production of durum wheat is highly limited by abiotic stress in semi-arid regions and biotic stress in sub-humid areas (Mansour and Hachicha 2014). Frost and desiccation damage the floral organs and developing grain, which cause yield loss (Zheng et al. 2015). Determining the traits related to grain yield (GY) is essential to improve reproductive efficiency (Mohammadi et al. 2012). In this context, variables such as grains per square meter, biomass, harvest index, and reduced plant height are positively associated with GY progress (Xiao et al. 2012). Cycle length, days to heading and anthesis can be increased when moving from the warmest and driest zones to the coldest and wettest ones, inversely to the duration of the grain filling period (Royo et al. 2014). In addition, GY genetic gains for CIMMYT material are mainly associated with flowering time, grain size and grain weight (Lopes et al. 2012; Aisawi et al. 2015).
Plant breeders are interested in the selection of varieties that have good performance in a range of environments, thus selection is complicated by the presence of Genotype by Environment interaction (GE) (Oral et al. 2018; Benkadja et al. 2022). In general, complex traits such as GY and its components show GE interaction, which may be expressed as heterogeneity in genetic variance among environments and/or in the ranking of individuals (Burgueño et al. 2008; Karimizadeh et al. 2016). Multi-environment trials (METs) are important for studying the stability and adaptation of cultivars for grain yield, as well as for predicting the performance of genotypes in different environments (Solonechnyi et al. 2015; Solonechnyi et al. 2018). In this way, both yield and stability should be considered simultaneously to reduce the effect of GE interaction (Bose et al. 2014; Mohammadi et al. 2018). Such selections are very difficult to be make. A stable genotype is defined as one having an unchanged performance irrespective of any variation in the test environments (Karimizadeh et al. 2012; Sabaghnia et al. 2012). In this context, the use of selection indices is recommended (Benmahammed et al. 2010). Several structures can be used for modeling the GE. In fact, models which separate genetic effects into common and specific components can be the superior form of increasing the accuracy of genotypic selection (Crossa et al. 2006; Burgueño et al. 2007). One of the efficient models is the additive main effects and multiplicative interaction (AMMI) (Gauch et al. 2008). It has been considered as an effective way in graphic analysis method that can be applied in breeding programs (Mladenov et al. 2012). This displays more informative results for responses of different genotypes over environments such as describing specific and non-specific adaptability of genotypes and identification of the most discriminating environments (Kendal and Sener 2015), high yielding, stable genotypes, and interrelationships among environments (Mortazavian et al. 2014; Heidari et al. 2017; Ram et al. 2020). Solomon et al. (2008) applied AMMI analysis to determine the effect of GE interaction on durum wheat. Furthermore, one of the recommended strategies for assessing specific environmental challenges is genetic correlations between locations. Therefore, selection for a specific adaptation is a good for exploiting the interaction which can result in faster genetic progress than that of the wide adaptation (Karimizadeh et al. 2016). Indeed, the environments can be grouped into sub-regions based on the similarity of the genotype performances (Annicchiarico et al. 2006).
The fundamental step that needs to be taken in a crop improvement program is to evaluate and identify the best cultivars. This study aims to (i) analyze the performance of 14 Algerian durum wheat varieties in seven contrasted environments (ii) evaluate the intra-environment correlation between traits and (iii) to determine the best varieties according to specific or wide adaptation based on inter-environments correlation by trait.
MATERIALS AND METHODS
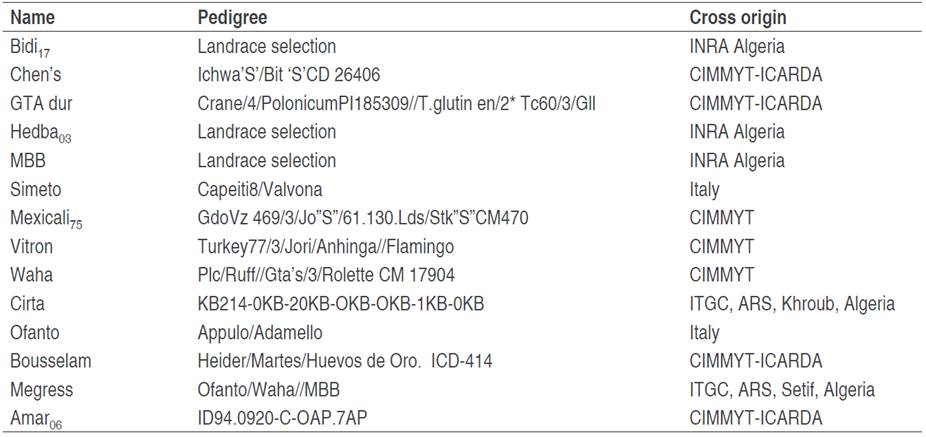
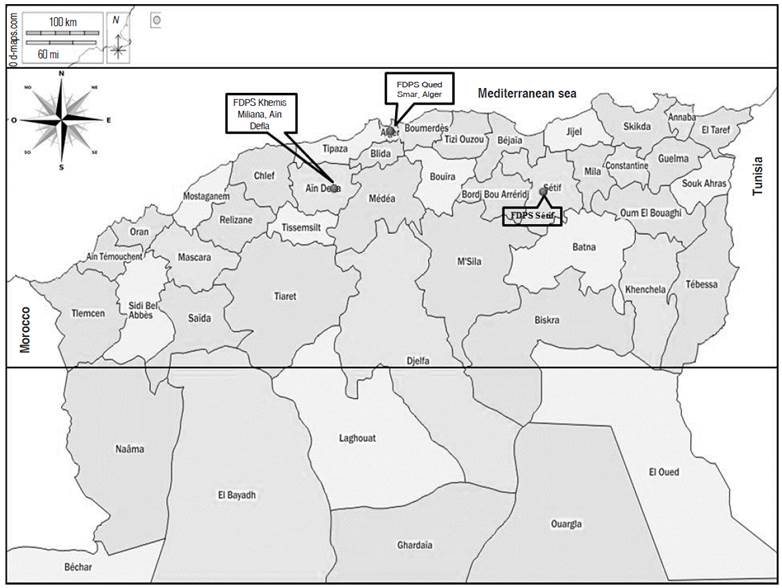
In this study, 14 varieties of durum wheat were evaluated (Table 1). The germplasm was supplied by the Technical Institute for Field Crops (ITGC, Algiers, Algeria). The experiment was carried out at three farms belonging to ITGC, at Sétif and Khemis Miliana during two seasons (2014-2015 and 2015-2016), and at Oued Smar during three seasons (2014-2015, 2015-2016, and 2016-2017), which represent contrasting environments. The Sétif experimental station (36°9'N and 5°21'E, altitude of 1,081 m) is located 5 km southwest of Sétif. It is characterized by a semi-arid climate with cold winters, irregular rainfall, spring frosts, and very high temperature at the end of the vegetation cycle (Mekhlouf et al. in Frih et al. 2021). Khemis Miliana station is situated on Bir Ould-Khelifa (High Cheliff), 10 km south of Khemis Miliana (Ain Defla, 36°10'N, and 2°14'E, altitude of 300 m). It is characterized by a semi-arid climatic stage with irregular rainfall and hot and drying winds. Oued Smar station is positioned on Beaulieu (Algiers, 36°43'N and 30°08'E, altitude of 24 m). It has a sub-humid climate with mild winter (Figure 1).
The rainfall recorded from September to June varies from 595.02 mm to 604.5 mm for the Oued Smar site, from 391.5 mm to 451 mm for Khemis Miliana, and from 339.85 mm to 340.26 mm for Sétif. The rainfall distribution presents a large monthly variability. The 2014-2015 campaign was marked by a water deficit from April to the harvesting time in all the experimental sites. Whereas the 2015-2016 campaign was characterized by a good distribution with significant amounts of rain. The temperature has a bimodal distribution, a low temperature during the vegetative stage from December to March in both sites (Oued Smar and Khemis Miliana) and from November to April in Sétif site and a high temperature at the beginning of the vegetation cycle and during the reproductive stage especially during the filling and ripening of grains.
Field trials done in seven environments (E1=Sétif 2014-2015, E2=Sétif 2015-2016, E3=Oued Smar 2014-2015, E4=Oued Smar 2015-2016, E5=Oued Smar 2016-2017, E6=Khemis Miliana 2014-2015 and E7=Khemis Miliana 2015-2016) were arranged in a randomized complete block design with four replicates. All environments were subject to the same conditions. Sowing of the 14 varieties was carried out by a plot seeder OYORD at the beginning of December using a density of 300 seeds per meter square in a micro-plot of 6 m2 per variety and block. Fertilizer was applied at a rate of 100 kg ha-1 of superphosphate (46%) before sowing and 75 kg ha-1 of N during winter (Tillering to stem elongation). Several agro-morphological, physiological and biochemical parameters were analyzed such as Days to Heading DH, Plant height PH (cm), Awn Length AL (cm), Spike Length SL (cm), Number of Spikes per square meter (NSM2), Number of Grains per Spike (NGS), Number of Grains per square meter (NGM2), Thousand Kernel Weight TKW (g), Grain Yield GY (q ha-1); Relative Water Content RWC (%); Chlorophyll Pigments Chla, Chlb, Chlab (µg g-1 of fresh matter), and soluble sugars SS (µg g-1 FM).
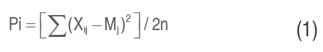
AMMI was used as a model to test the GE interaction of the 14 varieties across seven environments. Boussellam, Waha, and MBB were used as standard controls. Data were subjected to ANOVA multivariate using CropStat 7.2 (2007) software. The significance of the differences between means was determined atP<0.05 using the least significant difference (LSD) test. The correlation coefficients between pairs of characters by environment and between pairs of environments for each character were calculated by the Spearman rank using Past software version 3.2.1.The degree of stability was tested by the Lin and Binns Genotypic Superiority Index using Equation (1):
Where "Xij" is the grain yield of genotype "i" in the environment "j". "Mj" is the yield of the best-performing genotype in the "j" environment. "n" is the number of environments. Stability can also be measured by the coefficient of phenotypic variation. The phenotypic coefficient of variation (CV) is obtained using Equation (2):
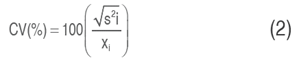
Where S2i = Environmental variance, Xi = Performance mean of genotype "i" across all environments.
RESULTS AND DISCUSSION
Yield performance and stability analyses
Analysis of variance showed high significant differences for variety and environment effects as well as their interactions in terms of yield. Relative to the LSD value at the 5% threshold which is 5.4, the additive variety effect (P<0.01, MS=460.99) indicates that GTA dur, Simeto, Chen's, Vitron, Ammar06, Ofanto and Megress showed the best grain yields with respective means of 32.5, 31.1, 30.3, 28.8, 28.8, 27.8 and 27.2 q ha-1 (Table 2). However, according to the LSD value which is 1.4, E7, E2 and E4 are ranked as the most high-yielding environments (P<0.01, MS=6777.65) (Table 2). Multivariate analysis for site effect (P<0.001, MS=4361.63) showed that Sétif is the most suitable in terms of yield (33.2 q ha-1. Mean value of E1 and E2) compared to Oued Smar (25.5 q ha-1. Mean value of E3, E4 and E5) and Khemis Miliana (21.2 q ha-1. Mean value of E6 and E7) (Table 2).
Table 2 Yields means by environment, coefficient of variation CV and index Pi of the studied varieties.
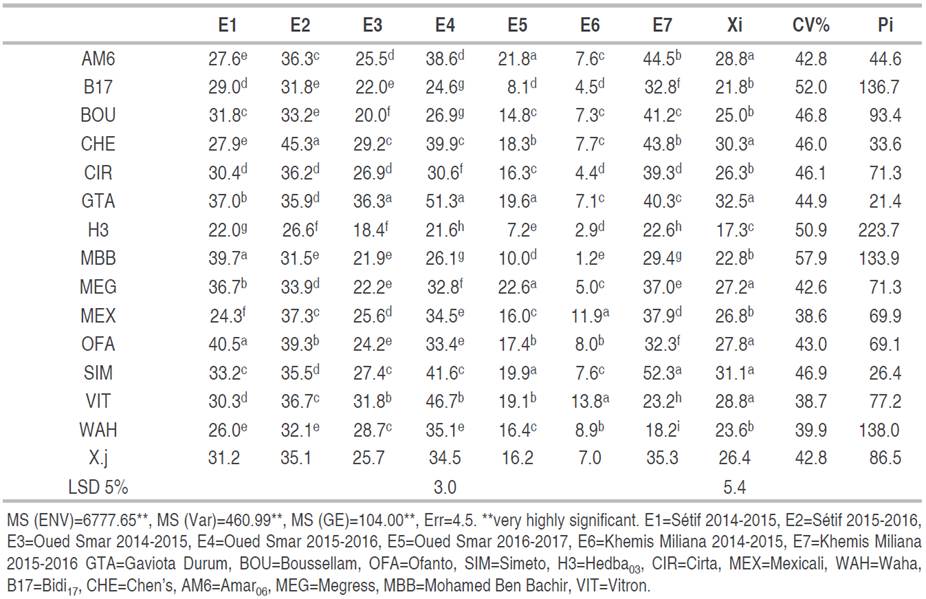
Analysis of the genotype x environment interaction (P<0.01, MS=104.00) (Table 2) indicates that the best genotype varies depending on the environment. Indeed, GTA dur, and Simeto occupied the top of the ranking in three and two among the seven environments, respectively.
Variations in yield between environments explain the variation in national cereal production, which is generally attributed to climatic conditions. This wide variation makes it difficult to create new high-yielding varieties. This kind of varietal behavior, induced by the GE interaction, has been reported by Haddad et al. (2016). It makes choosing the best genotypes difficult due to the instability of performance. Selection must therefore be made on the basis of yield performance linked to adaptability across environments. In this context, the use of selection indices is recommended (Benmahammed et al. 2010). Based on Pi index, GTA dur and Simeto are selected as stable and high-performance varieties.
The grain yield gains induced by the selection of Simeto and GTA dur, relative to the average yield of the standard controls, vary from 11.15% in E2 to 74.64% in E4, for GTA dur and from 2.13% in E1 to 76.68% in E7, for Simeto. The results of the present study corroborate those of Bendjama and Solonechnyi (2018) who reported that the grain yield varies according to sites, years, genotypes, and their interaction, and the greatest variation is mostly induced by the site effect, followed by the site x years interaction effect.
A high value of CV (%) shows a high inter-environment variability, which affects the stability of varieties. The CV values vary from 38.6 to 57.9% (Table 2). Taking into consideration the smallest coefficients of variation and the highest mean values of yield, the high-performing and stable varieties, which are selected are GTA dur, Ofanto, Mexicali, Amar6, Megress and Vitron (Figure 2).

Inter-character, intra environment relationships
The study of the relationships between traits is necessary for breeders to identify the effect of traits, which can be easily measured in the growing stage (DH, PH, NSM2, SL, AL, RWC, SS…etc.), inversely to the complex characters (NGS, GY, TKW…etc.) which are measured during harvest by destructive methods. Such characters can be used in the indirect selection of complex characters as highlighted by Salmi et al. (2019).
Analysis of the correlation between the measured traits (Table 3) indicates that the DH presents variable links, depending on the environment and the target character. Under environmental conditions, similar to Oued Smar and Khemis Miliana, a longue duration of heading value is not favorable for the achievement of a high grain yield, nor the NGS and NGM2. However, it is suitable for making a high straw yield.
Table 3 Coefficients of phenotypic correlations between measured variables in seven studied environments
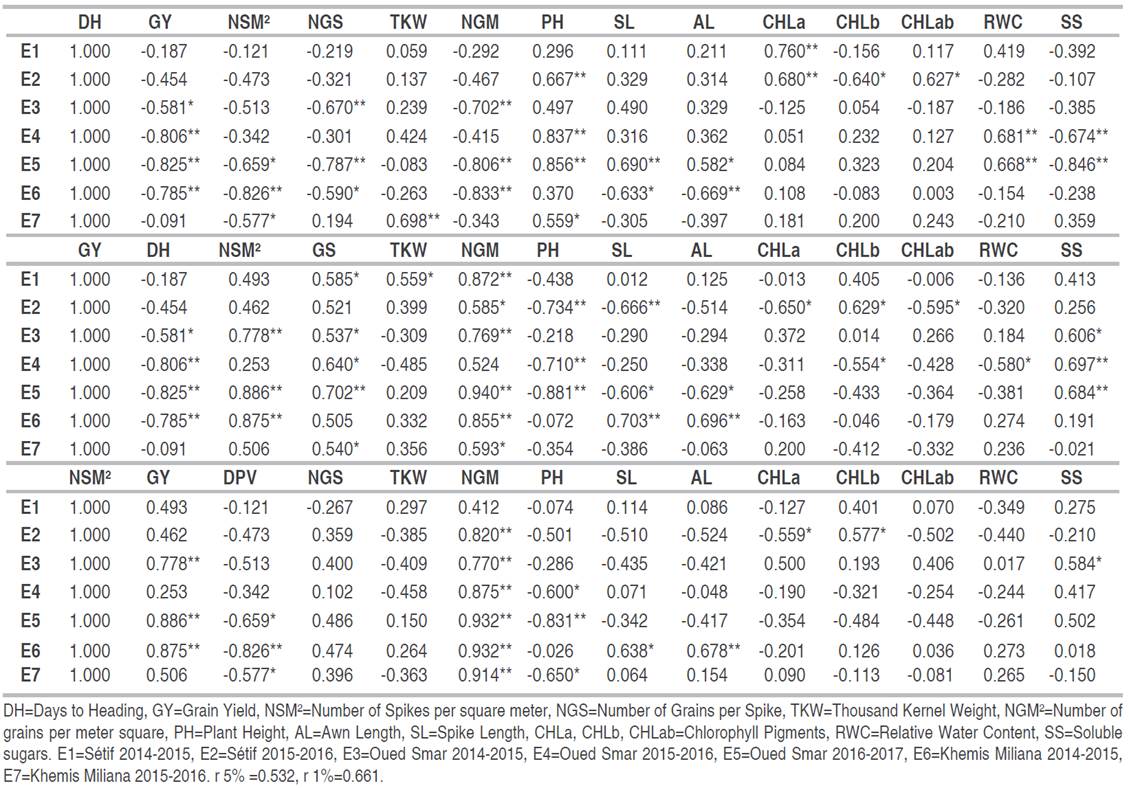
These results suggest that, when the conditions of the environment discriminate clearly between genotypes tested for the DH as shown in environments belonging to Oued Smar site, selection of early varieties generates more in terms of GY, but it is accompanied by a reduction in the PH and vice versa (Table 3). Similar results were reported in other studies (Gonzalaz-Ribot et al. 2017; Mohammadi 2019; Kumar et al. 2021). The relationship between DH and physiological traits (chlorophyll content and RWC) can be explained by the difference in expression between the late genotypes that express a higher chlorophyll content and RWC than the early ones. The inverse is true for the sugar content. The late cultivars characterized by a low GY should be more resilient than the early cultivars against environmental variability.
The grain yield is significantly and positively dependent on NGM2, NGE, NSM2, NGE, and NSM2, but negative with PH. The link with the SL and AL as well as with the chlorophyll content, RWC, and SS is dependent on the environment and when it is significant, it is inconsistent. Kumar et al. (2021) reported a significant and positive correlation between GY and SL at early sowing. Optimizing the grain yield of wheat is the main issue for breeders worldwide. Understanding relationships between grain yield with morphological, physiological, and biochemical traits across different environmental conditions could help plant breeders to develop wheat cultivars with improved and stable grain yield. The relationship shown between GY and PH suggests that the selection of efficient genotypes is accompanied by a reduction in the PH. Mohammadi (2019) reported that the plant height needs to be at medium level, to obtain a good grain yield. Annicchiarico et al. (2005b) found that the GY was negatively correlated with the straw yield. And the semi-dwarf varieties were top-ranking in terms of yield. Whereas, Royo et al. (2014) found that the greater plant height contributes to the good yield making under dry Mediterranean rainfed conditions. The differences SL and AL in addition to the physiological and biochemical traits do not seem to be decisive in grain yield making. Therefore, the selection on the basis of these characteristics appears secondary. For the same grain yield, the choice would be made on the basis of these characteristics, and in favor of a long spike and awns and high chlorophyll content and SS. A lot of studies highlighted that using physiological traits as a complement to agronomic traits, may help in identifying selectable features that accelerate breeding for yield potential and performance under drought (Fischer 2007; Araus et al. 2008; Cattivelli et al. 2008; Mohammadi 2019). Using an indirect selection of traits, associated with greater grain yield having lower GxE interaction would make results more reliable and repeatable in most of the environments. In fact, among these traits (NGM2, NSM2, NGS, NGM2, TKW, PH, CHL, AL, SL, RWC, and SS) only NGM2 followed by NSM2 can be used at an early stage to discriminate between the evaluated genotypes. Therefore, when variability exists for both variables, the selection is recommended for NGM2 or NSM2 and within varieties having similar NGM2 or NSM2. We select for other characteristics including NGS, followed by TKW and PH. Our results are in agreement with those of Laala et al. (2021), who reported a highly positive correlation between the number of spikes and the grain yield. In fact, the indirect selection via the number of spikes was the most efficient. Similar results of the relationship between grain yield and its components have been reported in previous studies (Moragues et al. 2006; Royo et al. 2006). They demonstrated that durum wheat yield grown under warm and dry Mediterranean environments is obtained mainly by the number of spikes per unit area. However, in cool and wet environments, kernel weight influences mostly the grain production. In addition, a high grain number conducive for a high yield can be achieved by the production of many small spikes (Bustos et al. 2013). Wheat yield can be affected mostly by the number of grains per m2 (Slafer et al. 2014).
The NSM2 is an essential determinant of NGM2, on which GY is widely dependent. Consequently, this parameter could be used as a criterion in breeding plants. Slafer et al. (2014) confirmed our conclusion: they declared that large changes in NGM2 are mainly related to NSM2. The varieties with tall straw, which were most often late at heading, have long awns and spikes, as well as a high content of CHLa and low in CHLb and SS. Overall, these results corroborate those reported by Mansouri et al. (2018). The days to heading had significant correlations and negative signs with the weight of 1,000 grains and the grain yield. Fellahi et al. (2017) noted that the yield is more linked to the number of spikes, and remains independent of the weight of 1,000 grains which did not show a significant link with the number of spikes. Mohammadi et al. (2016) reported that higher grain yields associated with a higher grain weight resulting from early flowering and selection on the basis of the weight of 1,000 grains can further improve the grain yield.
Relations inter environments
Analysis of the correlation coefficients of ranks inter-environments indicates that the order of classification of genotypes for DH remains relatively unchanged, especially in the E2 to E7 environments (Table 4). The ranking of this variable in the E1 environment (Sétif) is not significantly linked to other environments. GY also has a significant correlation between E3 to E6 environments, inversely to other environments (E1, E2, and E7), where the varieties ranking is different. The inter-environment rank coefficients of all varieties were most often significant for PH and NGM2. Whereas the inter-environment rank coefficients of NSM2, NGS, TKW, RWC (data not shown), and SS (data not shown) were not significant. This means that the classification changes from one environment to another.

GE Interaction often affects the yield of cultivars. This led to the evaluation of genotypes across a large number of sites to estimate yield potential and to analyze and understand the interaction pattern, with a possibility to group locations into homogeneous recommended domains sharing the same genotypes (Annicchiarico et al. 2006).
The results induced by the relation inter environments analysis for the GY trait suggest the absence of the GE interaction between the varieties in four environments (E3, E4, E5, and E6). This means that the order of the yield performance changes a little relatively in these environments, which do not show a specific behavior. This is in contrast to environments E1 and E2 (Site of Sétif), which rank the varieties differently for grain yield performance. These results propose that the Oued Smar and Khemis Miliana sites do not require repeated trials over time to identify the best performing varieties, while the Sétif site requires repeated trials over time. The data obtained for the DH suggest there is GE interaction between E1 and other environments (E2 to E7). These results indicate also that Khemis Miliana site predicts relatively well the order of varieties for the earliness at the Oued Smar site, but it is not the case for the Sétif site. Therefore, determination of the precocity can be made either on Oued Smar or Khemis Miliana site, but not necessarily on both sites at the same time. On the other hand, the order of varieties for this trait requires a specific determination on Sétif site. The divergence that appeared between environments for GY and DH traits can be explained by the fact that E1 (Sétif) is characterized by a harsh climate, especially in terms of temperatures, this makes it different from the other sites. The analysis of inter-environment rank coefficients of NSM2, NGS, TKW, RWC, and SS variables was not significant, suggesting the presence of GE interaction. While the information provided by an environment for PH and NGM2 can be exploited for the needs of other environments. Complex traits such as GY and its components present generally GE interaction, which affect the ranking of individuals (Burgueño et al. 2008; Karimizadeh et al. 2016). Moreover, the presence of repeatable GE interactions identifies cases of specific adaptations (Annicchiarico et al. 2006).
Based on the correlation coefficients of DH, GY, PH, and NGM2, the seven environments can be classified into two sets: the site of Sétif alone and the sites of Oued Smar and Khemis Miliana together. Inside each one, the GE interaction is relatively less notable for the four characters mentioned above. Therefore, a variety of recommendations should be made based on the specific adaptation to these two sets of environments separately. Our findings corroborate partially those defined by Annicchiarico et al. (2005a) using other approaches. GTA dur and Simeto (30.9 q ha-1 and 29.7 q ha-1, respectively) were the top-yielding over the subregion including Oued Smar and Khemis Miliani sites. Whereas, Ofanto (39.9 q ha-1) was the top-yielding over the sub-region that includes Sétif site. Understanding the genetic basis of adaptation and its environmental reasons is important to understand GE interaction, to evaluate the relationship between phenotypic and genotypic values and to improve selection of performing and stable genotypes (Joshi et al. 2010). Our findings agree with those of Karimizadeh et al. (2016), who reported that selection for specific adaptation is recommended because it can speed up the genetic progress better than selecting for wide adaptation in case of different mega-environment. In this case, a genotype has the ability to better exploit the agro ecology of the specific environment (Gauch 2013). Annicchiarico et al. (2005a) reported that specific adaptation could provide 2 to 7% of gains better than wide adaptation, in stressful sub-regions.
CONCLUSIONS
Multivariate analysis showed high significant differences for variety and environment effects as well as their interactions. In terms of yield. GTA dur is selected as stable and suitable variety using both stability index (CV and Pi) and Sétif is the most high-yielding site. The study of the relationships between traits is necessary in order to identify the effect of non-destructive traits, which can be easily measured before the harvest compared to other characters, which are measured during harvest using destructive methods. Such characters can be used in the indirect selection of complex characters of the grain yield. Therefore, the number of spikes can be used to discriminate between the genotypes evaluated for the grain yield followed by other characteristics such as number of grains per spike, the weight of thousand grains and the plant height. Selection based on biochemical and physiological characters seems to be secondary. Inter-environment correlation showed that the studied varieties were classified in the same way over almost all the environments for both traits of the plant height followed by the days to heading which are less affected by the environment. Whereas, the ranking of varieties is different for the grain yield due to the complexity of this trait. This suggests there is GE interaction. Therefore, varieties should be recommended according to the specific adaptation generating two sets environments. Therefore, Ofanto is the best cultivar in the two environments belonging to Sétif site, and GTA dur is the most efficient in terms of grain yield followed by Simeto in five environments of both sites (Oued Smar and Khemis Miliana). These results could be useful in a breeding program.

