


 English (pdf)
 Article in xml format
 Article references
 Send this article by e-mail
 Cited by SciELO
  Cited by Google
  Similars in
SciELO
Similars in
SciELO  Similars in Google
 Permalink
During these last decades, to counteract the consumption of ultra-processed and caloric products, a growing trend towards the consumption of healthy foods based on fruits and vegetables has been reported. This behaviour is due to the presence of bioactive compounds of high nutritional value and excellent health benefits such as the possibility of avoiding some chronic diseases (Ruiz Rodríguez et al. 2021). The nutritional importance of fruit juices is that they provided an excellent carrier to add probiotics to dairy products and may offer a synergy of health benefits over the fruit components such as natural antioxidants, vitamins, minerals, enzymes, and fiber (Žuntar et al. 2020). However, some fruits have not been properly valued for food processing. In Latin American countries, the Physalis peruviana L. (Goldenberry) is called: aguaymanto, uchuva, capulí, and uvilla. These fruits are juicy orange-yellow berries and contain numerous seeds, are rich in nutrients such as ascorbic acid and β-carotene, which could provide benefits with antioxidant potential (Kasali et al. 2021; Chasquibol and Yácono 2015). The principal bioactive components of goldenberry fruits are phytosterols (campesterol, β-sitosterol and stigmasterol), phenolic compounds, physalines, and withanolides, which could provide anti-inflammatory, antimicrobial, and anticancer properties (Puente et al. 2011). Another little explored fruit is the Passiflora mollissima, commonly known as poro poro, curuba or tumbo, which is a tropical fruit native to the southern Andes, whose fruit is generally consumed as fresh food (Conde-Martínez et al. 2014). Passiflora mollissima has potential bioactive metabolites with excellent antioxidants, phenolic components, a wide variety of flavonoids, and abundant proanthocyanidins (Ballesteros-Vivas et al. 2019, 2020).
On the other hand, the importance given to the by-products of an agro-industrial process is minimal. For example, approximately 90% of the total milk used in the cheese industry is eliminated as whey. It is important to note that this by product retains about 55% of the total ingredients of milk such as lactose, soluble proteins, lipids and mineral salts (Remón et al. 2016). Some possibilities for using this residue have been proposed, but statistics indicate that an important portion of this residue is still discarded as efluent, which creates a serious environmental problem in soil and water because it physically and chemically affects the structure of the soil and reduces aquatic life by depleting dissolved oxygen (Yadav et al. 2015). The industrial potential of whey is high, with emphasis on its agri-food technological processes, isolating a variety of nutrients such as vitamins, minerals, proteins, lipids, carbohydrates, and other components of high functional value for obtaining functional food products such as beverages (Illanes 2011; Rama et al. 2019; Mudgil and Barak 2019). Apart from the contribution of nutrients, functional beverages also have biologically active compounds that contribute to the prevention and treatment of chronic and degenerative diseases, generating benefits for improving health (Silveira Rodríguez et al. 2003; Minj and Anand 2020). For example, Montaño et al. (2011) reported that this type of beverage significantly reduces diastolic blood pressure, generating a positive effect in the adult population with heart failure, thus demonstrating cardioprotective properties, with endothelial function and blood pressure reducer.
Therefore, this work aimed to evaluate a functional beverage elaborated by taking advantage of fermented whey, Physalis peruviana L. (goldenberry) juice, and Passiflora mollissima (tumbo) juice. Their physicochemical, nutritional, and sensorial characteristics were evaluated.
MATERIALS AND METHODS
Raw material description
Physalis peruviana L. (goldenberry) and Passiflora mollissima (tumbo) fruits and whey were obtained from the city of Tarma (Junín, Peru). The fruits were selected at optimum commercial maturity with uniform yellow colour, and they had a mean weight and diameter of 6.2±0.2x10⁻³ kg and 1.7±0.1x10⁻² m, and 170.5±3.8x10⁻³ kg, and 4.5±0.4x10⁻² m, for goldenberry and tumbo fruits, respectively. On the other hand, the utilized fermented whey showed optimum characteristics of taste, smell, and yellowish colour, and it was without salt. All raw materials were characterised, and their physicochemical composition is shown in Table 1.

Experimental design
The experiment was designed using a simplex-lattice mixture design, described in Table 2. The independent variables were the different proportions of the factors: fermented whey, Physalis peruviana L. (goldenberry), and Passiflora mollissima (tumbo) juices. The proportions varied from 0.5 to 0.8 (whey), 0.1 to 0.4 (goldenberry) and 0.1 to 0.4 (tumbo). With these proportions, the functional beverage was elaborated and the influence of the factors on the physicochemical and sensory properties of the beverage was evaluated.

Beverage development
To prepare the beverage, firstly, the whey was pasteurized at 70 °C for 30 min and fermented at 42 °C for 4 h, for which acidophilic milk culture was used: Streptococcus thermophilus & Lactococcus bulgaricus (Sacco Lyofast, Italy). The fermented whey was filtered through No. 4 filter paper.
Goldenberry fruits were blanched at 85 °C for 1 min and then pulped, obtaining pulp free of seeds and shell, then filtered through a 60-mesh sieve to reduce the particle size of the pulp and obtain a homogeneous juice. Tumbo juice was obtained by pulping, followed by filtering through a 60-mesh sieve to separate particles, obtaining a homogeneous juice. Subsequently, the obtained juices were mixed with the fermented whey, according to the corresponding proportions of each one, as established in Table 2. The mixture was immediately homogenized, quickly pasteurized at 80 °C for 30 s, packaged, and subjected to instant cooling, obtaining the functional beverage.
Physicochemical analysis
Antioxidant capacity (AC). The antioxidant capacity of beverage samples was determined using the method proposed by Onyeoziri et al. (2016). For the procedure, 600 μL of DPPH (1,1-diphenyl-2-picryl-hydracyl) (Sigma-Aldrich, USA), was used and the initial absorbance at 517 nm was read, then 200 μL of each of the previously conditioned samples were added, the absorbance was taken every 30 s for 10 min, using a UV-Visible spectrophotometer (Shimadzu UV-1900, Japan). A calibration curve was constructed under the same conditions by replacing the sample with different Trolox concentrations and then used to express the results were expressed in kg of Trolox per kg of sample.
Total phenolic content (TPC). Total phenolic content was measured using the methodology proposed by Singh et al. (2016). For the analysis, the Folin-Ciocalteau reagent, sodium carbonate 7.5%, sodium fluoride (NaF), gallic acid, methanol and distilled water were used. For the procedure, the sample in a 1:2 ratio was placed in a test tube, and NaF 2 mM was added to inactivate the enzyme polyphenol oxidase and prevent the degradation of polyphenols during the test. The mixture was homogenized and centrifugated at 10,000 rpm for 15 min at 10 °C, then the supernatant was recovered and used to perform the reaction. For this, Folin-Ciocalteau reagent was added to the supernatant and mixed, after 5 min sodium carbonate was added and it was left to react for 1 h in the dark. Finally, the absorbance at 765 nm is measured using a UV-Visible spectrophotometer (Shimadzu UV-1900, Japan). A calibration curve was constructed under the same conditions by replacing the sample for different gallic acid concentrations and then used to express the TPC in kg of gallic acid equivalents (GAE) per kg of sample.
Flavonoid content (TF). Total flavonoid content was determined using the methodology proposed by Giura et al. (2019), with modifications. For the analytical procedure, a mixture of 0.5 mL of the sample with 40 mL of sulfuric acid solution (10% w/v) and 40 mL of ethanol (50% v/v) was refluxed for 2 h, then cooled and vacuum filtered, the residue was washed with 60 mL of ethanol (50% v/v), subsequently, the absorbance was read at 258 nm using a UV-Visible spectrophotometer (Shimadzu UV-1900, Japan). Flavonoid concentration was estimated using a calibration curve of catechin and the results were expressed in kg of catechin equivalent (CE) per kg of sample.
Vitamin C. Vitamin C content was determined using the methodology proposed by the AOAC (1990). For the analysis, 1 mL of filtered sample was mixed with 4-methoxy-2-nitro aniline acid reagent and then the absorbance was measured at 570 nm using a UV-Visible spectrophotometer (Shimadzu UV-1900, Japan). The results were expressed in kg of ascorbic acid (AA) per kg of sample.
Protein content. To determine the protein content, the Kjeldahl method was described by the FAO (1986) and Goyal et al. (2022). For the analysis, 1 g of sample was taken, placed in the flasks and sulfuric acid was added with the catalyst, after digestion, it was distilled to recover the amount of nitrogen, it was titrated and finally, the protein was quantified and expressed as a percentage concerning the sample.
Fat content. The fat content was determined by using the soxhlet method described by the FAO (1986) and Nyakang'i et al. (2023). For the analysis, 1 g of dehydrated extract was placed in the thimble, it was placed inside the soxhlet balloon and petroleum ether was added, the extraction process was performed for 16 h and finally, the fat content was quantified and expressed as a percentage concerning to the sample.
Soluble solids, pH, and solid content. Furthermore, it was evaluated the sample acidity by titration with NaOH (0.1 N), and soluble solids (°Brix) by direct reading with a refractometer, both according to the method described by the NTP (2017). In addition, pH was evaluated by direct reading with a pH-meter according to the method described by the A.O.A.C. 981.12 (AOAC 2012), and the solid content (dry matter) was determined according to the method described by FAO (1986).
Sensorial analyses. The samples were delivered to consumers in the morning in random order, the evaluation was carried out by 40 untrained consumers (males and females) with ages in the range of 20-50 years. For all treatments, the overall acceptability and the organoleptic attributes of appearance, taste, smell, and colour, were evaluated. For this, a consent form and a 7-point hedonic scale were used.
Statistical analysis. Results were processed with a confidence level of 95% by analysis of variance (ANOVA) and the least significant difference (LSD) test to evaluate differences among means of formulations by using the Statgraphics Centurion XVI software (Statgraphics Technologies Inc.; USA). The results of sensorial analyses were analysed by the Kruskal Wallis test to evaluate differences among medians of formulations. Subsequently, both physicochemical and sensorial results were evaluated using a simplex-lattice mixture design (Table 2) by using Statistica 7 (StatSoft. Inc., USA) software.
RESULTS AND DISCUSSION
Physicochemical characteristics and composition of beverages
Table 3 shows the results of the physicochemical composition and characteristics of beverages prepared for each treatment. Regarding the physicochemical content, the dry matter content ranged from 10.10 to 21.17%, acidity from 0.45 to 2.15%, protein from 1.13 to 1.92%, and fat from 0.11 to 0.18%. It is observed that the proportions of fermented whey or fruit juices influence the physicochemical composition, it is because as shown in Table 1, whey contributes mainly to protein and fat content. In fact, whey has been used to increase the protein value of fruit-based beverages such as Theobroma grandiflorum (copoazú) (Basantes et al. 2020) and passiflora edulis (passion fruit) (Valencia et al. 2002), where similar results of pH, dry matter and protein were reported.

Bioactive compounds in beverages
The incorporation of fruit juices will contribute to increasing bioactive compounds such as the phenolic content, antioxidant capacity and Vitamin C in beverages. Table 4 shows the content of total phenols (TPC), antioxidant capacity (AC), total flavonoid (TF), and Vitamin C. The treatment T1 showed the lowest values for all the parameters evaluated. This sample contains the lowest proportions of whey (50%) and tumbo (10%), of these two ingredients an increase in tumbo juice proportion provided a greater amount of bioactive compounds since as observed in Table 1, tumbo juice presents higher amounts of bioactive compounds compared to whey. Total phenolic content, antioxidant capacity, and flavonoid content were in the range reported in a fermented whey beverage with Passiflora mollissima Bailey extracts (Sánchez et al. 2013). However, it is important to consider a possible interaction between phenols of fruit juices and macromolecules such as proteins and lipids from whey could occur (Bansal et al. 2019). Therefore, this may explain the non-linear behaviour between the amounts of biocompounds (Table 4) and the proportions of the ingredients used in the formulations (Table 2).

Similar functional beverages with high bioactive compounds content have been studied, which include the use of whey (reconstituted whey powder or fresh whey) and fruits, such as guava-flavoured whey beverages (Silveira et al. 2019), strawberry-flavoured whey beverage (Souza et al. 2019). The presence of phenols gives fermented milk beverages excellent antioxidant potential. The presence of phenols gives fermented milk beverages excellent antioxidant potential. In addition, whey-based beverages made from fruits and whey provide significant amounts of vitamins, as was reported by Tranjan et al. (2009).
Sensorial acceptability of functional beverages.
It was performed the sensorial evaluation of beverages (10 treatments) and the results were analysed through multiple comparisons by the Kruskal Wallis test. On the one hand, regarding the taste and colour (Figure 1A and C), compared to other formulations, the formulation T5 showed the best score (P<0.05), which contained 55% whey, 30% goldenberry juice, and 15% tumbo juice, while the least preferred was the beverage corresponding to formulation eight (T8) containing 80% whey, 10% goldenberry juice and 10% tumbo juice. Lower scores may be due to too much cheese flavour in the beverage. This was demonstrated years ago by Branger et al. (1999), who found that with an increasing percentage of fermented whey in the beverage, cheese flavour increased, while acidity, astringency, sweetness, and fruit flavour decreased. In contrast, regarding the smell (Figure 1B), there were no significant differences (P>0.05) among formulations.

Figure 1 Boxplots of sensorial attributes (taste, smell, colour) and overall acceptability of functional beverages.
On the other hand, the overall acceptability (Figure 1D) reflects the observed when individual sensorial attributes were evaluated, where T5 and T8 obtained the highest and lowest scores, respectively. However, regarding the overall acceptability, there was no significant difference (P>0.05) among T1, T2, and T5 (most preferred) while the less preferred were formulations T7 and T8. Therefore, by considering the composition of these formulations (Table 2), an increase in the percentage of whey above 60% in the formulations has negative effects on sensory attributes and general acceptability, on the contrary, an increase in the percentage of goldenberry juice has a positive effect on sensory acceptability. In fact, it has been reported that the incorporation of whey and fruits in the formulation of beverages influences flavour, mouthfeel, aftertaste, viscosity, soluble solids and sedimentation (Saxena et al. 2015). Showing that the development of functional beverages based on whey requires the addition of fruits, plants, cereals, and others, which positively contribute to the taste, smell, colour, homogeneity, sweetness, acidity, and viscosity (Rodríguez-Villacis and Hernández-Monzón 2017; Basantes et al. 2020). Therefore, more optimization studies are necessary for this type of product so that, in addition to the potential functional properties, they also have organoleptic quality.
Simplex-lattice mixture design analysis
The simplex-lattice mixture design analysis was applied to physicochemical and sensorial experimental data. Three models were applied, of which the special cubic model had the best fit for all variables. However, the values of the coefficient of determination (R2) were low, especially for the variables: fat, TF, and AC (Table 5) which means that, for these response variables, the three models adjusted do not adequately describe their behaviour. This could be due to a possible complex interaction among components of fermented whey, goldenberry, and tumbo in formulations. Therefore, the interaction between components of the raw materials used here and other models could be better explored in future research. Therefore, only for the variables of protein, TPC, Vitamin C, and OA, in which the model had a value of R2≥0.70, the contour plots (fitted response) were shown and analyzed. From the contour plots, it is possible to establish ranges of the levels of the factors that allow obtaining the highest content of compounds or the highest acceptability.
Table 5 P-value, fit criteria, and coefficients of the models fitted to experimental data for each variable response.
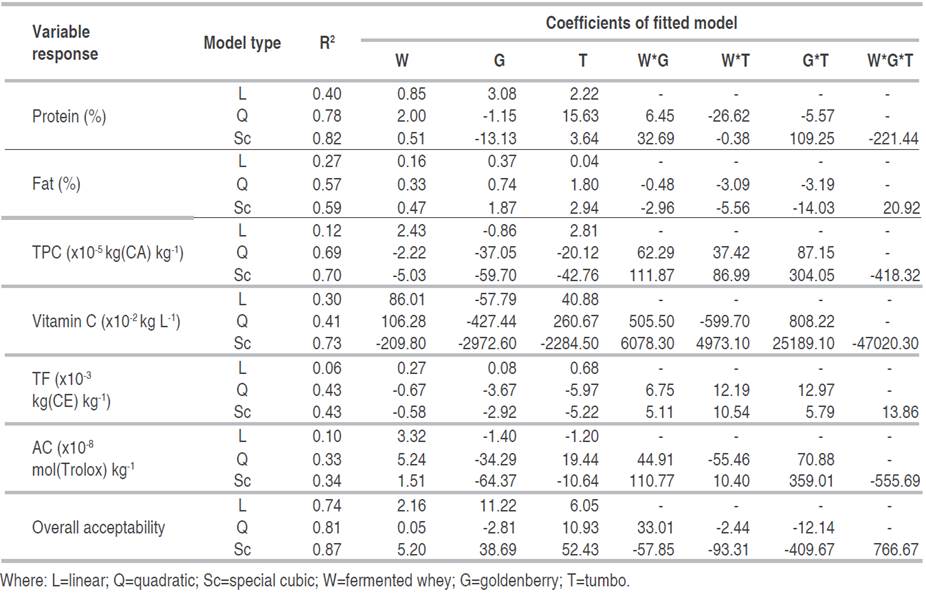
Figure 2A shows that a higher level of TPC could be found in the level ranges of 0-0.333 for fermented whey, 0.167-0.583 for goldenberry, and 0.417 and 0.667 for tumbo juices, which correspond to proportions from 50 to 60% for whey, from 15 to 27.5% for goldenberry juice and from 22.5 to 66.7% for tumbo juice. On the other hand, Figure 2B shows that values higher than 50x10-2 kg L-1 of Vitamin C can be obtained at whey levels between 0 to 0.083, goldenberry juice from 0.167 to 0.583, and tumbo juice from 0.333 to 0.833, which correspond to ranges of proportions between 50 to 52.5; 15 to 27.5 and 20 to 35% for fermented whey, goldenberry and tumbo juices, respectively.

Figure 2 The Contour graph and the special cubic model fitted to the data of TPC (A) and Vitamin C (B) depending on the whey (W), goldenberry (G), and tumbo (T) juice proportions.
The contour graph of Figure 3 shows that higher protein content could be found at levels between 0 and 0.167 for whey and between 0 and 1 for both goldenberry and tumbo juices, which correspond to proportions of 0 to 55% for fermented whey, 10 to 40% for each juice, respectively. However, it is not the only region where higher values could be found in terms of protein content. It is observed that, if the fermented whey level is increased to 0.333 (60%), the goldenberry juice level must be greater than 0.667 (>30%) and the tumbo juice level must be lower than 0.167 (<15%). On the other hand, Figure 4 shows that the greater overall acceptability of beverages can be obtained at levels lower than 0.33 for whey (<60%) and levels higher than 0.5 for goldenberry (>0.25%), and levels lower than 0.25 for tumbo (<17.5%).

Figure 3 The Contour graph obtained with the special cubic model fitted to the data of protein content depending on whey (W), goldenberry (G), and tumbo (T) juice proportions. In detail, the fit value R2 of the model is shown.
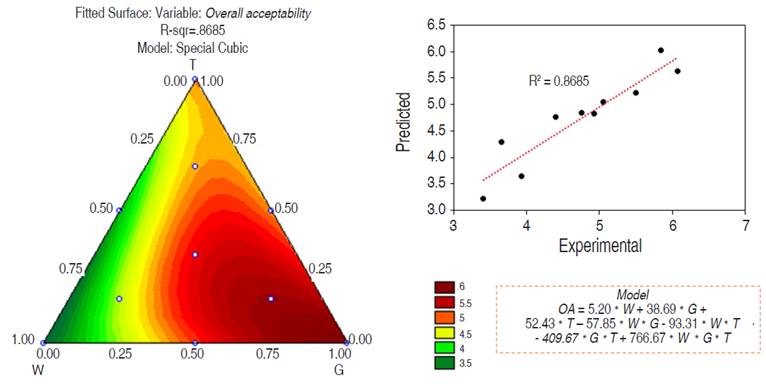
Figure 4 The Contour graph obtained with the special cubic model fitted to the data of overall acceptability depending on whey (W), goldenberry (G), and tumbo (T) juice proportions. In detail, the fit value R2 of the model is shown.
The content of protein, TPC and Vitamin C in the beverage was optimized using the desirability function. Therefore, it was obtained that to simultaneously obtain the best values in these three variables, it is necessary to use 50% of whey, 21.7% of goldenberry juice, and 28.3% of tumbo juice. However, the ranges of the proportions of goldenberry and tumbo juice are not within the range of optimal values for general acceptability observed in Figure 4.
Therefore, to ensure that the beverage has good composition and sensory properties, it was selected the variables with the best fit of the model (protein and general acceptability) to perform the optimization. Figure 5 shows the optimization to obtain the highest values of protein and overall acceptability, being necessary with the use of a proportion of 50% whey, 40% goldenberry juice, and 10% tumbo juice.

CONCLUSIONS
The proportions of fermented whey, Physalis peruviana L., and Passiflora mollissima affected the protein, fat, and acidity, total phenolics content, total flavonoids, ascorbic acid, and antioxidant capacity of beverages. Regarding sensorial attributes, it was observed that an increase in the percentage of fermented whey above 60% in the formulations has negative effects on sensory attributes and general acceptability, on the contrary, an increase in the percentage of goldenberry juice has a positive effect on sensorial properties. Finally, by optimization of both protein content and overall acceptability, the formulation with 50% fermented whey, 40% Physalis peruviana, and 10% Passiflora mollissima was the optimal mixture. It is recommended to evaluate lower serum concentrations (<50%) to avoid residual cheese flavour and thus improve the organoleptic properties.

