Kikuyu grass Cenchrus clandestinus (Hochst. ex Chiov.) Morrone is native to tropical Africa (northeast, east, central west and south) (USDA 2024). It was introduced into Colombia just before 1930. It is a perennial herbaceous, stoloniferous and rhizomatous plant. The stolons -aerial, creeping stems- can exceed 3 m in length, while the rhizomes - underground stems- can reach 1 m deep. Sometimes it develops aquatic stolons (floating or submerged). These characteristics allow it to colonize extensive areas superficially as well as underground, which is desirable during establishment. However, this can become a negative aspect, since stolons and rhizomes can reach a high level of deterioration when the pasture is improperly managed. This detriment, although it does not affect the persistence of the species, does reduce the productive potential of the crop and as a consequence, the quality of the forage.
In the Colombian high tropics, kikuyu grass typically represents between 65-95% of the botanical composition of herbaceous plants commonly found in the pastures, constitutes the main forage source and is the most used species in specialized dairy production systems in the country's dairy belt. However, inadequate management of the species has led to the degradation of extensive areas, the loss of productivity and a decrease in the environmental and economic sustainability of a large number of hectares, reflecting a reality that ranchers in the tropical high Andean regions of the country commonly face.
Pasture mulching is the result of the progressive deterioration of the different vegetative structures of a plant, mainly its leaves and stems. Consequently, it is common to observe limited growth of the aerial part (dwarfism); significant shortening of the distance between knots; lignification of stems, and death or senescence of leaves located in lower positions. This detriment can also occur in subterranean stems (rhizomatous mulching), which sometimes exceeds 1 m in depth; or it can also be observed, as typical, in aerial stems, including stolons (stoloniferous mulching). This degenerative condition is one of the most influential aspects in the loss of quality and productivity of kikuyu grass. In summary, when the deterioration is superficial, small plants can present a high degree of lignification (especially favored by continuous overgrazing) or a higher cushion, generated by undergrazing. On the contrary, when it grows underground, a network of rhizomes can be observed.
Grasslands are at risk of degradation due to unsustainable management practices and climate change (Milazzo et al. 2023). Therefore, evaluating grazing management practices on soil quality is essential for ensuring the sustainability of pastures, which represent the largest land use in world agroecosystems (Amorim et al. 2020). To this end, soil quality indices are widely used as comprehensive tools of soil function for grouping and assessing multiple soil properties (Chaudhry et al. 2024).
Soil quality is defined as the ability of soil to perform ecological functions, provide ecosystem services in order to maintain biological productivity, and environmental quality, and improve plant and animal health (Joimel et al. 2017). External factors such as parent material, climate, topography, or hydrology can alter soil properties, making it impossible to establish universal values of soil quality (Bünemann et al. 2018). A common approach to determining them is through the selection of physical, chemical and biological indicators (Milazzo et al. 2023; Koureh et al. 2020; Valle and Carrasco 2018).
These indicators are used as parameters to assess soil quality. However, the evaluation of soil quality cannot be performed based on a single parameter. Thus, the need arises to establish a minimum data set (MDS) including physical, chemical and biological variables (Joimel et al. 2017). However, the difficulty is when the indicator does not have an optimal reference value for a specific soil type and use. Consequently, an indicator is useful if the value can be interpreted unambiguously and the reference values are available.
The present study aims to establish soil quality indicators related to pasture degradation and forage yield of kikuyu grass (Cenchrus clandestinus).
MATERIALS AND METHODS
Description of the study site
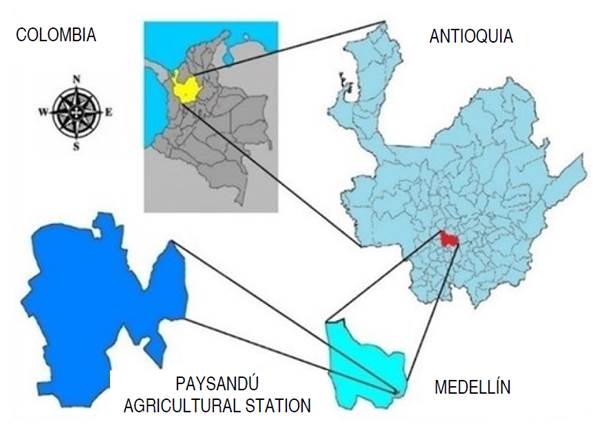
The research was carried out at the Paysandú Agricultural Station of the Universidad Nacional de Colombia, located in the Santa Elena township, to the east of the city of Medellín, Department of Antioquia, at a distance of approximately 18 km from the downtown area (Figure 1). It is located on Andisols in the very humid low montane forest (bmh-MB) life zone, at an altitude of 2,530-2,640 m, average annual temperature of 16.6 °C, and average annual precipitation of 2,950 mm. It has a total area of 139.3 ha and geographical coordinates 6°12'25" north latitude and 75°30'08" west longitude. The main land use is intensive dairy farming under the rotational grazing model in meadows with steep slopes, gentle hills and small plateaus dominated by kikuyu grass (Cenchrus clandestinus).
A 0.5-hectare paddock was selected, which is part of the dairy cattle strip rotation system in which 20 Holstein cows between 525±43.3 kg of liveweight grazed. They entered the paddock every 40 days to consume the forage, interacting with the physical and chemical properties of the soil through trampling and the deposition of urine and excretion.
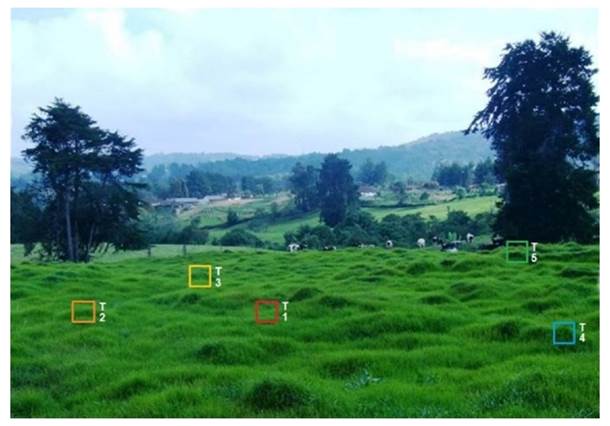
Afterward, 25 plots of 1 m2 dominated by kikuyu grass were selected. For this purpose, a scale was used according to forage yield from 1 to 5, with 5 being those sites with the highest production and 1 being those with the least forage biomass. These plots were used to establish five treatments (T1: low; T2: medium-low; T3: medium; T4: medium-high; T5: high) (Figure 2). At each site, a set of physical and chemical variables was evaluated and their relationship with DM production was quantified. Each variable was measured at the Soil Laboratory of Universidad Nacional de Colombia, Medellin Headquarters, except for penetration resistance and forage production. The first was measured in the field at a depth of 10 cm, and the second was cut one day before the animals entered.
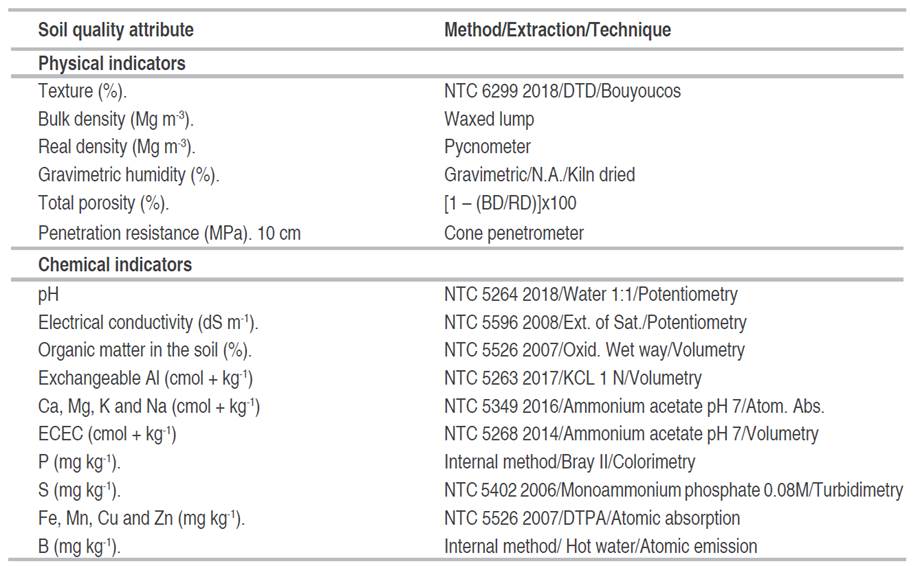
Methods and techniques for assessing soil quality indicators
The methods and techniques are described in Table 1.
RESULTS AND DISCUSSION
Descriptive statistics
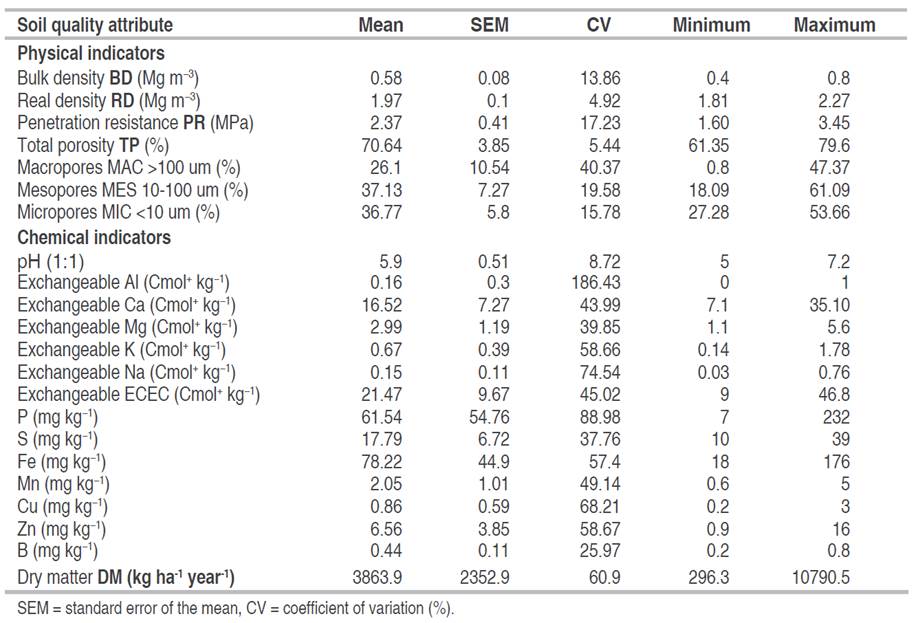
Descriptive statistics of soil quality indicator values are summarized in Table 2.
The bulk density fluctuated from 0.4 to 0.8 Mg m−3, which is consistent with that reported in Andisols with a predominance of allophane in the clay complex considered by the taxonomy for this order of soils (<0.9 Mg m−3) (Soil Survey Staff 2022). Furthermore, they have high porosity, increased by particularly high soil water retention (Hewitt et al. 2021). However, cattle trampling commonly alters this variable. The penetration resistance presented values of 1.6-3.4 MPa, close to 2 MPa, i.e., the critical limit proposed by Barbosa (2019), over which root growth can be restricted. The porosity ranged from 61.4 to 79.6%, which is reportedly high for Andisols. This high porosity is related to a structural assemblage of poorly crystalline and non-crystalline secondary minerals into stable (sand- and silt-sized) aggregates. Allophanic and non-allophanic Andisols can accumulate large amounts of organic matter. However, non-allophanic andisols also form highly porous aggregates and have a high-water retention capacity (Delmelle et al. 2015). Gravimetric moisture retention ranged from 119.9 to 199.8% between saturation and 15 bar (Table 2).
The pH value fluctuated between 5.0 and 7.2 and was within the recommendations for many grasses, including kikuyu. However, according to Läuchli (2017), acidic soils (pH<5.5) and alkaline soils (pH>7.5) fall outside the optimal pH range and can generate low nutrient availability, ionic toxicities and nutritional imbalances. The values of Ca, Mg, and K (Table 2) exceeded the required ranges in pastures according to Rodelo-Torrente et al. (2022); especially K, which can become a problem in bovine productivity (Swanepoel et al. 2014). Although phosphate retention values of ≥25% or ≥85% are common in Andisols (Soil Survey Staff 2022), P and S sufficiency was found due to the continuous input of chemical fertilizers. Sufficiency was established according to the ranges proposed by Siatwiinda et al. (2024) and Hazelton and Murphy (2016). The ECEC fluctuated from 9.0 to 46.8 cmol kg−1, with an average of 21.47 cmol kg−1 (considered high), where the Ca made the greatest contribution, and the Ca/Mg ratio was 5.5 on average. Regarding minor elements, only Cu (0.86 mg kg−1) presented deficiency according to the theoretical optimum suggested by Siatwiinda et al. (2024). In parallel, a high average soil organic matter was found (SOM=17.49%), which is typical of Andisols with <25% organic carbon (Soil Survey Staff 2022). This high content of surface organic matter is a consequence of the humid cold climate of the area and the formation of organometallic complexes that protect it from mineralization (Pérez et al. 2017). A high amount of organic matter can improve soil functionality, and its ability to provide essential ecosystem services and soil health (Lal 2020).
Correlations
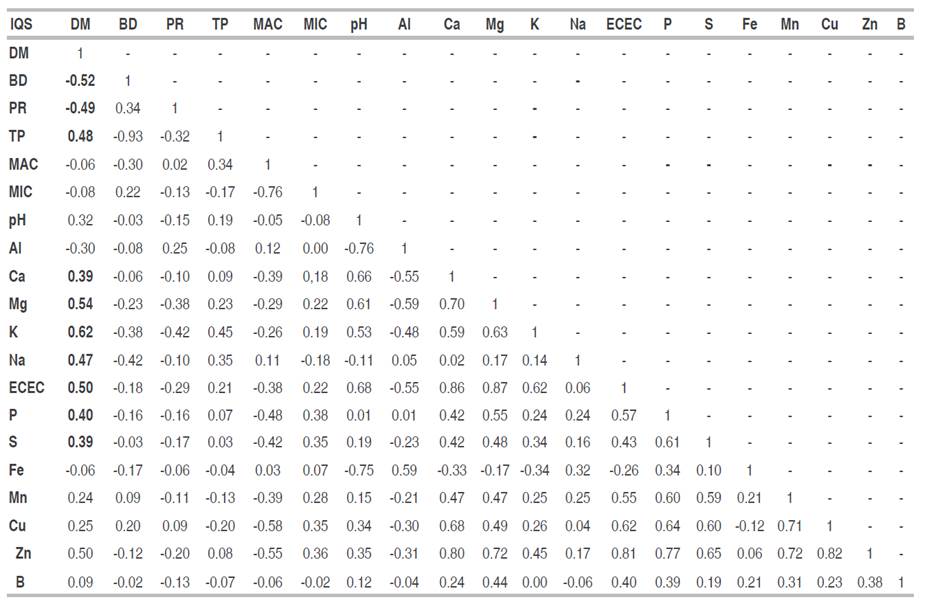
The correlation analysis between (physical and chemical) soil indicators and DM production showed that the variables with the highest positive correlation were K (0.62), Mg (0.54), ECEC (0.50), TP (0.48), Na (0.47) and Ca (0.39). In turn, those with the highest negative correlation were BD (-0.52) and PR (-0.49) (Table 3).
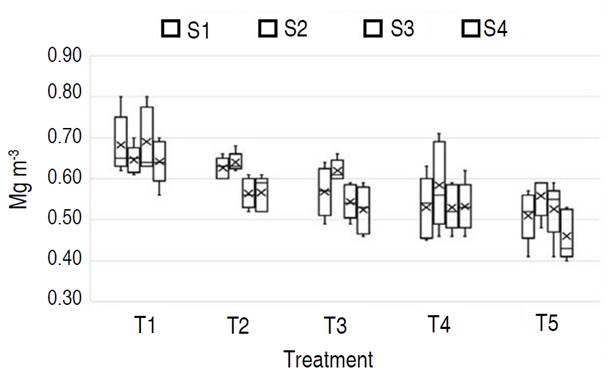
BD presented a negative correlation with DM productivity (-0.52). Therefore, the BD values in which the mean was higher, corresponded to the most mulched plots where DM production was lower (T1), and the opposite for T5. The results of the mean BD values for the treatments T1, T2, T3, T4, and T5 were 0.665, 0.599, 0.564, 0.544, and 0.514 Mg m-3, respectively (Figure 3).
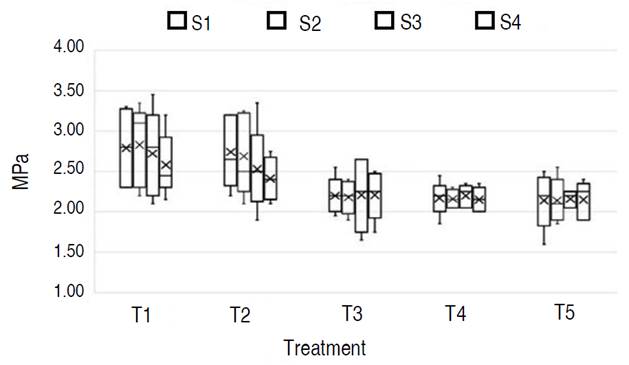
A negative correlation was found between PR and DM (-0.49). Therefore, higher mean PR values usually corresponded to treatments where biomass was lower (T1), and vice versa. Increases in PR explained 49% of the reduction in productivity (Figure 4). Additionally, a positive correlation was obtained between BD and PR (0.34). Consequently, soil compaction leads to reduced plant productivity, mainly due to poor root density, low elongation rates, and limited access to water and nutrients (Colombi and Keller 2019). This is because compaction produces low connectivity and continuity of the pore space, reducing the air and water transport capacity of the soil (Keller et al. 2017). Blanco-Sepúlveda et al. (2024) evaluated different physical properties of soils (bulk density, total porosity, field capacity, infiltration, and aggregate stability). They found that bulk density and infiltration are the most useful parameters to identify areas affected by cattle trampling and that bulk density is the key property for analyzing the impact of cattle with respect to increased stocking rates. They also concluded that the relationship between physical soil degradation and stocking rate is not linear because it also depends on environmental factors.
A value of 2 MPa has been estimated as the threshold that limits root growth when soil compaction is evaluated using a penetrometer (Barbosa 2019). In all the treatments (T1, T2, T3, T4, and T5), the mean values exceeded this limit (2.73, 2.59, 2.20, 2.17, and 2.15 MPa, respectively). High mean PR values corresponded, in general, to the treatments that produced less dry mass (T1) (Figure 4).
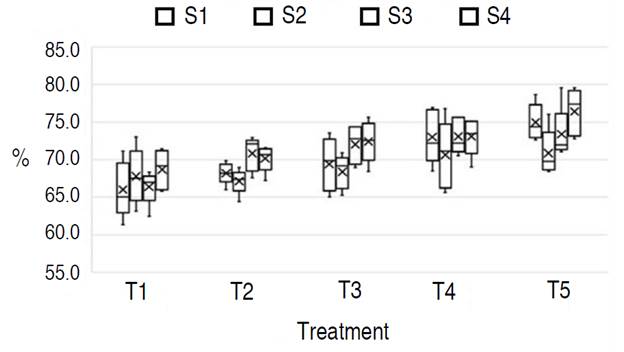
A positive correlation was obtained between TP and DM production (0.48). Therefore, increases in TP explained 48% of the increase in dry forage produced. The higher the TP, the higher the forage yield (Figure 5). The mean TP values (67.2, 69.1, 70.6, 72.5 and 73.9%) produced with treatments T1, T2, T3, T4 and T5, respectively, can be classified as high (Hazelton and Murphy 2016). But more important than the TP value is establishing the percentage of macropores, mesopores and micropores. Macropores presented the widest range (0.8-47.4%) compared to mesopores (18.1-61.1%) and micropores (27.3-53.7%). When the percentage of macropores was calculated, it was found that, in 10% of the cases, it was <10%. Rabot et al. (2018) discussed ideal percentages in the first 20 to 30 cm of depth: micropores: 20-30% (<0.2 μm), mesopores: 40-60% (0.2-50 μm) and macropores: 10-20% (>50 μm). Therefore, imbalances were observed in this study.
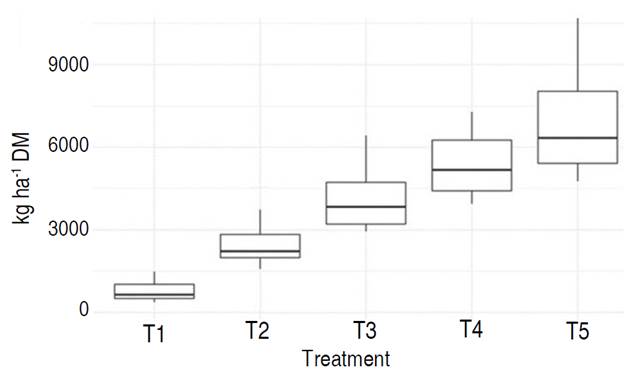
Using analysis of variance, the difference between treatments with respect to dry matter production was evaluated and found to be statistically significant (P-value: 1.911372x10⁻³²). Therefore, there is evidence to reject that they are equal. In this regard, the means were T1=790 kg; T2=2,468 kg; T3=4,005 kg; T4=5,264 kg and T5=6,792 kg. The grand mean was 3,863 kg in 40 days. Meanwhile, the total effects were T1= -3073.7 kg; T2= -1396.1 kg; T3=141.4 kg; T4=1399.9 kg, and T5= 2928.5 kg (Figure 6).
DM production was 35.3 tons ha-1 yr-1, which is below that achieved by Villalobos-Villalobos and WingChing-Jones (2023), who reached 42.4 tons of DM ha-1 yr-1, and above that reported by Gómez et al. (2014), who obtained 34.3 tons of DM ha-1 yr-1. However, it should be noted that the cutting or grazing cycles were every 40, 36 and 45 days, respectively. Therefore, the DM production ha-1 per cycle was 4,184 kg, which is above that obtained by Villalobos-Villalobos and WingChing-Jones (2023), who achieved 3,517 kg DM ha-1 per cycle and below that found by Gómez et al. (2014), who achieved 4,230 kg DM ha-1 per cycle. It is important to stress that the total dry matter production was obtained by multiplying the average production of each stratum by 20%, but, for greater precision, the percentage of participation of each stratum should be determined by estimating the botanical composition.
Selection of soil quality indicators for an MDS
An individual PCA was performed for physical and chemical properties. The selection criterion was PCs with an eigenvalue >1. This was met by the first two and three PCs of the physical and chemical properties, respectively, showing a cumulative variance percentage of 79.04 and 72.88%, respectively, as can be seen in Table 4.
Table 4 Eigenvalues, variance (%), and variance cumulative (%) explained by the principal components within each group.

Once the PCs were determined, those that presented the highest correlation coefficients (regardless of whether they were positive or negative) were preselected in each component. Therefore, TP was selected as the most representative physical indicator of the first PC; and MIC, for the second PC. Among the chemical indicators, the ECEC exhibited the highest coefficient for the first PC, Fe for the second PC, and Na for the third PC (Table 5). These indicators, despite being selected, can be discarded in the MDS.
Table 5 Eigenvectors, principal components (PC), and communality estimate of the physical and chemical indicators, ranked according to the magnitude of the vector within each group.
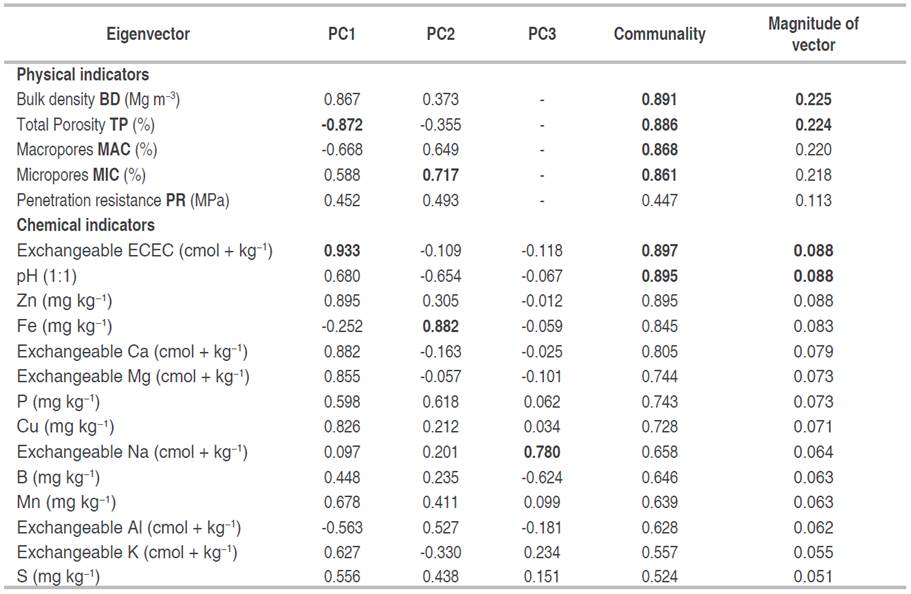
The indicators with the greatest magnitude within each group (BD and ECEC) were selected for the MDS. When these presented the same value, the one with the highest communality was chosen. A high communality indicates that a large part of the variance is explained by said component. Nevertheless, because they explain more than 79% of the variance in the physical variables, TP, MAC and MIC were also selected. In addition, pH was selected because it explains more than 72% of the variance in the chemical indicators (Table 4).
All these variables presented the highest magnitude and communality within each group. The previous selection was also based on the weight of the variables and using as a criterion that it be >10% (for that reason, PR was also chosen in the physical variables). Although none of the chemical variables reached that value, those closest to 10% were selected (Table 6).
Scoring the selected indicators
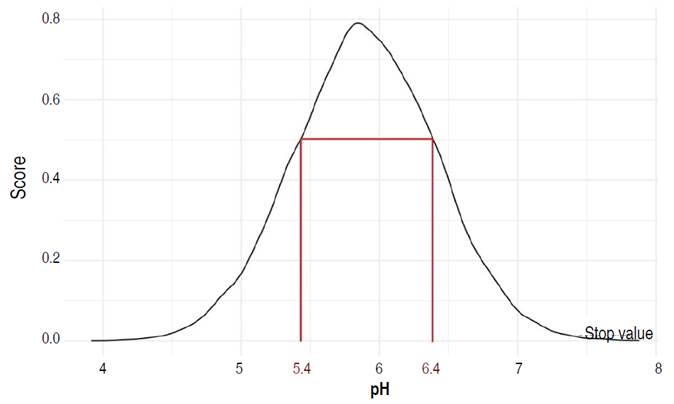
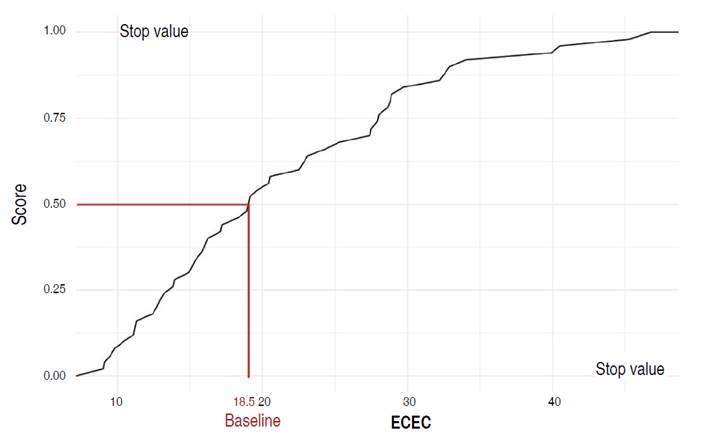
Nonlinear scoring functions were used to transform the soil properties in the MDS to values between 0 and 1 (Figure 7). "Less is better" functions were used for scoring BD and PR; "more is better" functions for ECEC; and the "mid-point optimum" function for TP, MAC, MIC, and pH.
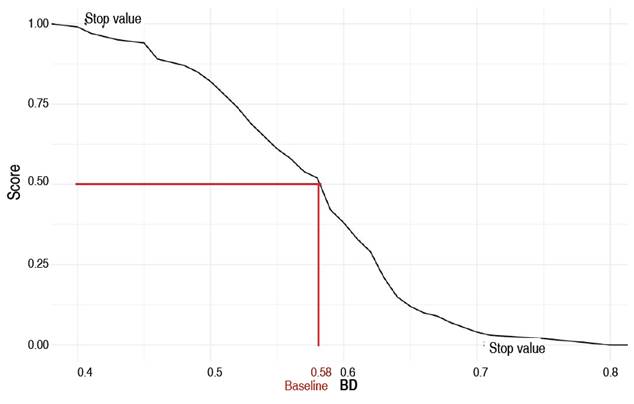
BD was represented using a decreasing score curve (less is better). Therefore, a BD of 0.4 Mg m-3 presented a higher score than a BD of 0.8 Mg m-3. The cumulative normal distribution of BD shows that most data fell in the range 0.4-0.6 Mg m-3 (explaining a high probability of occurrence), while 0.7 Mg m-3 is already very close to the lower asymptote (Figure 8). However, by determining the baseline, it can be established that a BD above 0.58 Mg m-3 is related to scores below 0.5, which is undesirable with respect to production. Therefore, the best scores are observed at a BD below 0.58 Mg m-3 down to 0.40 Mg m-3, where they stabilize and reach a constant value, favoring dry matter productivity.
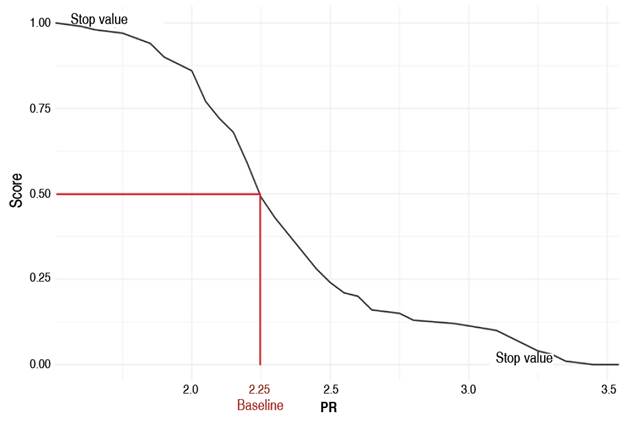
Likewise, PR presented a decreasing score curve (less is better). The cumulative normal distribution of PR indicates that most data have a high probability of falling between 2.0 and 3.5 kPa, which is undesirable (Figure 9). Furthermore, by determining the baseline, it can be established that a PR above 2.25 kPa is related to scores below 0.5, which is also undesirable with respect to production. On the one hand, the best PR scores are observed below 2.25 kPa, which favors dry biomass productivity. On the other hand, values greater than the optimum impair the productivity and functions of the soil.
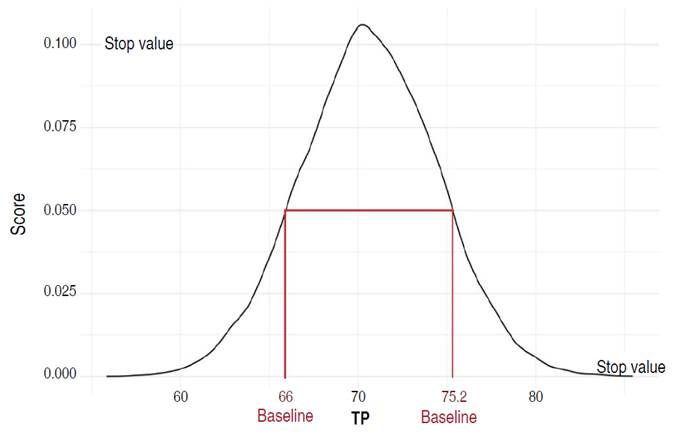
TP and pH presented optimal plateau score curves (Figures 10 and 11). Regarding the former, a TP of approximately 70% presented the highest score. The cumulative normal distribution of TP shows that most pores are in the 66-75.2% range and that values less than 60% and greater than 80% have a very low probability of occurrence and may be undesirable (Figure 10). Nevertheless, a proper distribution between MAC and MIC is no less important. Similarly, pH exhibited an optimal plateau, indicating a high probability of values close to 5.8, which favors forage production. It was found that the most favorable pH range is between 5.4 and 6.4 (Figure 11).
ECEC presented a "more is better" scoring curve, showing a higher probability of occurrence for values above 18.5 (Figure 12). If the ECEC is above 18.5, there is a score above 50%, which is desirable for the pasture. ECEC is especially favored by high concentrations of Ca.
A soil quality model/index
The data in the MDS were re-evaluated by PCA to obtain vector magnitudes for all the soil components. These values were used to calculate the weights of the different soil quality indicators. As a result (Table 6), a soil quality index (SQI) was obtained (Equation 1). The weight of the indicators ranged between 8.7 and 22.5%, while the variables BD, TP, and MAC contributed the most to the model, with 22.5, 22.4, and 22.0%, respectively.
Swanepoel et al. (2014), who studied kikuyu and ryegrass pastures in South Africa, evaluated an MDS using PCA and obtained the magnitudes of the soil components, which they used to select the PCs with the highest weight. When they determined the SQI, they found that gravel (16%), moisture retention capacity (15%), and PR (13%) were the most relevant physical indicators; P (17%) and Mn (12%) were the most important chemical indicators; and SOM (13%) was the most influential biological indicator. Thus, the only variable in common between their study and this investigation was PR (13 vs 11.3%). On the other hand, Sharma et al. (2014) evaluated Pennisetum americanum grass and found the key soil quality indicators and their contributions to the SQI: organic carbon (19%), available N (20%), exchangeable Ca (3%), available Zn (4%) and Cu (17%), labile carbon (20%), and mean weight diameter of soil aggregates (17%).
It was found that the physical variables presented the greatest contribution to the SQI compared to their chemical counterparts, and a more marked trend was observed when the index was determined separately. The physical variables showed a decreasing trend, contrary to the chemical properties, which exhibited high sufficiency values. However, no determining correlation was found between the total SQI and the forage yield of the crop.
CONCLUSION
A Soil Quality Index (SQI) was established as a baseline for assessing the degradation and forage yield of kikuyu grass at the Paysandú Agricultural Station. This index can also be used as a reference for similar studies in the high Andean tropics of Colombia. Principal Component Analysis (PCA) facilitated the identification of key indicators that are most influential in the soil quality of kikuyu grasslands, and it was used to develop the SQI. The most sensitive indicators identified here were bulk density (BD)>total porosity (TP)>macropores (MAC)>micropores (MIC)>penetration resistance (PR)>effective cation exchange capacity (ECEC)>pH. The SQI was calculated using Equation (1): SQI = (0.225×BD) + (0.224×TP) + (0.220×MAC) + (0.218×MIC) + (0.113×PR) + (0.0879×ECEC) + (0.0877×pH).
The physical variables were found to contribute more significantly to the SQI than their chemical counterparts. This index offers a valuable tool for preventing grassland degradation because it is based on the most sensitive indicators and provides guidance for effective management. These findings can serve as a reference for establishing SQIs at a regional level in the municipalities in the dairy belt of eastern and northern Antioquia.
For bulk density (BD), the baseline threshold is critical at values exceeding 0.58 Mg m-3. For penetration resistance (PR), the baseline threshold is critical at values greater than 2.25 MPa. Additionally, the optimal pH range for the development of kikuyu grass is between 5.4 and 6.4.


