Aggarwal (2004) explains that every object possesses a distinct spectral response, which is determined by the energy reflected or emitted at different wavelengths. In the realm of remote sensing, artificial sensors capture radiation within specific contiguous bands and convert it into either multi or hyperspectral images, or numerical data that can be processed using computers. Through digital manipulation of this information, reflectance curves or spectral signatures can be generated, which have found widespread application in local and regional vegetation studies.
Remote sensing involves the use of aerial and satellite sensors to capture images of the Earth's surface, and these images can have different spectral resolutions, such as multi or hyperspectral (Nalepa 2021). On the other hand, spectroradiometry is a field within remote sensing that utilizes portable devices known as spectroradiometers. These instruments can measure the radiant energy flux at the surface of objects, specifically focusing on leaf samples in this particular investigation.
In tropical regions, the majority of spectral investigations have primarily focused on analyzing the canopy level through the processing of aerial and satellite imagery. This approach is driven by the complex structure and diversity of tropical forests, which present challenges in acquiring and analyzing spectral data at the leaf level. Consequently, remote sensing emerges as a valuable tool for gathering information in these ecosystems, offering advantages in terms of efficiency and cost-effectiveness compared to direct data collection methods.
Spectral investigations conducted at the leaf level using the spectroradiometry technique find greater applicability in extratropical forests. These ecosystems exhibit a higher degree of species homogeneity, making fieldwork for capturing spectral readings more feasible. Additionally, the measuring instrument used typically possesses a high spectral resolution, enabling precise quantification of even minor variations in reflectance across the electromagnetic spectrum (O'Shaughnessy and Rush 2014). This enhanced spectral resolution significantly enhances the predictive capabilities during data analysis.
In recent years, spectroradiometry has found applications in various areas such as species identification, phenology tracking, and monitoring the phytosanitary status of vegetation (Clark et al. 2005; Clark and Roberts 2012; Lu et al. 2017). Most of these studies have been conducted in the Americas, Southeast Asia, and the western fringe of Europe. Spectral signatures have been documented in the tropical dry forest for species such as Diomate (Astronium graveolens), Cedro Rojo (Cedrela odorata), Ceiba (Ceiba pentandra), Nogal Cafetero (Cordia alliodora), Algarrobo (Hymenaea courbaril), and Caoba (Swietenia macrophylla). In the tropical rainforest, species like Caucho (Castilla elastica), Choibá (Dipteryx oleifera), Olla de Mono (Lecythis ampla), Surá (Terminalia oblonga) and Suribio (Zygia longifolia) have been studied. Genera such as Quercus, Pinus, and Acer have been investigated in temperate forests. Spectral studies have also focused on the Rhizophoraceae family in the mangrove ecosystem (Clark and Roberts 2012; Papeş et al. 2013; Prasad and Gnanappazham 2014; Ferreira et al. 2016; Miyoshi et al. 2020).
The tropical ecosystem is recognized as a significant source of species with valuable characteristics such as hardness, strength, and durability, making them highly sought after in both the market and scientific communities, leading to numerous studies focusing on the spectral characterization of leaves and wood. However, the findings reported so far lack generalizability due to the adoption of different methodologies (Clark and Roberts 2012), limiting comparisons with other studies (Rasaiah et al. 2014). It is important to research the spectral behavior of plant species at different phenological stages, particularly in the case of D. oleifera, and to explore data processing techniques, especially supervised classification with K-nearest neighbors, which have been underutilized in spectroradiometry.
This study aims to analyze the leaf spectra of three timber forest species (A. graveolens, H. courbaril, and D. oleifera) native to tropical dry forests using spectroradiometry, a technique commonly applied in ecosystems with higher homogeneity. The study had the following specific aims: a) to examine the spectral characterization of leaf samples using spectroradiometry, b) to identify the narrow bands that exhibit the best discriminatory power for distinguishing between the species, c) to evaluate the spectral discrimination ability of the species in the selected narrow bands. The hypothesis evaluated in this research is that spectroradiometry is a reliable technique for separating and classifying leaves from different forest species.
MATERIALS AND METHODS
Study area
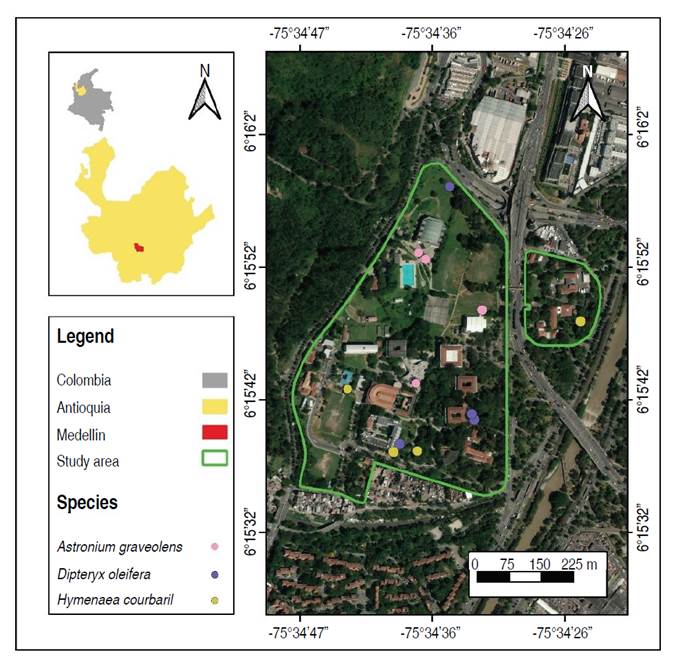
The research was conducted at the León Morales Soto Arboretum and Palmetum of the Universidad Nacional de Colombia, located in Medellín, Antioquia, Colombia (Figure 1). The study area climate is characterized by a mean annual air temperature of 19 °C and a mean annual precipitation of 1,752 mm (IDEAM 2010). These climatic conditions classify the area as belonging to the Premontane Rainforest (bh-PM) life zone, according to the Holdridge classification system.
Selection of forest species
A literature review was conducted to identify tropical timber tree species that have undergone spectral analysis. The studies indicate that sample size varies depending on the number of available individuals at each site, such as at the Arboretum and Palmetum León Morales Soto, where, despite species diversity, the collection has a limited number of individuals. Sample size recommendations range from one to five individuals per species and from 3 to 15 leaves per tree (Castro-Esau et al. 2006; Féret and Asner 2011). Based on this review, four individuals per species and three leaves per tree were selected at the Universidad Nacional de Colombia, Medellín Headquarters. The selected species are listed in Table 1.
Table 1 List of forest species with their abbreviations, identification codes in the León Morales Soto Arboretum and Palmetum, common names, scientific names, and references consulted.

Diomate (A. graveolens) is a forest species belonging to the Anacardiaceae family (Figure 2A). It is characterized by compound, alternate, imparipinnate leaves that are arranged spirally. The leaves are composed of 11 to 15 lanceolate, acuminate, and serrate leaflets (Gómez and Toro 2008). According to the IUCN Red List, Diomate holds a classification of Least Concern (LC) (Machuca et al. 2022) and plays a vital role in the ecological restoration of the tropical dry forest in Colombia.
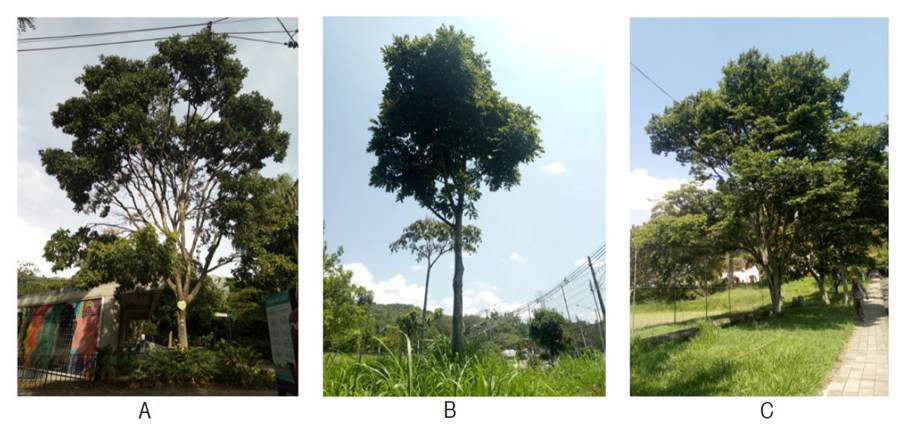
Figure 2 Forest species selected for foliar sampling: A) A. graveolens, B) D. oleifera, and C) H. courbaril.
Choibá (D. oleifera) is a member of the Fabaceae family (Figure 2B) and is characterized by compound, alternate, imparipinnate leaves. The petiole is smooth, winged, and grooved, while the rachis is winged and bears 4-8 pairs of elliptic leaflets (Cogollo et al. 2004).
Choibá is classified as a Vulnerable Species (VU) in the Colombian Red Book of Plants (Cárdenas and Salinas 2007). On the other hand, Algarrobo (H. courbaril) is a forest species belonging to the Fabaceae family (Figure 2C). It exhibits compound, alternate, and paripinnate leaves, with a pair of elliptical leaflets 3-12 cm long and 1.5-7 cm wide (Gómez and Toro 2008). According to the IUCN Red List, Algarrobo is classified as Least Concern (LC) (Bachman 2023) and plays a crucial role in the restoration of the tropical dry forest in Colombia.
Foliar sampling
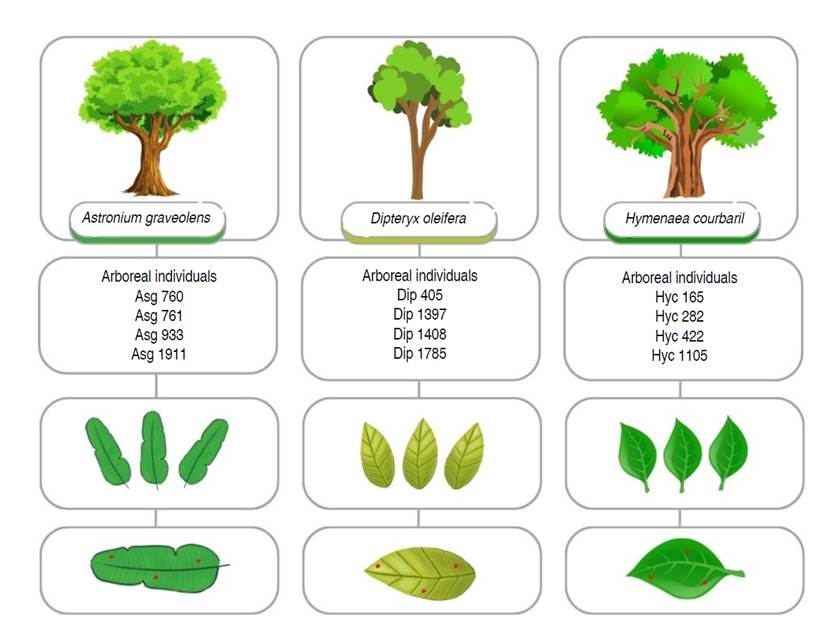
In this study, a total of four individuals from each of the three tree species were selected. Branches were extracted from the middle third of the canopy of each tree, specifically, those directly exposed to solar radiation. A minimum of three leaflets were collected from these branches to capture the spectral reflectance data (Figure 3).
The collected leaves were carefully wiped with gauze, and then placed in moist cotton and polyester towels. They were subsequently stored in labeled polyethylene bags, with each bag bearing the abbreviation and code corresponding to the respective arboreal individual. The leaves were stored in these bags for approximately 2 h, until the leaf sampling was completed. Subsequently, the spectral measurements of the three species were taken in situ under uniform conditions.
Spectral measurements
The spectroradiometer used in this study was the ASD FieldSpec HandHeld-2, a portable device that employs firmware for internal hardware management and desktop software for configuring data recording and processing. This instrument offers a high spectral resolution of 3 nm (interpolated to 1 nm) and a minimum scan time of 17 ms. Used to capture spectral signatures in the ultraviolet (UV) and near-infrared (NIR) regions, covering a wavelength range from 325 nm to 1,075 nm.
The approximate size of the leaves, excluding the petiole, ranged from 8 to 20 cm in length. For this reason, a field of view (FOV) of approximately 14 cm in diameter was chosen by placing the sensor with a 25° optic at a distance of 30 cm from the nadir. In this way, the influence of surrounding materials on the spectral measurements of the leaves was reduced.
To ensure accuracy and account for any potential variation in solar radiation, the data were collected within a ±30 min interval from solar noon. Three points on each leaf were scanned, evenly distributed, and perpendicular to the main rib of the leaf blade (Figure 3). For this purpose, a field spectroradiometer was used, calibrated every 15 min using the spectral signature of a 3.6” reference white panel, which exhibits nearly 100% reflectance across the electromagnetic spectrum.
The spectral signatures were collected on clear days in April when solar elevation angles ranged between 87 and 89°, which minimized the effects of atmospheric conditions and variations in the sun's position. To reduce the influence of external factors, a matte black plastic material was utilized to absorb direct solar radiation from the wavelengths of the visible and near-infrared spectrum.
It is highlighted that the D. oleifera samples were in an early stage of senescence in April, which could have influenced their spectral characteristics. The senescence process can affect the cellular structure and chemical composition of leaves, altering their ability to reflect energy at different wavelengths. To ensure the validity of the comparison, spectral samples were collected under standardized conditions, and potential influences of the senescence state were considered in the analysis.
Spectral characterization
The spectral records (a total of 36 records per species) were processed using spectral interpretation software. This software allowed for the calculation of the mean and standard deviation of these records. Subsequently, spectral signatures were plotted using the ggplot2 package in RStudio 1.1.463, covering a wavelength range between 400 and 900 nm of the electromagnetic spectrum.
Extraction of optimal spectral bands
Considering previous research on the similarity in reflectance between contiguous bands and the advantages of using narrow bands, this study reduced the dataset by applying a simple averaging function every 10 nm. Originally, the data were distributed at 1 nm intervals between 400 and 900 nm. To obtain narrowbands every 10 nm, wavelengths were grouped into 10 nm ranges (for example, from 400 to 410 nm, from 410 to 420 nm, and so on). Within each of these ranges, the reflectance data were averaged to obtain the mean value of the corresponding narrowband, ranging from 405 to 895 nm. This process resulted in a reduced dataset where each narrowband represents an average reflectance within a specific wavelength interval.
To determine the appropriate statistical analysis for each species's reflectance patterns, an initial assessment of distribution normality and variance homogeneity was conducted. For datasets exhibiting normal distribution and homoscedasticity, analysis of variance (ANOVA) was applied. Conversely, datasets that showed deviation from normal distribution were subjected to the Mann-Whitney-Wilcoxon U Test. The statistical analyses were conducted using the base package in RStudio 1.1.463 software.
ANOVA is a statistical method used to assess the equality of population means. Specifically, a one-factor ANOVA is employed, which involves utilizing a single characteristic, referred to as the treatment or factor, to categorize the populations (Triola 2009). The primary aim of this test is to evaluate the null hypothesis, which states that the population means of the two groups of reflectance values are equal (Equation 1). This null hypothesis is then compared against the alternative hypothesis, which suggests a significant difference between the two population means (Equation 2).
Where θsp is the mean reflectance of each tree species to be compared in each spectral band.
The test statistic used by ANOVA has a Snedecor F distribution (Equation 3). According to Triola (2009), the numerator of the F-statistic measures the variance between sample means and the denominator of the F-statistic depends on the variability within the simples 
Where SCR is the sum of squares of the regression, SCE is the sum of squares of the residuals, n is the number of observations in the sample and k is the degrees of freedom.
The Mann-Whitney U test assesses whether two populations have different means or medians, especially with non-normal data (Yue and Wang 2002). The null hypothesis proposes that the means or medians are equal (Equation 1), while the alternative suggests they are different (Equation 2).
To conduct the Mann-Whitney U test, the two samples are merged, and the observations are arranged in ascending order from lowest to highest (Equation 4). According to Yue and Wang (2002), the U-test statistic can be computed using the following Equation:
Where n1 and n2 are the sizes of the two samples, and R1 and R2 correspond to the sum of each of the samples.
Species discrimination algorithm
The supervised K-nearest neighbor (K-NN) classification method was employed on the dataset consisting of 108 records, which represents the total spectral records obtained from the combination of three points on every leaf, three leaflets, four individuals, and three forest species. These data were extracted from narrow bands that exhibited statistically significant differences (P<0.05) across all combinations of forest species. In this analysis, 70% of the data (76 records) were randomly selected as the training set, while the remaining 30% (32 records) were used for testing. The class package in RStudio 1.1.463 was utilized for data processing.
The K-NN (K-nearest neighbors) algorithm estimates the value of an unknown point based on similarity with neighboring points (Cover and Hart 1967). In this approach, the Euclidean distance between observations is calculated (Equation 5). According to Amat (2016), to ensure accurate estimates, it is necessary to normalize predictor values when their scales differ, as shown in Equation (6).
Where d is the Euclidean distance between the points xi and xj evaluated at the r-th input feature, max(xr) and min(xr) are the maximum and minimum values observed in the training set of xr.
The K-nearest neighbor (K-NN) classification method classifies objects based on the number of neighboring observations, denoted as K. In this study, K is set to one, meaning that the category of an object is determined by the value of its nearest neighbor.
RESULTS AND DISCUSSION
Spectral signatures
Figure 4 displays the average leaf spectral signatures ± standard deviation (S.D) of the forest species Diomate, Choibá, and Algarrobo within the wavelength range of 400 to 900 nm. This range corresponds to the visible (VIS, 400-700 nm) and near-infrared (NIR, 700-900 nm) regions of the electromagnetic spectrum.
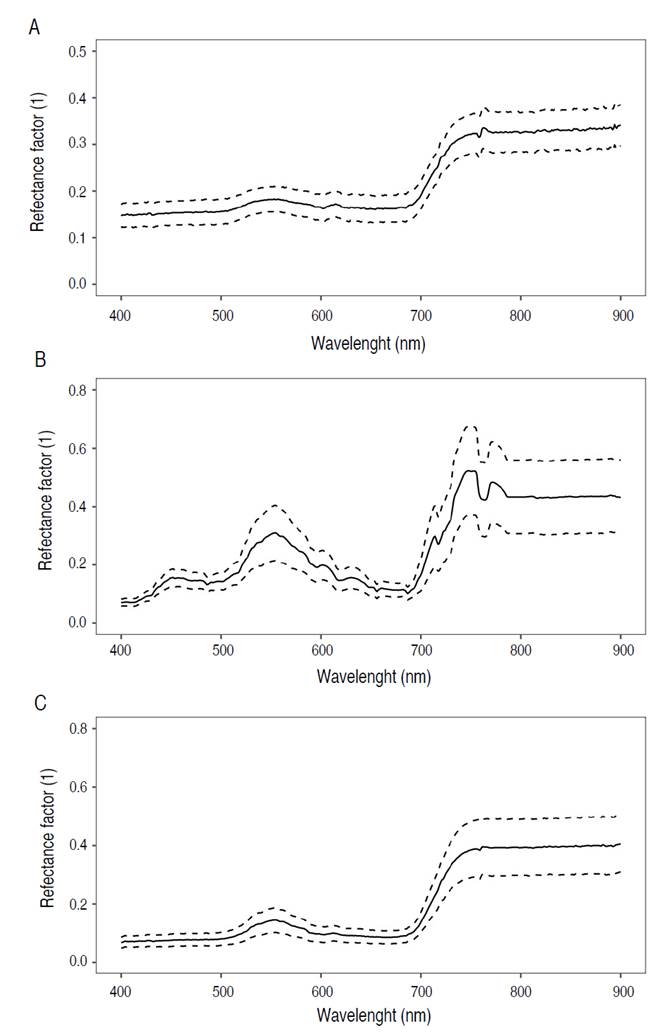
Figure 4 Leaf spectral signatures of mean reflectance (solid line) and standard deviation (±S. D, dotted line) of A) A. graveolens, B) D. oleifera, and C) H. courbaril.
Figure 4 presents the spectral characteristics of forest species, illustrating a distinctive pattern of low reflectance in the visible (VIS) range and high reflectance in the near-infrared (NIR) range. The spectral signatures showed an increase in reflectance within the green region (500-600 nm), peaking around the 555 nm band with average reflectance ranging from 14 to 31%. Additionally, there was a notable rise in reflectance from the visible (VIS) to the near-infrared (NIR) range, especially within the red edge position (REP) segment (680-730 nm), ranging from 9 to 16% at 680 nm and from 14 to 19% at 730 nm. In contrast, reflectance remained consistently high in the NIR range (730-900 nm) and tended to stabilize at longer wavelengths.
The spectral signature of A. graveolens (Figure 4A) showed low reflectance (<15%) in the ranges of 400-500 nm and 600-680 nm. The highest reflectance was observed in the visible region of the electromagnetic spectrum, specifically around the 553 nm band (18±3%). Reflectance sharply increased from the 685 nm band (16±3%) onwards, reaching its maximum in the near-infrared (NIR) region at the 765 nm band (34±4%), followed by a relatively stable trend.
The spectral signature of D. oleifera (Figure 4B) exhibited the highest average reflectance values among the three species. Reflectance in the 430-500 nm range was notably high and gradually increased until reaching its peak at the 554 nm band (31±10%). Subsequently, there was a significant decrease in reflectance until the 687 nm band (10±2%). In the red edge position (REP) segment (687-730 nm), reflectance showed an increasing trend with considerable variability before stabilizing at longer wavelengths.
The leaf spectrum of H. courbaril (Figure 4C) exhibited less variability in the visible (VIS) region compared to the other species. Reflectance in the 400-500 nm segment was low (<9%). It reached its maximum in the green region, specifically in the 554 nm band (14±4%). It then showed a gradual increase in the 682 nm band and reached its peak in the near-infrared (NIR) region, specifically in the 755 nm band (39±10%). From there, reflectance remained relatively constant until the 900 nm band.
The results show a notable difference in average reflectance between the visible and near-infrared spectra of D. oleifera leaves compared to H. courbaril and A. graveolens. This variation is due to D. oleifera being in an early senescence stage in April when spectral records were taken. During this phase, deciduous trees typically exhibit changes in reflectance spectra, such as increases in the visible spectrum and decrease in the near-infrared spectrum (Clark et al. 2005). However, there have been no specific studies on the spectral variability of D. oleifera across different phenological stages.
H. courbaril and A. graveolens exhibited typical spectral signatures of healthy vegetation, characterized by low reflectance in the visible spectrum and high reflectance in the near-infrared spectrum. Despite a notable increase in reflectance from the red edge to the near-infrared, previous research confirms that H. courbaril and A. graveolens maintain low reflectance in the visible and near-infrared spectra (Papeş et al. 2013; Ferreira et al. 2016; Miyoshi et al. 2020). These findings highlight the consistency in the spectral response of these plant species, suggesting that low reflectance in the visible and the near-infrared are useful distinctive characteristics for the identification and characterization of H. courbaril and A. graveolens.
The study showed minimal variation in reflectance for H. courbaril and A. graveolens compared to the spectral signatures reported for the tropical dry forest (Papeş et al. 2013; Ferreira et al. 2016; Miyoshi et al. 2020). It is important to note that the life zone, which includes environmental factors such as rainfall and temperature, influences the spectral response of species and physiological stress. However, in this experiment, the impact of this variable was not significant, as the spectral signatures obtained in the premontane rainforest were similar to those of the tropical dry forest.
Spectral separability
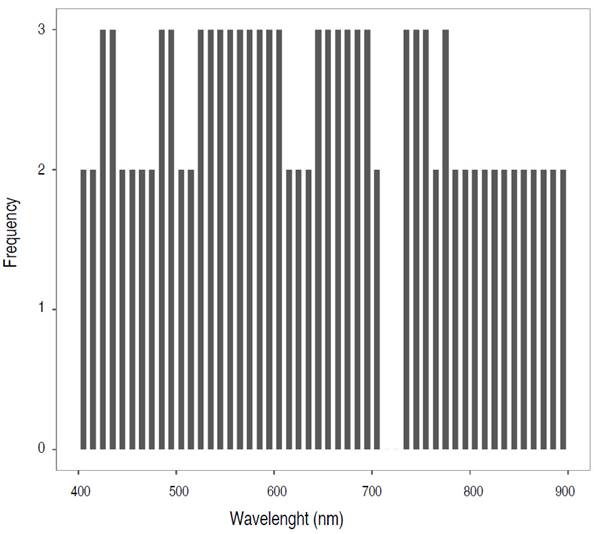
Figure 5 shows the number of species pairs that can be distinguished from each other (Asg vs Dip, Asg vs Hyc, and Dip vs Hyc). Significant differences were found in most spectral bands among all species pairs, except for the bands centered at 715 and 725 nm, corresponding to the red edge position (REP). The analysis revealed that 23 narrow bands effectively classified all species combinations, 25 narrow bands differentiated between two pairs of species, and only two narrow bands were able to distinguish one or fewer pairs of species.
Table 2 shows the optimal narrow bands for distinguishing plant species. Within each pair of species, significant variations were observed across a range of 33 to 48 narrow bands, demonstrating statistically significant differences (P<0.05). Notably, when comparing A. graveolens to H. courbaril and A. graveolens to D. oleifera, over 38 bands in the visible and near-infrared spectrum proved to be distinguishing factors. However, in the case of D. oleifera and H. courbaril, the disparity was limited to 33 bands primarily within the visible range.
Table 2 Potentially optimal narrow bands for the discrimination of each pair of plant species, identified using ANOVA and Mann-Whitney-Wilcoxon U test (P<0.05).
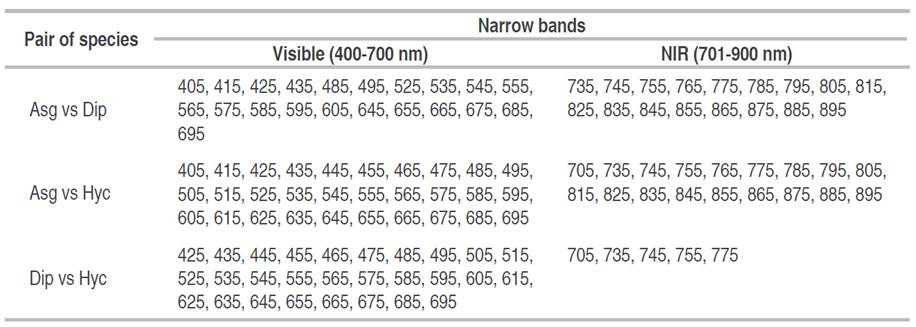
Table 2 indicates that A. graveolens and D. oleifera exhibited moderate separability in the electromagnetic spectrum, with 38 out of 50 (76%) significant narrow bands. This differentiation was observed consistently across both the visible and near-infrared spectra. In the case of A. graveolens and H. courbaril, their spectral reflectance diverges in almost all narrow bands, except for the bands centered at 715 and 725 nm in the near-infrared range, as indicated in Table 2. The analysis revealed a high level of separability between these species, with 48 out of 50 (96%) bands effectively distinguishing them.
On the other hand, the spectral signatures of D. oleifera and H. courbaril showed lower separability compared to the other species pairs, with a total of 33 out of 50 (66%) significant narrow bands (Table 2). Additionally, the differentiation between these two species is slightly more fragmented and is predominantly limited to the visible spectrum (425-695 nm). According to Table 2, the separability between A. graveolens and H. courbaril shows a broader range of significant narrow bands, achieving 96% spectral differentiation. In contrast, the separability between D. oleifera and H. courbaril, as well as between A. graveolens and D. oleifera, ranges from 66 to 76% of significant narrow bands. This pattern suggests that the early senescence stage of D. oleifera may have reduced the effectiveness of some narrow bands in distinguishing this species from others, affecting the overall interpretation of the spectral results.
Figure 6 shows the average reflectance curves and highlights the spectral regions (shaded areas) where the three pairs of species exhibit statistically significant differences. The analysis revealed that a total of 23 narrow bands contributed to the spectral separability of the three species. This study identified the most sensitive narrow bands for accurately identifying tree species, which were predominantly located in the blue (425, 435, 485, 495 nm), green (525, 535, 545, 555, 565, 575, 585, 595 nm), red (605, 645, 655, 665, 675, 685, 695 nm), and near-infrared (735, 745, 755, 775 nm) spectral regions.
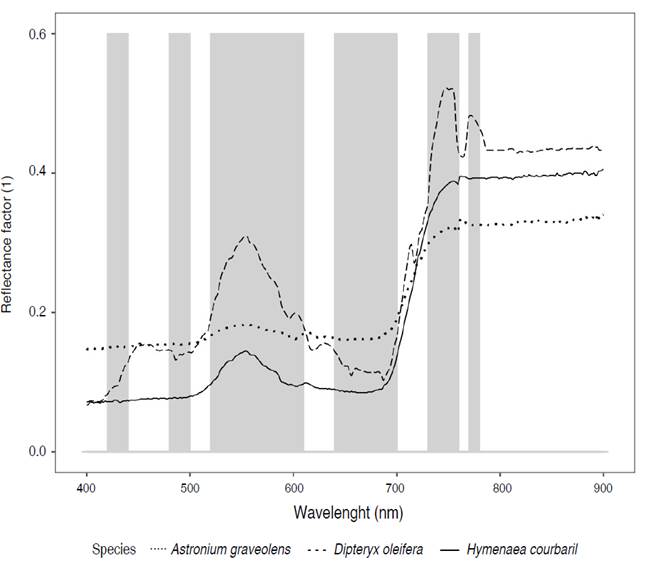
Figure 6 Distribution of the significant narrow bands (in gray) that best discriminate the three pairs of species, identified from ANOVA and the Mann Whitney - Wilcoxon U test, whose P<0.05.
In the study, five wavelengths matched the optimal bands recommended by Thenkabail et al. (2004) for 350 to 2,500 nm. Kumar et al. (2013) demonstrated the differentiation of tea plantations using bands in the blue, green, red, and near-infrared spectra. Zulfa et al. (2020) found that species in the Rhizophoraceae family were effectively discriminated against using the visible and mid-infrared spectra. These studies indicate that the best separation of plant species occurs in the green, red edge, and near-infrared regions. The presence of 14 out of the 23 selected bands in these segments highlights their importance for accurate discrimination.
Spectral discrimination
The spectral classification was performed on the 23 narrow bands that exhibited statistically significant differences. The results of the K-NN test are presented in Table 3, which shows the confusion matrix. The rows represent the true class, while the columns indicate the classifier output. The total count and the corresponding accuracy percentage are provided at the end of each row.
Table 3 Confusion matrix obtained from the supervised K-NN classification of the three forest species A. graveolens, D. oleifera, and H. courbaril.

Furthermore, out of the eight data samples for H. courbaril, the classifier accurately classified seven instances, resulting in an 88% effectiveness. On average, the accuracy across the test dataset reached 95.8%. These results highlight the exceptional accuracy achieved in discriminating between different species using the significant narrow bands.
Although KNN achieved perfect accuracy in identifying D. oleifera, differences during the early senescence stage of this species may have caused overlaps in the spectral signatures of other species. This overlap is reflected in the confusion matrix (Table 3), where the spectral signature of H. courbaril was incorrectly assigned to A. graveolens. This suggests that variations in the phenological state of the species can influence the model's accuracy, indicating the need to consider these factors to improve spectral differentiation between species.
In previous studies, Maxwell et al. (2018) used KNN to classify the Indian Pines dataset with an accuracy of 78.6 to 82.1%, which is lower than that of this study. In contrast, Castillo et al. (2008) achieved 100% accuracy when classifying Eucalyptus leaves using near-infrared spectroscopy, which is close to the 95.8% accuracy obtained in this study.
Research on the K-NN model in vegetation has tended to focus on disease detection and crop nutritional status, with a notable gap in its application for spectral discrimination of species in tropical forests. The K-NN model is valuable in this context for its ability to classify based on the spectral similarity between samples (Lu et al. 2017; Karadağ et al. 2020), which is particularly relevant in complex environments like tropical forests, where spectral variability is high and species differences are subtle.
The phenological state of D. oleifera, especially during the early senescence stages, is crucial for spectral data analysis. This phenomenon shows that the results are influenced both by the intrinsic characteristics of the species and its phenological state. Therefore, it is essential to consider this factor in future studies to improve the accuracy of classification and interpretation of spectral data.
This research suggests that spectroradiometry is highly useful for species classification, as it allows capturing fine details of leaf reflectance. Despite the challenges associated with the time and resources required for data acquisition in tropical environments, its application remains essential for advancing the understanding of biodiversity and the functioning of tropical ecosystems.
CONCLUSION
The findings suggest that the leaves of A. graveolens and H. courbaril were in good physiological condition since they exhibited a spectral pattern characterized by low reflectance in the visible spectrum and high reflectance in the near-infrared spectrum. However, the leaves of D. oleifera showed changes in their reflectance spectrum, as they were in the early stages of leaf senescence. At an interspecific level, significant variations in leaf reflectance were observed across different wavelengths, which were crucial for identifying specific narrow bands in the blue (425, 435, 485-495 nm), green (525-595 nm), red (605, 645-695 nm), and near-infrared (735-775 nm) regions. These bands proved ideal for the accurate classification of the studied species, as validated by the K-NN algorithm achieving a classification accuracy of 95.8%. For future studies, it is recommended to consider the phenology of species in the acquisition of spectral data. The study provides valuable information in the field of remote sensing by demonstrating the effective use of hyperspectral data to classify forest species and highlights the need to consider phenological states in spectral studies. These approaches have practical implications for biodiversity monitoring, conservation efforts, and ecological research in tropical forest environments.


