


 English (pdf)
 Article in xml format
 Article references
 Send this article by e-mail
 Cited by SciELO
  Cited by Google
  Similars in
SciELO
Similars in
SciELO  Similars in Google
 Permalink
INTRODUCTION
Quillaja saponaria Mol. (quillay) is a sclerophyllus evergreen native tree species with a widespread range across Chile. The species is an important source of industrial saponins (Pelah et al. 2002) and its extracts have been used in beverages, food, and in photography (Martín and Briones 1999), threatening the species due to habitat destruction and overexploitation (Benoit 1989, Squeo et al. 2001). The species distribution ranges from the arid northern part of the country (30° S) to the humid climates in the south (38° S). The altitudinal range is from 15 m in the coastal mountains to 1750 m in the Andes (Rodríguez et al. 2006, Cruz et al. 2013). In this extensive range of environments, it is expected that the species exhibit a wide range of leaf morphological variation according to the climate.
Evidence supports that leaf morphology variation has adaptive significance linked with climate (Peppe et al. 2011), especially with latitude, altitude, temperature, and rainfall (Ackerly et al. 2002, Byars et al. 2007, Mediavilla et al. 2012). However, the physiological ecology of Q. saponaria along a latitudinal gradient has received little attention. As leaves are considered important for plant production, changes of leaf morphology need to be further elucidated. In this study, we analyzed variation in leaf characteristics within and among Q. saponaria trees in natural populations adapted to different ecological conditions and investigated their relationship with precipitation, temperature, and aridity of provenance origin.
MATERIALS AND METHODS
Study stands
A total of 438 trees of Q. saponaria were sampled during summer between 2012 and 2013 from 85 stands with at least 30 trees per hectare each and located in northern, central, and central-southern regions of Chile (Fig. 1). Selected trees were growing in open areas and isolated from other trees. Climatic data for each of the 85 stands were extracted from the WORLDCLIM dataset (Hijmans et al. 2005). Annual precipitation and temperature records were used to create the De Martonne aridity index as P/T + 10 (De Martonne 1926), where P is precipitation in mm, and T the temperature in °C. After that, the spatial distribution of 85 Q. saponaria stands was built in QGIS software (QGIS Development Team c2018) using Jenks Natural Breaks optimization (Jenks 1967). This method calculates groupings of data values based on natural groups in the data distribution. Four distinct groups of populations, from Group 1 with dry habitat, to Group 4 with wet habitat, were recognized in different geographical and ecological conditions according to the De Martonne index (Fig. 1).
Assessment of leaf morphological traits
In each of the 85 stands we selected between three to 20 mature trees growing under similar conditions in the field. Trees in a stand were separated 50 m from each other. One branch located in the north cardinal compass direction (length from 20 to 40 cm) was taken from upper third of the canopy. The leaves in each branch were practically of the same age and only new leaves were collected each year. Samples were field-collected and herborized under a paper press for further laboratory analysis. Ten leaf characters related to the lamina, petiole, veins, and teeth were assessed on each leave (Fig. 2, Table 1) (Kremer et al. 2002, Bruschi et al. 2003, Ponton et al. 2004). We counted the total leaves on each branch and leaf characteristics were determined for « 30 leaves of each branch.
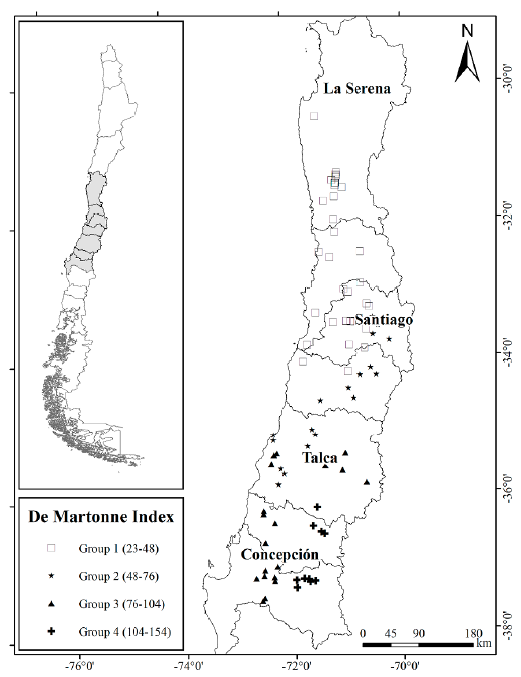
Figure 1 Spatial distribution for the 85 stands of Q. saponaria in four ecological groups according to the De Martonne index and using Jenks Natural Breaks optimization. Group 1 represents a dry habitat while Group 4 represents a wet habitat.
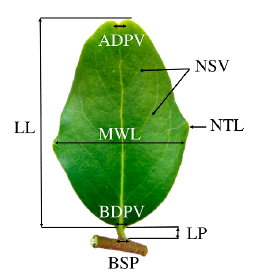
Figure 2 Leaf morphological traits measured in Q. saponaria. LL= Lamina length (mm); MWL= Maximal width of lamina (mm); LP= Length of petiole (mm); NSV= Number of secondary veins; BDPV= Basal diameter of the principal vein (mm); ADPV= Apical diameter of the principal vein (mm); NTL= Number of teeth per lamina; BSP= Basal diameter of petiole (mm).
Data analysis
Normality of distribution of characters was assessed for all variables. An analysis of variance (ANOVA) was performed following the model:

Table 1 List and description of the morphological characters examined.
| Variable abbreviation | Description |
|---|---|
| Primary variables | |
| LL (mm) | Lamina length |
| MWL (mm) | Maximal width of lamina |
| LP (mm) | Length of petiole |
| NSV (no) | Number of secondary veins |
| BDPV (mm) | Basal diameter of the principal vein |
| ADPV (mm) | Apical diameter of the principal vein |
| NTL (no) | Number of teeth per lamina |
| BSP (mm) | Basal diameter of petiole |
| Calculated variables | |
| RLP = LP/(LL+LP) (%) | Relative length of the petiole |
| RWL = MWL/LL (%) | Relative width of the lamina |
Table 2 F-value and significance level for the analyzed traits. Significance level (**P < 0.01, *P < 0.05, ns = non-significant). In parenthesis the percentage (%) of the total variance that was accounted for each level of the hierarchy.
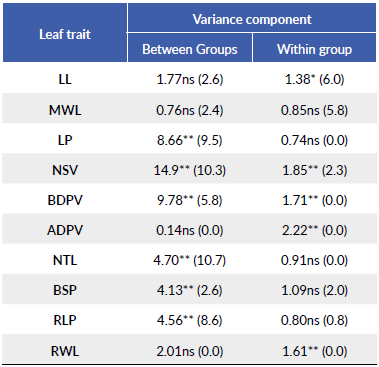
For acronyms, refer to Table 1.
where, Yijk is the observed leaf morphological trait, ц is the overall mean, Gi is the fixed effect of ith Jenks group (i.e., 1 to 4), T(G)ij is the random effect of the jth tree nested within the ith Jenks group, and is the experimental random error. Patterns of variation of each morphological trait were evaluated by comparing percent of total variance of the different m levels. Associations between leaf morphological traits and climatic variables were analyzed using the Pearson's correlation coefficient. In addition, a Principal Component Analysis (PCA) was carried with the aim to explore the relationship between leaf characters with the De Martonne aridity index.
RESULTS
Provenance differences in leaf morphology
Differences in leaf morphology attributed to the group effect were significant for 6o % of the morphological traits under study while differences due to trees within-groups were significant for half of the traits (Table 2). Group 4 (i.e., a wet site with the highest De Martonne index) exhibited the highest LP, NSV, BDPV, BSP, and RLP, while Group 1 (a dry site with the lowest De Martonne index), exhibited the opposite tendency in NSV and RLP (Table 3). With the exception of ADPV and RWL, total variance was higher in the among-group variation for most traits (i.e., variation at the group level), while the total variance due to within-group variation was higher only in LL and MWL.
Association between climate and leaf morphology
There was a positive but low correlation between BSP, NSV, and BDVP with De Martonne's index and MAP, while LP, BSP and RPL were negatively and poorly correlated with MAT (Fig. 3). The remnant leaf morphological traits exhibited no significant relationship with the climatic data (data not shown). The PCA indicates that the 87.4 % of the data variability is explained by PCl and PC2 (Fig. 4). NTL is more associated to dry climates with lower values of De Martonne index. At the right of biplot is observed a group of leaf characters negatively correlated with NTL. In this group LL, LP, BSP, BDPV, MWL, and NSV, are associated with wetter and colder environments.
DISCUSSION
The abiotic factors along environmental gradients affect leaf morphological properties (Hultine and Marshall 2000). In our study, several leaf morphological traits differed significantly among groups of populations of Q. saponaria and among trees within the same group, clearly demonstrating the high phenotypic diversity of the species (Cruz et al. 2013). We found that leaf morphological plasticity of Q. saponaria was related to the climatic variation in the species' distribution range. The results of the correlation analyses between climate and leaf morphology showed that BSP, NSV, and BDVP increased with increasing precipitation and decreasing aridity, whereas LP, BSP, and RPL decreased with increasing temperature. This suggests that populations of Q. saponaria at the dry edge of the species' distribution could have a resource-conservative stress tolerance strategy based on a restricted water transport driven by shorter petioles and thinner veins. In addition, leaf teeth; which are negatively correlated with temperature (Royer and Wilf 2006, Peppe et al. 2011), and are sites of increased transpiration in the leaf (Wolfe 1993), were not significantly correlated with MAT. However, trees in dry habitats had slightly higher NTL than trees in wet habitats, corroborating those trees in dry habitats have higher rates of transpiration (Royer and Wilf 2006) and water losses (Xu et al. 2009), which are driven by the higher transpiratory demands experienced in those sites. The PCA corroborates that bigger leaves are related with the south locations of the species, meanwhile smaller and serrated leaves are common at northern locations where it is necessary to use water more efficiently. Ramirez et al. (2020) and Ogaya and Peñueñas (2007) found that the sclerophyllous species Quercus lo-bata Nee and Quercus ilex L. exhibited a high plasticity of leaf morphology to climate variation as an adaptation to cope with environmental stress imposed in Mediterranean climates. In general, populations located at drier sites exhibited lower leaf areas.
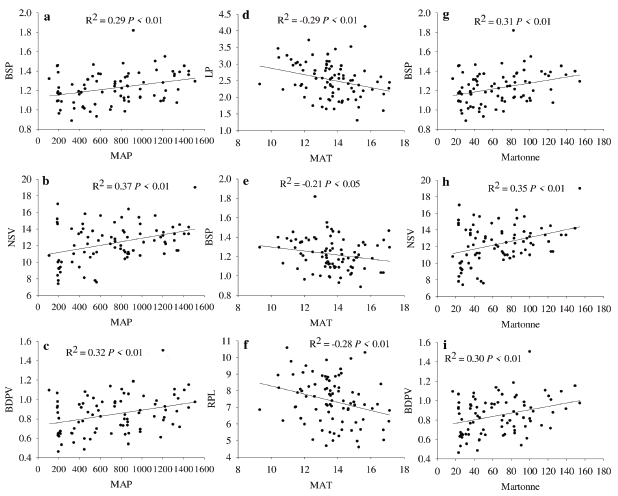
Figure 3 Pearson coefficient of correlations between leaf traits and the climatic variables mean annual precipitation (MAP, left panels a, b, c), mean annual temperature (MAT, center panels d, e, f), and the De Martonne index (right panels g, h, i). LP= Length of petiole; NSV= Number of secondary veins; BDPV= Basal diameter of the principal vein; BSP= Basal diameter of petiole; RLP= Relative length of the petiole; RWL= Relative width of the lamina.
The positive correlations among leaf traits such as BSP, NSV, and BDVP with MAP may indicate the adapting capability of Q. saponaria to gas exchange. Leaf traits such as vein density influence leaf water transport (Buckley et al. 2015). In general, the higher the number and diameter of veins, the higher the leaf hydraulic conductance, the stomatal conductance and gas exchange (Sack and Scoffoni 2013, de Boer et al. 2016). We observed a trend to increase BSP, NSV, and BDVP as MAP increases, but trees in Group 1 had lower values for these traits in relation to trees in Group 4, suggesting they have reduced construction cost in carbon and nutrient investment (Sack and Scoffoni 2013), but at the expenses of living under constant restrictions for stomatal conductance (Sack and Frole 2006). Similarly, the negative correlations between LP and BSP with temperature may also indicate variations in leaf hydraulic conductance of the groups under study. When temperature increases Q. saponaria trees tend to have shorter and thinner petioles, suggesting a decrease in leaf hydraulic conductance (Sack and Frole 2006), but this needs to be corroborated with in situ quantification of leaf hydraulic conductance (Carrasco-Urra et al. 2019). Trees in Group 1 had lower LP and BSP in comparison to Group 4, corroborating the stressful environment in which trees of Group 1 grew. The lack of correlation between temperature and precipitation with important functional traits such as leaf area (LL and MWL in our study), may be attributed to the levels of genetic diversity and population structure of Q. saponaria (Ramos et al. 2010, Letelier et al. 2015, Abarca 2019) which could have improved the buffering capability against environmental constraints. However, this hypothesis needs further research.
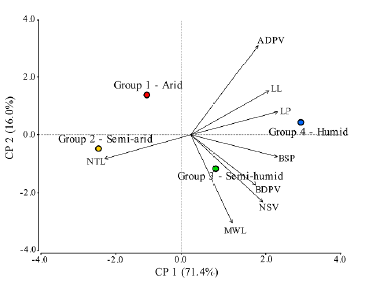
Figure 4 Principal Component Analysis for the relationship among leaf characters and the De Martonne aridity index. Colored circles correspond to the Groups 1 to 4 according to the De Martonne index. LL= Lamina length (mm); MWL= Maximal width of lamina (mm); LP= Length of petiole (mm); NSV= Number of secondary veins; BDPV= Basal diameter of the principal vein (mm); ADPV= Apical diameter of the principal vein (mm); NTL= Number of teeth per lamina; BSP= Basal diameter of petiole (mm).
Our results must be interpreted carefully because MAP, MAT, and the very simple aridity index (i.e., the De Martonne aridity index), only gives global climatic information at the groups considered with no details on variation at the microsite level. Changes in leaf morphological and physiological attributes must be analyzed by considering soil moisture, aspect, forest cover (Beerling et al. 1996), air temperature and humidity (Panek and Waring 1995, Codarin et al. 2006), and atmospheric CO2 concentrations (Marshall and Monserud 1996). Additionally, further work on the morphological leaf plasticity of Q. saponaria should include leaf position and specific leaf area as indicators of adaptation to light and water.
CONCLUSION
We found a lack of phenotypic variation and no association of leaf area with climate in the natural populations of Q. saponaria under study. However, the significant relationships between petioles and veins with climate variables suggests that shorter petioles and thinner veins are adaptations of populations located at dry sites to face with a restricted water transport and higher rates of transpiration.
Table 3 Mean ± standard error for leaf morphological traits of Q. saponaria samples according to groups defined by Jenks. Different letters indicate statistical differences among groups (P < 0.05).
| Leaf trait | Groups | |||
|---|---|---|---|---|
| Group 1 | Group 2 | Group 3 | Group 4 | |
| LL | 32.0 ± 0.5a | 30.8 ± 0.8a | 32.1 ± 0.4a | 32.7 ± 0.6a |
| MWL | 19.4 ± 0.5a | 19.3 ± 0.6a | 20.3 ± 0.3a | 19.6 ± 0.4a |
| LP | 2.4 ± 0.0bc | 2.2 ± 0.1c | 2.6 ± 0.0b | 3.0 ± 0.0a |
| NSV | 11.3 ± 0.2c | 12.2 ± 0.6bc | 12.9 ± 0.2ab | 13.7 ± 0.3a |
| BDPV | 0.78 ± 0.03b | 0.87 ± 0.04b | 0.87 ± 0.02b | 0.97 ± 0.04a |
| ADPV | 0.31 ± 0.02a | 0.30 ± 0.02a | 0.30 ± 0.02a | 0.31 ± 0.02a |
| NTL | 5.8 ± 0.2ab | 6.5 ± 0.3a | 5.6 ± 0.7ab | 4.9 ± 0.2b |
| BSP | 1.20 ± 0.03ab | 1.17 ± 0.04b | 1.28 ± 0.02ab | 1.32 ± 0.04a |
| RLP | 7.3 ± 0.2b | 6.8 ± 0.3b | 7.5 ± 0.1ab | 8.4 ± 0.2a |
| RWL | 61.1 ± 1.3a | 62.9 ± 2.1a | 64.7 ± 1.1a | 61.1 ± 1.8a |
For acronyms, refer to Table 1.

