Introduction
The existing literature on physical limnology and its linkage with the water quality of temperate inland waters is prolific. However, the investigations in the tropics, and particularly in the tropical Andes, are scarce in spite of the fast growing of human populations in tropical regions, which has created serious environmental problems during the last decades for tropical lakes and reservoirs (Nilssen, 1984; Parinet, et al., 2004). Tropical lakes differ from temperate lakes in a variety of aspects (Lewis Jr., 1987; Lewis Jr., 1996) and are likely more sensitive to environmental changes (climate, land use, population, invasive species, pollution) than temperate lakes (Lewis Jr., 2000). However, historical emphasis on the study of temperate lakes has biased our understanding of tropical lakes functioning in the context of physical and biogeochemical responses.
In the particular case of Colombia, numerous reservoirs for hydropower generation and water supply have been constructed during the last few decades to satisfy the growing energy and water demands of the country. Management of these reservoirs requires extensive knowledge and understanding of the physical processes responsible for water circulation, which influence directly water quality, demanding clarification of the predominant processes and time scales over which they evolve (Mortimer, 1974; Mortimer, 2004). Under this context, this paper focuses on the description of basin-scale internal waves, a predominant physical process, in a tropical Andean reservoir and discusses possible consequences on the water quality.
Stratified lakes and reservoirs can be regarded as three-dimensional, mechanical, viscously damped oscillators characterized by an infinite spectrum of baroclinic (i.e., internal motions in which isopycnal surfaces oscillate) oscillatory natural modes with characteristic periods and spatial structures (Monismith, 1985; Lemmin, et al., 2005; Shimizu, et al., 2008; Valerio, et al., 2012). The characteristics of these natural modes depend on the shape of the basin and the vertical structure of the density field (Münnich, et al., 1996; Fricker & Nepf, 2000) and are fundamental to the ecological functioning of lakes and reservoirs as they drive a variety of physical, chemical and biological processes (MacIntyre, et al., 1999; Eckert, et al., 2002; Serra, et al., 2007; Evans, et al., 2008; Hingsamer, et al., 2014). These internal waves can produce turbulence and mixing through different mechanisms, such as the increased shear at the lake interior (Horn, et al., 2001; Preusse, et al. 2010; Bouffard, et al., 2012, Ulloa, et al., 2015), interaction with the bathymetry, and a cascade of energy from basin-scale to high-frequency internal waves (Imberger, 1998; Boegman, et al., 2003; Wüest & Lorke, 2003; Gómez-Giraldo, et al., 2008). The basin-scale internal waves play an important role in the development of the turbulent boundary layer (Lemckert, et al., 2004; Lorke, et al., 2005; Simpson, et al., 2011) and can resuspend sediments and nutrients from the bottom and reincorporate them into the water column (Gloor, et al., 1994; Pierson & Weyhenmeyer, 1994).
The natural modes are classified depending on the number of nodal points they have in the horizontal (j) and vertical (i) directions as ViHj (Figure 1S, https://www.raccefyn.co/index.php/raccefyn/article/downloadSuppFile/799/3895). The most commonly observed vertical baroclinic response is the V1 (Mortimer, 1953); however, higher vertical modes are not unusual (e.g., Wiegand & Chamberlain, 1987; Vidal, et al., 2005; Vidal & Casamitjana, 2007; Pannard, et al., 2011; Lorrai, et al., 2011; Ulloa, et al., 2018). The difference in the spatial structure of the modes leads to advection and mixing in different locations and, thus, it can drive mixing and turbulence at specific zones of the water column where high shear occurs (Wiegand & Chamberlain, 1987; MacIntyre, et al., 1999; Hondzo & Haider, 2005; Henderson, 2016). The vertical structure of the oscillations can influence the circulation patterns in the lake (Vidal, et al., 2005; Vidal, et al., 2007; Ulloa, et al., 2018) and affect the properties of the water withdrawn for the reservoir operation (Anohin, et al., 2006), as well as the routes followed by substances and species entering to the reservoir from the inflow discharges (Cortés, et al., 2014; Hogg, et al., 2018). Vertical one modes typically lead to stronger dissipation around the basin perimeter through the turbulent boundary layer, while higher order vertical modes tend to dissipate more of its energy through increased shear at the interior of the lake (Simpson, et al., 2011).
The description of the natural modes has been accomplished in the literature by the implementation of models with simple horizontal geometries (e.g., rectangular, circular, elliptical) and flat bottoms for layered (Heaps & Ramsbottom, 1966; Csanady, 1967; Antenucci & Imberger, 2001) and continuous stratification (Csanady, 1972; Monismith, 1987). However, they reveal little about real sloping bottoms. Münnich (1996) and Fricker & Nepf (2000) proposed two-dimensional eigenvalue numerical models taking account for a 2D arbitrary morphometry and continuous stratification. On the other hand, there is a family of eigenvalue layer-stratified models with irregular bathymetry that can incorporate better the two-dimensional (horizontal) features of the morphometry and have shown to accurately predict the natural modes of oscillation (Schwab, 1977; Bauerle, 1998; Shimizu, et al., 2007). In this work, we used a simple eigenmodel of the family of the rectangular flat bottom (Gill, 1982) to support our observations, even though we recognize the existence of more advanced models.
Previous studies have dealt with internal waves in Colombian inland waters (Vélez-Castaño & Gómez-Giraldo, 2011; Posada-Bedoya, et al., 2017). However, none of them have been focused on the characterization of the internal waves during dry seasons. The dry season stratification particularly imposes a major restriction for the vertical mixing of the water column compared to other hydrological seasons of the tropical Andes hydrology and, thus, it is of critical interest for the water quality of the reservoir. Our objective was to make a first approach to the characterization of the dominant basin-scale baroclinic response of a tropical Andean reservoir during a dry hydrological period from the analysis of field measurements complemented with a numerical eigen-model. We also investigated the nature of the damping of the oscillations and the diapycnal mixing associated with the baroclinic modes. With this work, we expect to motivate future research on tropical Andean inland waters of Colombia and highlight the relevance of the physical processes for the water quality of these water bodies.
In this paper, we describe the study site, measurements, data analysis procedure, and the natural eigenfunction model. We describe the evolution of the external forcing and the thermal structure during the survey. Then, we depict the measured internal wave field from spectral analysis of the field data and present the theoretical natural modes by using the eigenmodel. With the aim to show the role of the wind forcing in the excitation of the internal waves, we assimilated the reservoir as a linear damped forced mass-spring system and estimated the damping ratio of the dominant baroclinic mode. Finally, we estimated the potential diapycnal mixing by shear due to the baroclinic modes and summarized the scopes of the numerical model and the relevance of the results for the reservoir ecology.
Materials and methods
Study site. Porce II is a reservoir for hydroelectric power generation located in Antioquia, Colombia. It is a 10-km long, 1-km wide canyon reservoir with a maximum depth of ~94 m (Figure 1). The reservoir is situated in a valley sheltered by mountains running parallel to its main axis. The surrounding topography influences the wind pattern over the reservoir (see wind roses in Figure 1) inducing a dominant component following the canyon axis that blows every afternoon (Largo-Gaviria, 2011). The reservoir receives the waters of the Porce River, which is its main tributary. Temperature is the dominant parameter in the density stratification of the dry season, with no practical effect of salinity or suspended solids (Largo-Gaviria, 2011).
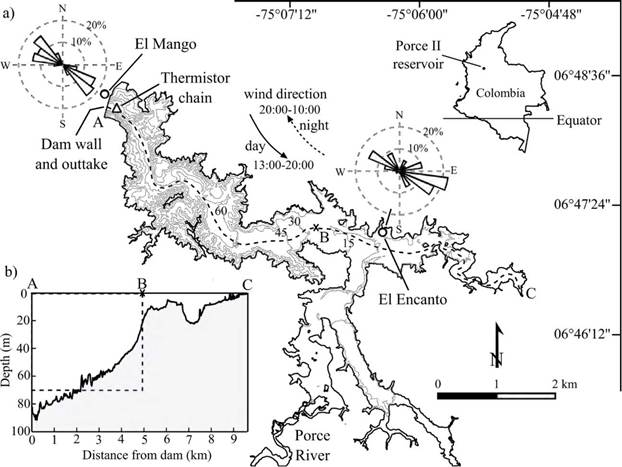
Figure 1 (a) Porce II reservoir location with bathymetry, thermistor chain station (white triangle) and meteorological stations (white circles). Isobaths are shown every 15 m. The wind rose was calculated for wind speeds above 2 ms-1 from measurements during the survey. Inset (b) bottom basin along the thalweg, which is shown as the dashed line in (a). The dashed rectangle in (b) represents the rectangular domain defined to solve the eigenfunction model.
Field data. One thermistor chain was installed close to the dam around the deepest zone of the reservoir (Figure 1) recording data every 15 min during the dry period from March 30 to April 08 of 2011. The thermistor mooring was composed of 13 temperature loggers located at depths of 0.5, 1, 2, 3, 4, 6, 8, 12, 22, 30, 38, 40 and 44 m. The shallow temperature sensors (<30 m depth) were HOBO Pendant® (ONSET), with an accuracy of 0.53 °C (resolution of 0.14 °C) and the remaining were HOBO® Pro V2 (ONSET), with an accuracy of 0.2 °C (resolution of 0.02 °C). We measured a conductivity, temperature, and depth (CTD) profile of high vertical resolution (around 20 cm bin-size) using a Sea-Bird Scientific CTD during April 05 of 2011 at the same location of the thermistor chain. Wind speed and direction were recorded at the dam site by El Mango meteorological station and with the portable Davis Instruments® Vantage Pro 2 meteorological station at El Encanto site (Figure 1) with sampling intervals of 30 min and 15 min, respectively. Wind information at El Mango and hydrological records of the Porce River inflow and the outtake discharge were provided by the owner of the reservoir, Empresas Públicas de Medellín, at 30 minutes intervals.
Spectral analysis. Fourier analysis was applied to three types of time series: (i) Isotherm depth time series calculated from the measured temperature field data, (ii) temperature records, and (iii) forcing time series (i.e., wind speed and hydrological discharges). Isotherm depths were calculated by linear interpolation of the thermistor chain temperature data. Power spectral density estimations were calculated from the modified periodogram by averaging in the frequency domain to improve the statistical confidence (Bendat & Piersol, 1986). The significance of the spectral peaks was tested by comparing the computed spectrum against the mean red noise spectrum from the time series by performing a /2-test with a probability of error of α = 0.05 and a 95% confidence level and two degrees of freedom (Torrence & Compo, 1998). The lower confidence boundary for the spectral peaks was defined as the upper 95% significance level for the red noise signal (a first-order autoregressive process) containing the same variance as the observed time series (Gilman, et al., 1963). In order to identify the vertical structure of the internal waves, we performed cross power spectral analysis and calculated the coherence and phase difference (Bendat & Piersol, 1986) between pairs of temperature series recorded at different depths.
Numerical model. To describe the baroclinic modes of Porce II, we implemented a model that provides an adequate representation of the weak and continuous stratification of the reservoir assuming a rectangular basin geometry of uniform depth H and length L. Starting from the continuity and the momentum equations, neglecting viscous and nonlinear effects, assuming incompressibility, and applying the Boussinesq approximation to the fluids equations of motion, we obtained the following two-dimensional linear wave approximation (Gill, 1982; Münnich, et al., 1992):
Where
w denotes the vertical velocity component, z is the height measured from the flat bottom basin, x and y are the horizontal coordinates, and N is the Brunt-Vaisala or buoyancy frequency. In the case of internal waves, surface elevations are small, therefore, we used the rigid lid approximation, thus, the boundary conditions were as follows:
To obtain the baroclinic modes, we had to find the non-trivial solutions to eq. 1 subject to these boundary conditions. We assumed a periodic time dependence, so w = x(x, z) e iat , and by taking advantage of the flat bottom geometry, we assumed decoupled solutions in x and z: X(x,z) = ξ(x) W(z). By replacing this expression in eq. 1, we obtained two ordinary differential equations in ξ(κ) and W(z):
where C is a separation constant to be determined. The general solution of eq. 4 for ξ was
where k x is the horizontal wave number, A is a constant amplitude and Φ0 is the phase to be determined from the boundary conditions. Thus, eq. 6 yields the separation constant C = k x 2 . Replacing this constant in eq. 5 we obtained (Gill, 1982)
where c n is the horizontal phase speed and W n is the vertical structure of the nth vertical mode. This is of the Sturm-Liouville form, which is analogous to the normal modes of oscillations of other systems, e.g., the stretched string. For a continuously stratified lake, there is an infinite set of possible values (eigenvalues):
associated with the corresponding eigenfunctions, the normal modes:
that satisfy eq. 7. Although eq. 7 describes all the vertical wave modes along an infinite x-axis, we are only interested in the standing waves, whose wavelength
 must be an integer part of twice the length of the lake, 2L. Hence, for those standing waves,
where m is the horizontal order of the mode. Thus, for every c n obeying eq. 7 there must exist a set of certain frequencies ωmn (the eigenfrequencies) associated with the horizontal wavelengths k m determined by solving eq. 10 that represent the baroclinic modes of the basin. In that way, the natural frequencies and periods T mn of the baroclinic modes are 27r
To solve the eq. 7 for the vertical structure and phase velocity of the modes, the z-axis was discretized using centered finite differences, which, along with the boundary conditions, led to a matrix formulation with the generalized eigenvalue form:
where A is a matrix determined by the discretization on the z-axis, Β a matrix determined by the discretized buoyancy frequency in the z-axis and λ is the eigenvalue related to the wave phase velocity as λ = 1/C n 2 . For a uniform vertical discretization of the water column (Δz), the squared matrices A and Β are:
where the subscript k indicates the position in the vertical grid and N k is the corresponding buoyancy frequency of the k-th cell.
The vertical velocities obtained by the model have arbitrary units because the resultant eigenvectors are not realistic velocity vectors. Thus, the vertical displacement, δ = w/ίω, which differs from the vertical velocity w only by one factor (1/iω), has the same vertical structure to that of the vertical velocity (Fricker & Nepf, 2000). Finally, the horizontal velocity component in the middle of the reservoir associated to the baroclinic modes was calculated from the vertical velocity at one end of the basin by integrating the two-dimensional continuity equation (Münnich, et al., 1992).
Results
Thermal structure, hydrology and wind forcing. Diurnal wind speeds occurred regularly over the reservoir, with maximum speeds between the 13:00 h and 20:00 hours coming mainly from the northwest, ascending from the dam and through the river canyon. Lower wind speeds occurred during the night and early morning with an opposite wind direction along the canyon valley towards the dam site (Figure 2a). The power spectrum of the wind speed measured at both stations showed the dominant 24 h periodicity of the wind-forcing (Figure 3 a) with a minor peak around the 12 h period. Diurnal cycles of atmospheric pressure above the reservoir were related to the diurnal cycle of the wind forcing (not shown). However, given the spatial scale of the reservoir, it is very unlikely that the horizontal gradients of atmospheric pressure become high enough to excite internal wave motions and for that reason, this variable was not included in the subsequent analyses.
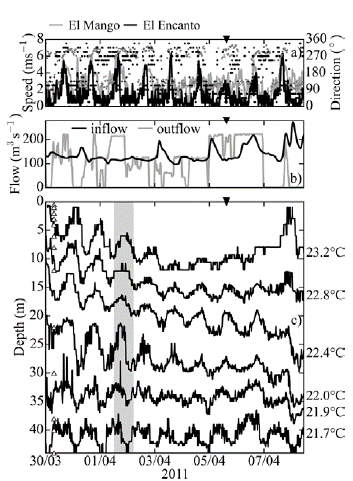
Figure 2 (a) Wind speed (line) and direction (dots), (b) inflow and outflow discharges, and (c) isotherm displacements. The black triangle at the top of the panels marks the time of measurement of a temperature profile with the CTD. Triangles in panel (c) mark the depths of the thermistors. The gray shadowed area in panel (c) indicates the period discussed in the text.
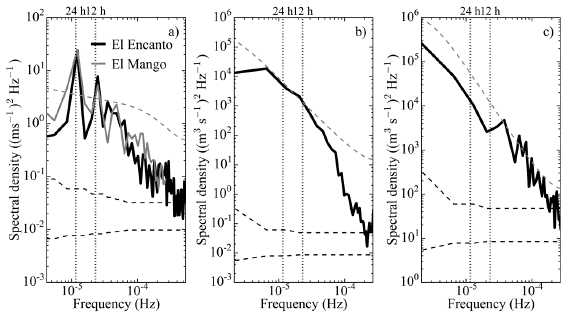
Figure 3 Power spectrum of (a) wind speed, (b) inflow discharge, and (c) outflow discharge. The dashed gray lines indicate the significance limit for the spectral peaks with a confidence level of 95% (Torrence & Compo, 1998). The bottom dashed black lines indicate the confidence bands of the power spectra with a confidence of 95%. The vertical dotted lines mark the 12 h- and 24 h-periods.
Low inflow discharges dominated during the field campaign, with a gradual increase throughout the survey and the occasional arrival of important discharges towards the end of the period. Outflow discharges occurred with a variable operation, with similar magnitudes to those of the inflows when the outtake was in operation. A dominant frequency component in the inflows and outflows time series was not identified, as can be seen from their power spectra (Figures 3b,c).
The evolution of the thermal structure showed a gradual deepening of the isotherms between depths of 10 and 30 meters, which indicates a warming of these waters due to the surface heat fluxes. Towards the end of the survey (from April 6 onwards), there was a change in the deepening rate of the isotherms, with a faster deepening for the isotherms below 20 m deep and an upward trend in the isotherms above 20 m (Figure 2c). According to the observations by Gómez-Giraldo, et al. (2012), this behavior is a typical signature of the effect of the Porce River plume on the thermal structure during dry periods.
Two features of the dynamics of the isotherm displacements stand out. First, there was a dominant periodicity close to 24 h in the vertical displacements that gradually reduced its amplitude towards the end of the survey. Second, the top and bottom isotherms shown in Figure 2c oscillated against one other indicating a corresponding oscillation in the thickness of the middle layers of the reservoir. For instance, during April 1 (see the gray panel in Figure 2c), the displacement of upper isotherm (23.2°C) was upward while the displacement of the bottom isotherm (21.7°C) was downward.
Observed internal waves. The isotherm displacements and their associated power spectra exhibited a dominant and statistically significant energy peak around the 24-h period (Figure 4), as expected from the qualitative analysis of Figure 2, and matching the major peak in the wind speed power spectrum. The amplitude, and hence the energy, of the internal wave oscillations, gradually decreased throughout the survey period, reaching minimum energy towards the end of it.
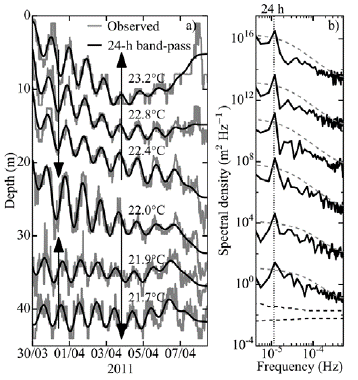
Figure 4 (a) Depth time series of isotherms and its band-passed signal around the 24-h period band. The arrows make explicit the direction of the vertical displacements. (b) Power spectra of isotherm displacement. The dashed gray lines indicate the significance limit for the spectral peaks with a confidence level of 95% (Torrence & Compo, 1998). The bottom dashed black lines indicate the confidence bands of the power spectra with a confidence of 95%. Offset between spectra is three logarithmic cycles. The vertical dotted line marks the 24 h-period.
To identify the nature of the 24-h period oscillations, we calculated the coherence and phase spectra between the temperatures recorded by the thermistors at 6 m and at 20 m and between thermistors at 6 m and at 44 m (Figure 5a,b). For the 24-h period, the coherence was high and statistically significant for both pairs of temperature records. The phase spectra around this period provided information about the vertical structure of the oscillations. Around the 24-h period band, the 6 m and 44 m temperature records oscillated out of phase with one another while the temperatures at 6 m and 12 m oscillated in phase (Figure 5a,b).
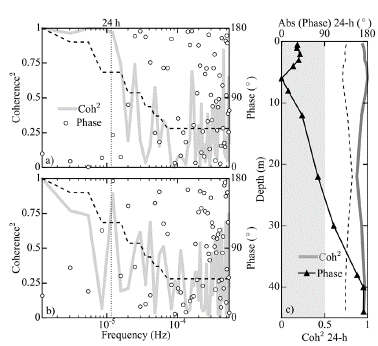
Figure 5 Coherence and phase spectra between temperature time series at (a) 6 m and 12 m deep and (b) at 6 m and 44 m deep. (c) Vertical profile of coherence and phase for the 24-h period band using the temperature series at 6 m depth as reference. The black dashed line in all panels indicates the threshold of 95% significance for the coherence.
To improve the understanding of the vertical structure of the oscillations, we calculated the coherence and phase for the 24 h period between the temperature at every thermistor depth and the temperature at 6m depth, defined arbitrarily as reference. Figure 5c shows the vertical structure of the coherence and phase for the 24-h period oscillations. The vertical-two structure o the oscillations can be confirmed in the depth range covered by the thermistor chain with a change of phase around 20 to 30 m deep.
Thus, the 24-h peak of the isotherms displacements was associated with a second vertical mode or higher. However, at this point it is not possible to establish with certainty the vertical order of the mode from the field data, as the thermistor chain did not cover the whole depth range of the reservoir and, hence, it could be possible that below 44 m (the location of the deepest thermistor) another change of phase occurs. It should be noted that our data does not strictly exhibit phase differences of 0° or ±180°, which would be expected for pure modes. The discussion of this result is presented below.
Predicted baroclinic modes by the eigenmodel. We set the uniform depth of the domain at 70 m and 5 km length, which is the approximated length of the main body of the reservoir where the basin-scale oscillations are expected to occur (Figure 1b). Since the thermistor chain covered only the first 44 m of the water column, the buoyancy frequency required to solve the model was calculated from the temperature profile measured with the CTD, which covered all the water column and shows a similar structure to the average temperature profile measured with the thermistor chain for the survey (Figure 6a). In addition, the CTD profile was smoothed using a fourth-order Butterworth filter, as the results of the eigenfunction model are not significantly sensitive to the small-scale features of the stratification profile (Münnich, 1996).
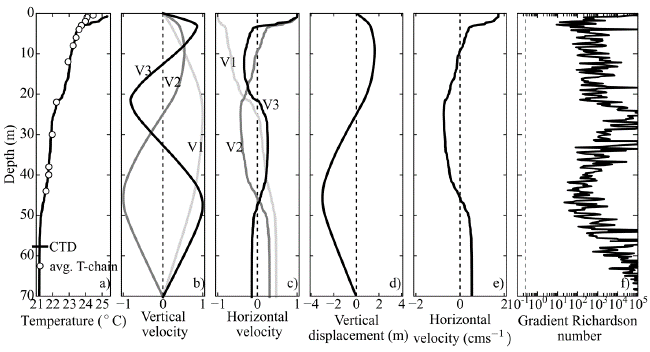
Figure 6 (a) Average temperature profile of the thermistor chain for the survey (dots) and the temperature profile measured with the CTD (line); (b) vertical and (c) horizontal velocity profiles associated with the lowest three baroclinic natural modes. (d) Vertical isotherm displacement profile scaled for a maximum amplitude of 3 m and its (e) associated horizontal velocity profile for the V2H1 mode. (f) Gradient Richardson number associated with the V2H1 baroclinic mode. The dashed line in (f) indicates the critical value of 0.25.
The vertical structure of the first three natural modes predicted by the eigenmodel is shown in Figures 6b,c. The natural periods (phase velocities) associated with the lower vertical modes V1, V2, and V3 are 12.7 h (0.22 ms-1), 25.2 h (0.11 ms-1), and 35.2 h (0.09 ms-1), respectively.
Discussion
Porce II as a wind-forced damped oscillator. The combined analysis of the field data and the results of the eigenmodel indicated that during the survey, a V2H1 mode of natural period close to 24 h was excited in the reservoir and the depth of change of phase of the oscillations occurred between 20 and 30 m deep. The spectral analysis of the wind speed showed a significant secondary peak around the 12-h period, which matched the theoretical period of the V1H1 mode predicted by the eigenmodel. However, the measured isotherm displacement did not show any significant energy content around that period, which indicates that the mode was not excited during the survey. Although the simultaneous response of several modes is not a rare feature (Antenucci, et al., 2000; Vidal, et al., 2007), this was not observed in Porce II and the V2H1 mode was the only dominant seiche. A possible aspect inhibiting the excitation of the V1H1 mode is that, although a 12-h periodic onset of the wind exists, its duration is less than one-quarter of the mode period (i.e., ~3h), which is the minimum duration of a wind event leading to the formation of the horizontal baroclinic gradients (Spigel & Imberger, 1980) necessary for the complete excitation of the mode. On the other hand, it has been shown that when internal waves are excited by density currents there is a strong influence of the level of neutral buoyancy of the currents on the relative proportion of energy transferred to the different vertical wave modes (Maurer & Linden, 2014). Although more research is needed to prove it, we suggest that the inhibition of the V1 mode excitation is caused by the currents from the selective withdrawal and the river plume moving between 10 m and 40 m, which is the depth range on what the V1 mode should change the velocity direction (Figure 6d). Such depth range coincided with the middle layer of the V2 mode (Figure 6d), so the currents did not interfere with the horizontal motion of the V2 mode.
Previous studies have shown that the periodic operation of the outflow discharge in a reservoir may lead to the excitation of internal waves (Imberger & Fandry, 1975; Ibarra, et al., 2015). It has also been shown that internal waves may be energized by the intrusion of density currents in stratified environments (Maxworthy, et al., 2002; Nash & Moum, 2005). According to the spectral analysis, it can be concluded that the wind is the only forcing whose spectral content explains the baroclinic oscillations occurring in Porce II reservoir. Thus, it is possible to affirm that the V2H1 baroclinic mode was excited by resonance with the wind forcing. This dynamic regime has been observed in other stratified lakes, such as Lake Alpnach (Münnich, et al., 1992; Lorrai, et al., 2011).
To get a deeper insight into the link of the water column response and the wind-forcing, we assimilated the reservoir to a harmonic, viscously damped wind-forced oscillator. We 24-h bandpass-filtered the observed oscillations of the 25 m depth isotherm and adjusted the output to the oscillation of a linear damped forced mass-spring system (Gómez-Giraldo, et al., 2006). This simple dynamic system allows the description of the oscillations of the reservoir without including the complexities added by the spatial structure (Stocker & Imberger, 2003). The wind forcing, F, was discretized by 15-min long uniform wind blocks. Each constant wind block was considered as made up of a suddenly imposed steady wind event of infinite duration and an equal but negative wind starting 15 min later. At a particular location in the reservoir, the isotherm oscillation generated by every suddenly imposed steady wind event (positive or negative) of infinite duration is given by
where x is the displacement from the equilibrium position, t is the elapsed time from the start of the wind event, the coefficient A and the phase t lag account for the spatial location and H is the unit step function, the parameter α is the inverse of the e-folding time, which is given by Td = T(27Π£)-1, the damping ratio ζ is the ratio of the decay constant α to the undamped natural frequency ω0, T is the natural period, and ω is the damped natural frequency of the system. The displacement generated by the wind speed time series is given by the linear superposition of the displacements generated by each individual wind-block (positive and negative):
where t si is the time of the start of the ith wind event and M is the total number of positive and negative wind events. The values of α, ω, A, and t lag were obtained by least-squared fitting X with the 24-h bandpass-filtered isotherm displacement.
Figure 7 shows the adjustment obtained with a good fit between the model and the measured vertical displacement. Towards the end of the period, a reduction in the amplitude of the 24-h period oscillation seems to be associated with the decay of the 24-h component of the wind forcing.
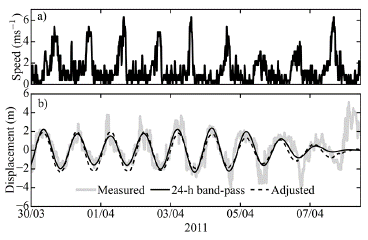
Figure 7 (a) Wind speed. (b) 25 m-depth isotherm vertical displacement measured and detrended, 24-h bandpass-filtered and estimated by the mechanical model.
The damping ratio obtained for the V2H1 mode was compared to damping ratios of seiche modes in other lakes around the globe (Table 1). The damping ratio of the V2H1 mode in Porce II (ζ = 0.08) is well below the critical damping (ζ C = 1), so the oscillations were underdamped, which has also been observed in most stratified systems with few cases (Imam, et al., 2013) reporting overdamped oscillations. We observed that the damping ratio and the e-folding time of the V2H1 mode in Porce II were similar to that reported in the other lakes in spite of the differences in size, geographical location, stratification intensity, and vertical structure. We have speculated that the major source of damping of the baroclinic motions in the reservoir is the bottom friction, as the turbulence at the interior due to the internal wave currents seems to produce low turbulence activity, as we discuss below.
Table 1 Damping in selected lakes. Modified from Imam, et al. (2013).
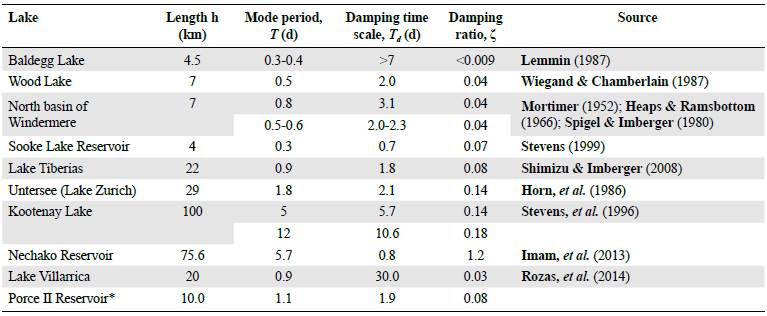
*Results from the present work
Potential diapycnal mixing induced by the baroclinic modes. We carried out a scaling analysis to evaluate the potential for diapycnal mixing induced by the baroclinic modes in Porce II. Following Miles (1961), we calculated the gradient Richardson number given by
which expresses the ratio of the stability due to the stratification (given by N) and the destabilization induced by the shear (∂u/∂z). If Ri is smaller than a critical value of 0.25, the water column may become unstable and vertical mixing can be generated through Kelvin-Helmholtz instabilities.
The vertical displacements predicted by the eigenmodel were scaled by a maximum amplitude of 3 m (Figure 6d), which was defined from the observed isotherm oscillations (Figure 2c) while the horizontal velocity component was calculated from the vertical velocity by integrating the two-dimensional continuity equation (Münnich, et al., 1992). Figure 6 shows how Ri is higher than 0.25 all along the water column, which indicates that mixing-inducing instabilities were not produced at the interior of the water column by the baroclinic mode. Thus, we suggest that a turbulent bottom boundary layer driven by the seiche-associated currents was the major source of mixing, dissipation, and damping of the basin-scale oscillations. In sloping bottom basins as Porce II, basin-scale circulations associated with the internal waves can accelerate the flow close to the boundaries and favor the formation of supercritical shear layers, which, in turn, induce mixing around the metalimnetic region that intersects the lake boundary (Ulloa, et al., 2018). Direct measurements of turbulent dissipation (Román-Botero, et al., 2017) also showed that during periods of dominant basin-scale internal waves activity in Porce II, there was a strongly stratified turbulence at the interior (far from the boundaries), characteristic of low dissipation, in contrast with the high-isotropic turbulence induced by the density plumes during flood events.
Potential implications for reservoir ecology. It has been shown that internal wave oscillations may affect the water quality withdrawn from a reservoir because the vertical fluctuations induced by the standing waves expose different water masses to the selective withdrawal at the forefront of the intake gates (Figure 2S-a1, https://www.raccefyn.co/index.php/raccefyn/article/downloadSuppFile/799/3896; 2S-a2, https://www.raccefyn.co/index.php/raccefyn/article/downloadSuppFile/799/3896) (Anohin, et al., 2006). In
Porce II, the vertical oscillations of up to 4 m at the depth of the submerged gates could be important for inducing essential changes in the quality of the water withdrawn, which in turn may be important for the quality of the river and Porce III reservoir located downstream of Porce II dam. The dominant V2H1 mode during the survey has the peculiarity of generating a periodic contraction and expansion of the middle layers of the reservoir (Münnich, et al., 1992). The horizontal pressure gradient generated by that periodic variation in the thickness of the layers can favor the transit towards the dam site of the masses of water inserted at mid-depths by the river plume (Figure 2S-b1, https://www.raccefyn.co/index.php/raccefyn/article/downloadSuppFile/799/3896; 2S-b2, https://www.raccefyn.co/index.php/raccefyn/article/downloadSuppFile/799/3896) (Vidal, et al., 2007). In this way, it can decrease the transit time of the river plume into the system and, hence, influence the retention time of the water, which is a very important parameter for water quality (Soares, et al., 2008). On the other hand, the amplitude of internal waves can be sufficient to define the intrusion depth of a river plume depending on the phase of the oscillations and the background conditions that face the plume when it enters the reservoir (Figure 2S-c1, https://www.raccefyn.co/index.php/raccefyn/article/downloadSuppFile/799/3896; 2s-c2, https://www.raccefyn.co/index.php/raccefyn/article/downloadSuppFile/799/3896) (e.g. Cortés, et al., 2014; Hogg, et al., 2018). Our calculations suggest that the seiche-associated currents induce weak diapycnal mixing at the interior of the water column. Thus, it is suggested that a turbulent bottom boundary layer driven by seiche currents is the major source of the internal wave dissipation, possibly inducing resuspension of sediment and other substances (Wiegand & Chamberlain, 1987). It should be noted that the aforementioned mechanisms of interaction of the natural modes and the water quality are only hypothetical scenarios and none of them has been proved in this work. However, they are described here to highlight the importance of studying internal waves and their linkage to the water quality of stratified inland waters.
River intrusions incorporate nutrients into the upper mixed layer where important primary productivity occurs by the turbulent mixing and advection which are moduled by other physical processes (MacIntyre, 1993; MacIntyre & Jellison, 2001; Cortés, et al., 2014). During the dry season in Porce II, typical inflow plumes loaded with nutrients intrude at depths of 20 to 30 m (Gómez-Giraldo, et al., 2012). We performed a simple decoupled analysis of the time scale that internal waves induced turbulent mixing takes to transport nutrients vertically from the river intrusion to the upper mixed layer. For this analysis, we neglected the contribution of the density current and other processes in vertical turbulent mixing as they evolve. The time scale for the turbulent diffusive transport (T
mix
) of substances from the plume up to the surface layer is
 , where K
z
is the eddy vertical diffusivity and I is the length scale. To incorporate the load of nutrients introduced by the river plume into the surface layer would require a vertical distance t~20m. According to the magnitudes estimated of Ri >> 1 all along the water column and the K
z
parameterization as a function of Ri (Yeates, et al., 2013), the eddy vertical diffusivity K
z
at the interior of the water column is of the order of the molecular diffusivity. We assumed a value of K
z
= 1x10⁶ m2/s (Gloor, et al., 2000), getting t
mic
12 years. Thus, we suggest that for the typical dry conditions in Porce II reservoir, the diapycnal mixing induced by the internal waves is negligible and other mechanisms and interactions among processes must be responsible for the major vertical transport and mixing at the lake interior.
Vertical structure of the phase. The gradual vertical variation of the phase of the measured temperature from the surface to 40 m deep (Figure 6c) is not explained by the theory of normal baroclinic modes, which predicts phase shifts of 180°. A similar pattern in the vertical structure of the phase for both measured temperature and velocity has been found in other lakes with a wide metalimnion that matches the depth range where the phase is variable (LaZerte, 1980; Pérez-Losada, et al., 2003; Vidal, et al., 2008; Hingsamer, et al., 2014). In agreement with these authors, we consider that this is the signature of the basin-scale internal waves in lakes with a wide metalimnion. According to the wave ray theory (Maas & Lam, 1995), the baroclinic modes are standing waves that result from the superposition of internal wave rays whose paths close upon themselves after bouncing in the boundaries of the basin (Cushman-Roisin, et al., 1989; Maas & Lam, 1995; Gómez-Giraldo, et al., 2006). We believe that the sharp phase shifts predicted by the eigenfunction models for flat horizontal bottoms are only possible if there is a complete vertical and horizontal symmetry of the domain. Due to the variations in the slope, depth, and stratification, the direction of the wave ray propagation on a real lake changes with depth and horizontal location. We consider that this makes possible that the rays close upon themselves at a different phase in a vertical profile, especially in the metalimnion, where they are changing direction continuously with the vertical change in the buoyancy frequency. This is likely more visible as the metalimnion thickness to the total depth is larger.
According to Henderson & Deemer (2012), the gradual variation of the phase in temperature and velocity is the signature of vertical wave propagation and not of standing waves, similar to lee waves formation in stratified systems. They suggest that because of the energy loss at the bottom of the lake, wave rays reflected from the bottom are less energetic than those downward-propagating incident rays. Thus, the superposition of both results in net downward energy propagation. Even if this were the case, it does not explain why the gradual shift in phase is observed in thick metalimnions and is not in very homogeneous hypolimnions and epilimnions. Damping (energy loss) has been recognized as a universal feature observed in basin-scale internal waves around the globe (Mortimer, 1952; Heaps & Ramsbottom, 1966; Wiegand & Chamberlain, 1987; Shimizu, et al., 2008) in several lakes where the gradual variation in phase is not observed. Our estimated damping rate was similar to those reported from other lakes where standing waves have been identified with a sharper vertical change of phase, so we do not see the attenuation of the downward rays as the cause of the gradual phase shift as suggested by Henderson & Deemer (2012). However, we recognize that more work is necessary to clarify the nature of gradual vertical phase shift.
Future calculations of the baroclinic modes. It must be recognized that the sloping bottom of the reservoir basin, clearly different from a rectangular basin, can induce phenomena as wave-ray focusing and defocusing which may affect the periods and spatial structures of the internal wave modes (Cushman-Roisin, et al., 1989; Maas & Lam, 1995; Fricker & Nepf, 2000; Gómez-Giraldo, et al., 2006). Those effects cannot be captured by the numerical model implemented in this work, which assumes a rectangular flat-bottom basin. Nonetheless, as a first approximation to the description of the natural modes, the model provided a good and valuable description of the dominant baroclinic mode observed in the field during the survey analyzed, capturing quite well the natural period and the approximated depth of change of phase of the vertical displacements.
More complete models should be used to capture the properties of the wave field in Porce II taking into account both real bathymetry and stratification. The weak and continuous stratification of Porce II, very different from the typically layered-like summer stratification of temperate lakes, as well as the non-simple morphometry of the reservoir, lead us to suggest that future analysis on the baroclinic modes must be addressed by using more elaborated models than the one used in this work.
Conclusions
Internal waves were a prominent feature of the basin-scale hydrodynamics of Porce II reservoir during the dry period studied. An underdamped V2H1 mode was excited in the reservoir by resonance with the diurnal wind forcing and prevailed for several days according to the field observations and the results of a simplified eigenvalue model.
Despite the simplifications involved in the simple model, it has shown to be useful for identifying the period and the spatial structure of the dominant basin-scale oscillations. More detailed models are required to investigate these modes and their effects more thoroughly.
We found that the contribution of the internal waves to the mixing at the interior of the water column was weak, and we suggest that the most important mixing and dissipation region appears to be the turbulent bottom boundary layer driven by seiche currents.


