


 English (pdf)
 Article in xml format
 Article references
 Send this article by e-mail
 Cited by SciELO
  Cited by Google
  Similars in
SciELO
Similars in
SciELO  Similars in Google
 Permalink
INTRODUCTION
Coffee consumption in 2016/2017 and 2019/2020 was 9.48 and 10.11 million metric tons, respectively, representing an increase of 6.5% [1]. This increase is attributed to consumption of coffee owing to its health benefits along with a rise in number of cafes and coffee outlets in emerging countries such as China and India, and other desirable effects [2-4]. Among coffee cultivars, Arabica (Coffea arabica L.) represents 70-80 % of worldwide production and Robusta (Coffea canephora) the rest (20-30%) [5]. The Arabica cultivar is preferred due to its higher organoleptic properties and better beverage quality [6-7]. In Colombia, coffee production is divided in three groups: quality standard, industrialized, and specialty coffee [8]. The latter is more valued by consumers for its consistent, verifiable, and sustainable attributes, for which higher prices are paid for resulting in higher income and more well-being for producers [9]. Among the types of specialty coffee, organic coffee is of great interest since it is produced by communities (especially indigenous) without using pesticides or herbicides [10].
In coffee processing, drying is one the most important stages, since it allows to reduce the initial moisture content of coffee bean from 50-55% wet basis (w.b) to 10-12 % w.b to inhibit microbial growth and prevent chemical degradation during storage and distribution [2]. Solar drying is the most widely used technique for postharvest processing of coffee beans on a low production scale, however, its major disadvantage is that it is a slow process that can cause undesirable physical and chemical changes [3]. Traditionally, in Colombia coffee drying is carried out naturally and convectively using hot air [10]. In order to increase the drying energy efficiency, other drying techniques such as microwave and fluidised bed systems are being explored, since they allow better uniformity in temperature and humidity distribution and shorter drying times [11-13].
Heat generation by microwave occurs in a faster way than in conventional methods [14]; resulting in a higher water vapor migration rate caused by a diffusive phenomenon [15]. However, the use of microwaves can lead to coffee beans overheating, creating “hot spots” with temperatures between 80 and 90 ° C [16], which could lead to degradation of heat-sensitive compounds responsible for the aroma and taste of coffee beverage [17]. To avoid this, it is necessary to use complementary techniques such as a fluidized bed operating at low temperature (25 °C); since air is in contact with the product surface, this causes a cooling effect that counteracts temperature rising by the microwave heating leading to a constant and uniform product temperature [11], [18]. The use of microwave and fluidized bed drying could improve the physicochemical and organoleptic quality of the final product [13].
Ghosh and Venkatachalapathy [19] used microwave-assisted with hot air for coffee beans drying, varying power levels (0.5, 1.0, and 1.5 kW) and conveyor belt speeds (5, 10, and 15 mm.s-1), air temperature at 45 °C. Dong et al., [20] dried coffee beans at five power levels (0.3, 0.5, 1.0, 1.5, and 2.0 W) using a microwave at vacuum conditions. Muñoz-Neira et al., [16] compared the effect of oven drying at 50 °C and microwave technique in the drying time and effective diffusivity of coffee beans with parchment, without parchment, and parchment only. In these studies, drying time decreased when the power level increased, and microwave technique was also compared with a conventional method. Effective diffusivity increased when power level increased as well as microwave drying was compared with a conventional drying method. Besides, Reyes et al., [21] used microwave and fluidised bed drying for coffee beans, however, in this study just heat and mass transfer modelings were carried out at constant conditions.
Regardless of the technique, the coffee bean drying process is controlled by the heat and mass transfer phenomena that occurs inside the bean and between the surface and the surrounding environment. These phenomena are related to the evaporation and removal of free water from the product [13, 18, 21]. Currently, drying processes are usually described by phenomenological, semitheoretical, and empirical models [20]. Phenomenological models are mathematical equations that describe the change of moisture content and temperature of food during the drying process [15, 22-24], but it is difficult to solve these equations; also, results are not very accurate [25]. Semi-theoretical models are based on mathematical equations used to fit experimental data and describe the diffusivity mechanism in the product drying (Fick´s second law), these equations allow to the resolution of phenomenological equations more easily by reducing the form of the answer [25]. Semi-theoretical and empirical models only describe the change of moisture in the product taking into account external resistance to mass transfer between the product surface and the environment, allowing the determination of optimal conditions for drying and equipment design, which leads to an improvement in product quality [26-28]. Several models have been widely used for modeling drying kinetics of agricultural products [19-20, 25, 29-31].
Due to the few studies reported about microwave and fluidised bed drying of parchment coffee beans in Colombia, the aim of this research was to model microwave and microwave fluidised bed drying of organic coffee beans (Coffea arabica L.) using semi-theoretical models. The authors hope that this study will be the basis for future research in terms of modeling, design, and optimization of the coffee drying processoriented to bean quality.
1. MATERIALS AND METHODS
1.1 Parchment coffee sampling
Organic parchment coffee (Coffea arabica L.) samples were supplied by Asociación de Productores Agroecológicos Indígenas Kankuamos de la Sierra Nevada de Santa Marta (Asoprokan) located in Atanquez, municipality of Valledupar (Colombia). Eight kilograms of parchment coffee were taken, washed with water to eliminate skin, pulp, and mucilage attached to the coffee beans. After that, fresh, full, and healthy coffee beans were selected manually. Then, the selected beans were packed in zipped bags with an average weight of 800 g and stored at -24 °C until further analysis.
1.2 Drying of parchment coffee beans
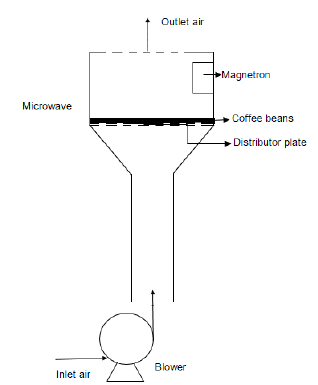
Before starting the drying process, coffee samples were taken out of the freezer and subjected to room temperature (25 °C) for 2 h. The drying process was carried out in a microwave and a fluidised bed equipment with a maximum loading capacity of 500 g (figure 1). The microwave AR HM-0-7 INOX (HACEB®, Colombia) has the following internal dimensions: 309 mm (width) × 306 mm × (length) × 217 mm (height). The microwave frequency and magnetron power were 2450 MHz and 700 W, respectively. The power absorbed by the samples was calculated using the methodology described by Kumar et al., [17]. The magnetron worked at three power levels (50, 80, and 100 %) and the fluidisation velocity was set at 2 m.s-1 with an average air inlet temperature and relative humidity of 25 °C and 51 %, respectively. The air velocity was adjusted with a single-blade damper and measured with a digital anemometer GM8908 (Benetch,Malaysia, accuracy± 5%). The temperature and relative humidity were measured using a Digital MAX/MIN Thermo-Hygrometer (Boeco, Germany) with an accuracy of ±1 °C and ±5 %, respectively. The air velocity of 2 m.s-1 was chosen according to the results reported by Reyes et al., [21]. The distributor plate has a rectangular shape with 5 mm diameter holes and the following dimensions: 270 mm (width) × 280 mm (length) × 1.5 mm (thickness). The blower was powered by a singlephase motor (Siemens, Germany) with a nominal power of 1 H.P.
Coffee beans were treated using microwave drying (MD) and microwave fluidized bed drying (MFBD) and given six treatments with two repetitions for a total of 12 runs (table 1). The experiments were carried out randomly. For MD treatments, only microwave was ON, while in MFBD treatments, the microwave and the blower were functioning simultaneously.
For the drying process, the microwave and fluidised bed dryer were loaded with 350 g of parchment coffee beans and the sample was spread uniformly in a single thin layer on the distribution plate, then, the dryer equipment was switched on for three minutes and after that, the sample was removed from the microwave cavity. This process was repeated until a moisture content of coffee beans was close to 10-12 % w.b. Dried samples were left to cool down to 25 °C, packed in zipped bags, and stored at -24 °C for further analysis. The moisture content was expressed on a dry basis (d.b) using equation (1). Drying kinetics were obtained plotting moisture content (kg water/ kg solids) vs time (minutes). This data was used for the mathematical modeling.
 (1)
(1)
Where Wtis the mass of the sample at “t” time (kg), Ws is the mass of solids in the sample (kg) and Ytis moisture content on dry basis of the sample at “t” time (kg water/kg dry solids).
The drying rate was calculated by the finite difference approximations of moisture content in function of time (see equation 2) and plotted against moisture content:
 (2)
(2)
Where dY/dt is the drying rate (kg water/kg solids. h), t is time (hours),Yt(n-1) and Yt(n) is the moisture content (kg water/kg solids) at “n-1” and “n” time, respectively.
Table 1 Treatments for MD and MFBD of parchment coffee beans
| Drying method | Power level (%) | Air velocity (m.s-1) | Drying time* | (seconds) |
|---|---|---|---|---|
| (ON) | (OFF) | |||
| MD | 50 | - | 90 | 90 |
| 80 | - | 144 | 36 | |
| 100 | - | 180 | 0 | |
| MFBD | 50 | 2 | 90 | 90 |
| 80 | 2 | 144 | 36 | |
| 100 | 2 | 180 | 0 |
MD: microwave drying, MFBD: microwave fluidised bed drying. *Drying time is the sum of exposure and break time for a drying period of three minutes.
Source: own elaboration.
The power level indicates the amount of time the magnetron is ON. The exposure (ON) and break (OFF) times of the magnetron were automatically controlled by the microwave oven (table 1).
1.3 Determination of effective diffusivity (Deff)
Effective diffusivity (Deff) was calculated using Fick´s second law, taking into account the following assumptions: negligible volume shrinkage, taking spherical geometry into account, negligible moisture gradients inside the bean, if diffusivity is constant, and if moisture content is distributed uniformly in the material [16, 19, 25]. For this system, the analytical solution is represented by equation (3).
 (3)
(3)
Yt is the moisture content a “t” time (d.b), Yeis the equilibrium moisture content (d.b), Y0is the initial moisture content (d.b), MR is the moisture content ratio (dimensionless), r is the parchment coffee radius (m), t is the drying time (s) and Deff is the effective diffusivity (m2.s-1). For long drying times, equation (3) can be simplified to equation (4).
 (4)
(4)
From equation (4), Deff of coffee beans can be calculated plotting Ln (MR) vs Time (s). The slope (K) of the resulting curve is related to the effective diffusivity and it’s expressed in equation (5).
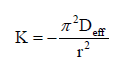 (5)
(5)
The parchment coffee radius (r) was calculated from the equivalent diameter (deq), which was determined using the methodology described by Sánchez-Ramírez et al., [32].
1.4 Mathematical modeling
Moisture ratio values (MR) from experimental data were calculated with equation (6) and values were fitted using these mitheoretical models described in table 2.
 (6)
(6)
1.5 Statistical analysis
The effect of MD and MFBD on drying time and effective diffusivity of parchment coffee bean was evaluated using a completely randomized design (CRD) with six treatments and two repetitions. The fitting of drying constants and coefficients from the models was carried out with a nonlinear square regression analysis using DataFit version 9.0 (Oakdale Engineering, USA). The goodness of fit of the models was determined by the coefficient of determination (R2) and root mean square error (RMSE) values. For the best fit, R2 values must be close to 1 and RMSE values close to 0 [30]. Besides, to evaluate the effect of MD and MFBD on drying constants (k and g), a CRD with six treatments and two repetitions for each model was used.
The experimental data were analyzed with an ANOVA (p<0.05) using Statgraphics Centurion XVI (StatPoint Technologies Inc., Warrenton, VA, USA). Significant differences between treatments were determined using an Honest Significant Difference (HSD) test of means values with a confidence level of 95 %.
2. RESULTS AND DISCUSSION
2.1 Drying and effective diffusivity of parchment coffee beans
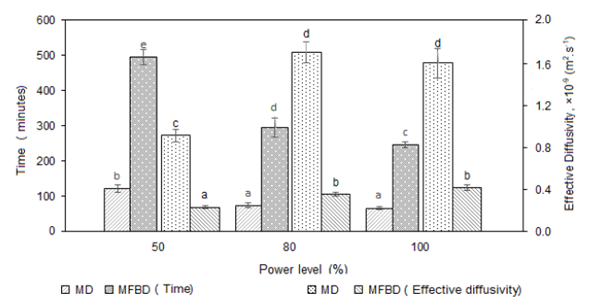
Figure 2 shows the total drying time and effective diffusivity values of coffee beans dried with each treatment.
Source: own elaboration.
Figure 2 Drying time and effective diffusivity of parchment coffee beans treated with microwave (MD) and microwave fluidised bed drying (MFBD) at three power levels. Different letters (a-e) indicate significant differences between columns by HSD test (p<0.05).
The statistical results showed that drying methods influenced significantly (p<0.05) on the drying time. For MD dried coffee beans, the shortest drying times were reached with power levels of 80 % and 100 % with values of 73.5 and 66 minutes, respectively, while the longest drying time occurred with the power level of 50 %, being 121.5 minutes. This is because a higher microwave power level represents a higher exposure time (ON) of the magnetron, so a higher amount of heat is absorbed by the coffee bean resulting in a shorter drying time [20]. For MFBD dried coffee beans, the shortest drying time was achieved in the coffee beans treated with the power level of 100 %, followed by 80 %, and, finally, 50 %, which had drying time values of 246, 295.5, and 495 minutes, respectively. The drying time for dried coffee beans treated with MFBD was about 4-fold higher than those treated with MD at the same power level, this could be related to the inlet air at room temperature being in contact with coffee bean surface, causing a cooling effect that counteracts the temperature rising by the microwave heating leading to a decrease of water transfer rate [18]. Similar times were reported by Dong et al., [20] (50 - 280 minutes), Ghosh and Venkatachalapathy [19] (180 - 300 minutes), and Muñoz-Neira et al., [16] (60 minutes) for coffee beans dried with microwave vacuum drying, hot air assisted microwave drying, and microwave drying, respectively.
The Deff of coffee beans was influenced (p<0.05) by MD and MFBD. The highest Deff values of MD dried coffee beans were obtained at power level of 80 % (1.72×10⁻⁹ m2.s-1) 10 0% (1.61×10⁻⁹ m2.s-1) in comparison with power level of 50 % (0.91×10⁻⁹ m2.s-1). Coffee beans treated with MFBD at the power level of 80 % and 100 % showed the highest Deff with values of 0.36 and 0.42×10⁻⁹ m2.s-1, respectively. In general, the effective diffusivity increased as the microwave power level increased, this could be associated that a higher power level, a higher heat generation is achieved, resulting in a faster diffusion rate of water [19], [20]. On the other hand, when MD and MFBD treatments at the same power level were compared, the use of fluidisation decreased coffee beans Deff, this could be related to the cooling effect produced by the air at low temperature when in contact with the product surface, resulting in a decrease of water diffusion inside the product [18]. The Deff values (0.23 - 1.72×10⁻⁹ m2.s-1) from this study were similar to those reported by Ghosh and Venkatachalapathy [19] and Dong et al., [20] with values of 0.76 - 1.28 ×10⁻⁹ m2.s-1 and 1.13 - 6.62 ×10⁻⁷ m2.s-1, respectively, but lower than those reported by Muñoz-Neira et al., [16] with an average value of 2.44×10⁻⁹m2.s-1. The Deff from this study varied from 10-10 to 10-9m2.s-1, which is characteristic of porous hygroscopic systems [33].
2.2 Mathematical modeling
The drying constants, drying coefficients and statistical parameters of semitheoretical models are given in table 3.
Table 3 Models parameters of drying treatments
| Model | P.L (%) | A.V (m.s-1) | k (s-1) | g (s-1) | n | a | b | RMSE | R2 |
|---|---|---|---|---|---|---|---|---|---|
| Newton | 50 | - | 0.000380c | 0.0188 | 0.9958 | ||||
| 80 | - | 0.000649d | 0.0206 | 0.9958 | |||||
| 100 | - | 0.000784e | 0.0217 | 0.9953 | |||||
| 50 | 2 | 0.000108a | 0.0376 | 0.9858 | |||||
| 80 | 2 | 0.000184b | 0.0492 | 0.9770 | |||||
| 100 | 2 | 0.000234b | 0.0581 | 0.9768 | |||||
| Page | 50 | - | 0.000285a | 1.0385 | 0.0174 | 0.9961 | |||
| 80 | - | 0.000450a | 1.0520 | 0.0182 | 0.9960 | ||||
| 100 | - | 0.001594a | 0.9066 | 0.0143 | 0.9972 | ||||
| 50 | 2 | 0.000452a | 0.8653 | 0.0295 | 0.9845 | ||||
| 80 | 2 | 0.000994a | 0.8092 | 0.0364 | 0.9764 | ||||
| 100 | 2 | 0.003012a | 0.7202 | 0.0336 | 0.9972 | ||||
| Modified Page | 50 | - | 0.000378c | 1.0386 | 0.0174 | 0.9961 | |||
| 80 | - | 0.000644d | 1.0521 | 0.0182 | 0.9960 | ||||
| 100 | - | 0.000799e | 0.8967 | 0.0143 | 0.9972 | ||||
| 50 | 2 | 0.000113a | 0.8659 | 0.0576 | 0.9845 | ||||
| 80 | 2 | 0.000195b | 0.8093 | 0.0364 | 0.9764 | ||||
| 100 | 2 | 0.000258b | 0.7188 | 0.0270 | 0.9842 | ||||
| Henderson and Pabis | 50 | - | 0.000379c | 0.9994 | 0.0186 | 0.9957 | |||
| 80 | - | 0.000654d | 1.0068 | 0.0202 | 0.9956 | ||||
| 100 | - | 0.000753e | 0.9630 | 0.0184 | 0.9952 | ||||
| 50 | 2 | 0.000096a | 0.8949 | 0.0219 | 0.9913 | ||||
| 80 | 2 | 0.000158b | 0.8639 | 0.0285 | 0.9855 | ||||
| 100 | 2 | 0.000187b | 0.8233 | 0.0282 | 0.9807 | ||||
| Two-term | 50 | 0.000379a | 0.000379a | 0.5024 | 0.4971 | 0.0186 | 0.9957 | ||
| 80 | - | 0.000653ª | 0.000653a | 0.4997 | 0.5021 | 0.0202 | 0.9956 | ||
| 100 | - | 0.000697a | 0.004265b | 0.8832 | 0.1194 | 0.0128 | 0.9978 | ||
| 50 | 2 | 0.000096a | 0.000096a | 0.4461 | 0.4489 | 0.0220 | 0.9913 | ||
| 80 | 2 | 0.000158a | 0.000158a | 0.4320 | 0.4319 | 0.0285 | 0.9855 | ||
| 100 | 2 | 0.004170b | 0.000174a | 0.2371 | 0.7672 | 0.0134 | 0.9960 | ||
| Two-term exponential | 50 | - | 0.000417a | 1.2559 | 0.0169 | 0.9964 | |||
| 80 | - | 0.000757a | 1.4611 | 0.0174 | 0.9964 | ||||
| 100 | - | 0.002016a | 0.3614 | 0.0147 | 0.9971 | ||||
| 50 | 2 | 0.001133a | 0.0963 | 0.0260 | 0.9890 | ||||
| 80 | 2 | 0.001290a | 0.1256 | 0.0337 | 0.9826 | ||||
| 100 | 2 | 0.001210ª | 0.1639 | 0.0366 | 0.9848 |
P.L: power level, A.V: air velocity a,b,c,d,e. Different superscript lower-case letters between mean values (n=2) in each model indicate significant differences within column by HSD test (p<0.05).
Source: compiled by authors
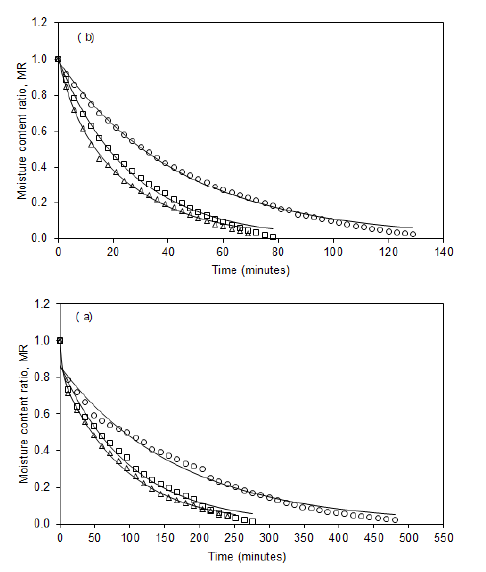
The MD and MFBD affected significantly (p<0.05) the drying constant k from Newton, Modified Page, Henderson and Pabis, and Two-term models. In the first three models, k value of MD coffee beans increased when the power level increased, while in MFBD coffee beans, this value increased with power level from 50 % to 80 %, then the k value of 80 % did not present significant difference with 100 %. This increase could be associated to the drying constant k representing in some way the water diffusion rate of the product during drying, therefore, a higher power level, higher microwave energy absorbed by the product leading to a higher mass transfer from the product to the surrounding environment. This trend was similar to those reported by Ghosh and Venkatachalapathy [19] and Dong et al., [20] for drying modeling of coffee beans dried with hot-air assisted microwave and microwave at vacuum conditions, respectively. For the Two-term model, k and g values were only affected by MD and MFBD treatments at a power level of 100 %. In general, the models presented R2 values higher than 0.97 and RMSE values lower than 0.06 [29]. Hence, the thin layer drying models proposed in this study can be suitable for predicting the changes in coffee beans moisture content. These R2 and RMSE values were similar to those reported by Muñoz-Neira et al., [16], Dong et al., [20] and, Ghosh and Venkatachalapathy[19] for microwave, microwave at vacuum conditions, and hot-air assisted microwave drying, respectively. Although all the models presented a good fit, the two-term model presented the highest R2 (0.9855 - 0.9978) and the lowest RMSE values (0.0128 - 0.0285). In figure 3, experimental and predicted MR data from the Two-term model for MD and MFBD conditions are shown.
Source: compiled by authors
Figure 3 Experimental (50% ◌, 80% □, and 100% Δ) and predicted (−) MR data from coffee beans drying using (a) MD and (b) MFBD for the Two-term model.

Figure 4 shows the drying rate curves of coffee beans treated with MD and MFBD. For MD treatments, at the start of the drying process, the highest rate is observed at power level at 100 % (3.00 kg water / kg solids. h), followed by 80 % (2.21 kg water / kg solids. h), and finally 50 % (1.60 kg water / kg solids. h). MFBD treatments showed a similar trend with values of drying rate of 1.79, 2.36, and 2.73 kg water / kg solids. H for power levels of 50 %, 80 %, and 100 %, respectively. In general, at the start of drying process the moisture content of coffee beans is high (51.73% w.b), causing a higher absorption of microwave energy and higher drying rate, so a higher moisture diffusion through the coffee bean is achieved [16, 19-20]. However, as the drying continues, the moisture content decreases as well as the microwave absorption, resulting in a lower drying rate [33]. The drying process of some agricultural products consist of two phases: a constant drying rate period and a falling rate period [26], the first is controlled mostly by capillary and gravity forces and the latter is controlled by diffusion mechanism [33]. In this study it is possible to observe that the drying process took place in the falling rate period, this is due to the fact that agricultural products such as cereals and grains are generally porous and have a high water content, giving as a result that its whole drying process take place in the falling rate period [26-28, 34].
3. CONCLUSIONS
The use of MD and MFBD influenced significantly on the drying time and effective diffusivity of coffee beans. At higher power levels, the drying time decreased, while Deff increased in MD as well as MFBD coffee beans. The shortest drying time and highest effective diffusivity were achieved when MD was used. Even though MD decreased drying time compared to MFBD, its use could overcome the effect of microwave heating on bioactive compounds in the coffee bean. The semitheoretical models used in this study were adequate to predict the drying kinetics of coffee bean using MD and MFBD, however, the Two-term model showed the highest R2 and lowest RMSE. The use of these models could be very useful in equipment design and optimization of coffee drying process.

