


 English (pdf)
 Article in xml format
 Article references
 Send this article by e-mail
 Cited by SciELO
  Cited by Google
  Similars in
SciELO
Similars in
SciELO  Similars in Google
 Permalink
1. Introduction
One of the steps of natural disaster management is to assess environmental behaviors, such as the influence of landforms on surface and subsurface water runoff processes. Obtaining information about the dynamics of these landscape elements enables decision-makers to mitigate and control risk (Arantes et al., 2021; Mardhel et al., 2021; Tesema, 2021). In this context, prior knowledge of morphometric landform characteristics and drainage networks allows for the prevention and mitigation of events that are triggered by natural disasters and for the precise and efficient allocation of resources for flood event warning and preparation systems (Waghwala and Agnihotri, 2019; Bogo, 2020).
Floods are natural processes associated with mountain snowmelts, rapid and intense rains, long-term rains, and extreme hydrometeorological events such as hurricanes and tropical cyclones (Ward et al., 2020). Thus, despite being natural events, the uncontrolled development in river plains increases the risks and socioeconomic damages caused by floods, which, in general, result in loss of life (Martin-Díaz et al., 2018; Cobbinah et al., 2022). Due to Brazil's climate and historically uncontrolled development of flood-prone areas (Fleischmann et al., 2021), several millions reais are spent annually to combat the adverse effects of flooding catastrophes (Bitencourt and Rocha, 2014).
The urbanization process imposed by capitalism in peripheral countries such as Brazil occurred in an accelerated and disorderly way, following the intense process of industrialization in the 1970s. This process promoted an intense rural exodus causing a population explosion in urban centers. This migratory wave could not be adequately absorbed in urban centers, forming clusters of precarious housing and subjecting the low-income population to settle in areas at risk of flooding (Fleischmann et al., 2021; Cobbinah et al., 2022).
However, flood risks have worsened due to uncontrolled land changes associated with climate changes (Arantes et al., 2021); the deleterious effects of this natural phenomenon are exacerbated by anthropogenic changes in hydrosedimentological systems (Silva et al., 2018), which have intensified both in volume and area leading to an increase in the number of people affected and displaced by flood events, mainly in urban areas (Molina and González, 2020; Defesa Civil, 2020).
To assess and map floods, computational analysis of morphometric and hydrological variables, remote sensing and geographic information systems (GIS) are indispensable and widely used, due to the low cost of acquiring images and even free of charge in specialized public agencies. These resources can make land use management and agricultural and urban development possible at low cost. They significantly contribute to the generation of strategic information for coping with floods (Tamiru and Dinka, 2021). Such costs are even lower than those necessary to carry out field surveys in large areas subject to flooding in a country with continental dimensions such as Brazil.
In this scenario, geoprocessing and remote sensing techniques enable preliminary and pilot studies for recognizing flood-prone areas and support land use planning, development and management (Udin and Matin, 2021). These techniques reduce the costs and efforts of mapping and disaster management (Ardaya et al., 2017). In addition, identifying areas naturally vulnerable to flooding favors the establishment of inspection, policing and control actions appropriate to their socioeconomic and environmental realities (Ekmekcioglu et al., 2022). Thus, the development of proposals to analyze and map flood-prone areas based on the morphometric characteristics of their drainage networks and landforms is a necessary response to climate change, which increasingly causes extreme climatic events to occur (Kuntamalla et al., 2018; Lin and Billa, 2021).
This research aims to develop a methodological proposal for remote detection and management of areas naturally vulnerable to flooding, based on morphometric and hydrological parameters of hydrographic basins.
2. Materials and methods
The study area comprises 170 hydrographic subbasins of the Alto Sapucaí (Figure 1), a tributary of the Rio Grande Hydrographic Basin, which has a volume of 2,813 km2 and an average flow of 146 m3s-1. A main source of water for the Furnas Hydroelectric Power Plant Reservoir, the Alto Sapucaí river in southern Minas Gerais is also important for locomotion, fishing, irrigation, and hydroelectric energy production (Galvão and Bermann, 2015). However, surrounding municipalities, such as Itajubá, Piranguinho, Santa Rita do Sapucaí, Piranguçu, and Delfin Moreira, recurrently suffer from floods due to their history of uncontrolled development (Martins et al., 2019).
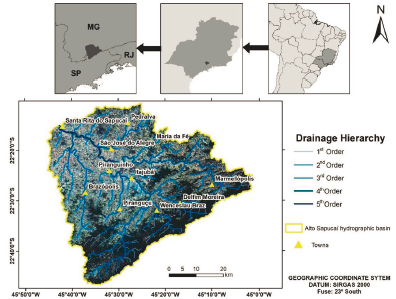
The local geomorphology is dominated by denudational units of crystalline or sedimentary rocks, with an altitude between 816 and 1,482 m. The geological framework of the area is composed of granite-gneissic complexes from the Orogenic System of Tocantins (CPRM, 1998; Hasui, 2010). In the area, red and red yellow Argisols predominate and, secondarily, red Latosols, Haplic Cambisols and Neosols (Santos et al., 2018). Regarding the hydrography, the drainage pattern is dendritic, with 1st- and 2nd-order channels with NNE-SSW orientations and 3rd-, 4th- and 5th-order channels with NE-SW directions (Ribeiro et al., 2016).
The climate, according to Kö'ppen's classification, is tropical in altitude (Cwa and Cwe), with hot and humid summers and cold and dry winters and average annual precipitation of 1.600 to 1.865 mm (Aquino et al., 2012). In southern Minas Gerais, December and January have the highest precipitation values of253 and 245 mm, respectively (Martins et al., 2019), with preferential maximums leeward of Serra da Mantiqueira, which illustrates the orographic performance in the distribution of precipitation (Campos et al., 2016; Avila et al., 2009). The dominant morphoclimatic domain is the Atlantic Forest, with the seasonal semideciduous forest replaced mainly by pastures and agriculture (Scolforo et al., 2008).
From the ArcHydro analysis module, 170 hydrographic subbasins were delimited as representative sampling units of the study area. Subsequently, the drainage hierarchy was defined according to Strahler (1957). Finally, the morphometric parameters of the Alto Sapucaí watershed were calculated using the Shuttle Radar Topography Mission 2 (SRTM 2) digital elevation model (DEM) with a vertical resolution of 30 m (USGS, 2014), which agrees with the scale criteria adopted by Gupta et al. (2017).
The DEM was processed in GIS by the Hydrology module of the Spatial Analyst Tools and ArcHydro toolset to obtain the cartographic base comprising the slope, altimetry, and hydrography maps. ArcGIS 10.5 Fill extension (ESRI, 2015) was used to reduce failures and errors in the results obtained from the morphometric and hydrological parameters to remove pixels with anomalous altimetry values.
The automatic extraction of the drainage network was performed by the hydrology extension of ArcGIS 10.5 from the processes of generating fill, flow direction, flow accumulation, con, stream to feature, and watershed files (ESRI, 2015).
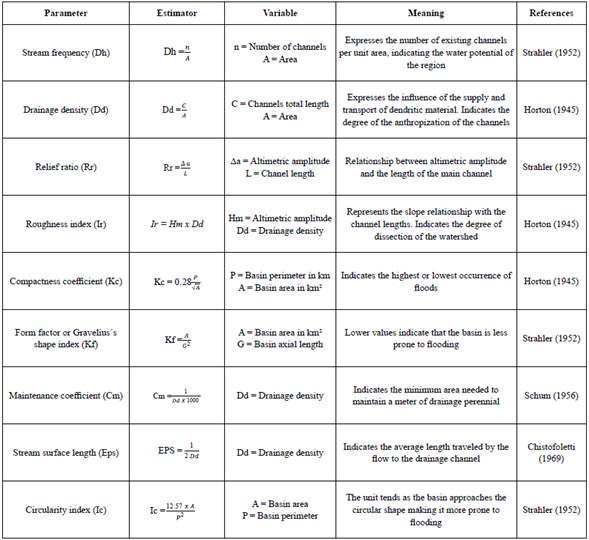
The delimitation of the hydrographic subbasins followed the criteria of altimetry and relief slope and the areas of flow and accumulation of water, allowing the precise identification of the watersheds in the basins. The calculations of morphometric parameters were performed for the 170 sampling units according to Gupta et al. (2017) and are described in Table 1.
Table 1 Morphometric parameters of the Alto Sapucaí hydrographic basin, southern Minas Gerais, Brazil.
For the composition and selection of the variables that most affect the natural propensity to flooding in regions of rugged reliefs, the following protocol was used. The variables were grouping to identified regions naturally vulnerable to the occurrence of floods due to the values of morphometric and hydrological parameters that assess risks to floods, in accordance with relevant literature (Gupta et al., 2017; Taofik et al., 2017; Kuntamalla et al., 2018). Empirical data generated by the Civil Defense of Minas Gerais were also collected (Defesa Civil, 2022), which mapped the areas with occurrences of flooding in urban areas in the study region.
The cluster analysis results were synthesized in ArcGIS 10.5, generating maps with clusters of areas with similar morphometric characteristics. This grouping uses Ward's minimum variance method and this technical use the measure of the absolute distances from Manhattan (Mingoti, 2005). In the ArcGIS software, the areas mapped by civil defense were superimposed on the areas grouped for each of the morphometric parameters calculated for the study area, which are: Compactness coefficient (Kc); Drainage density (Dd); Stream frequency (Sf); Maintenance coefficient (Mc); Roughness index (Ri); Form factor (Kf) (Cristofolleti, 1974; 1981). The variables were then selected considering the greatest overlaps between the areas mapped by the civil defense with the morphometric groupings. To evaluation of the assumptions, the nonparametric Mann-Whitney test was used (Ferreira, 2009). A maximum error of 5% was considered to reject the null hypothesis, which was declared as the nondifference between the groups (p < 0.05).
The variables representing the morphometric and hydrological parameters were initially assessed in a complete model and adjusted to a more economical model using the backward method (Mingote, 2005). Fisher's discriminant function was proposed as a predictive equation for scoring, and the classification constant was used as a cutoff point for classifying subbasins that are naturally vulnerable to flooding (Mingoti, 2005). As a result of Fisher's discriminant function, equation 1 was found, which synthesizes the variables and their weights for the evaluation of areas with a natural propensity for flooding. Data processing and analysis were performed with the support of the R statistical package (R Core Team, 2020).

Where: EFRE = Equation for flood risk evaluation; Kc: Compactness coefficient; Dd: Drainage density; Dr: Stream frequency; Cm: Maintenance coefficient; Ir: Roughness index; Kf: Form factor.
To evaluate the proposed model, the data obtained by the discriminant function were crossed with empirical maps of Civil Defense (Defesa Civil, 2022). Then, 500 points were randomly distributed on the map of areas that were vulnerable to flooding estimated by the proposed model and on the map of the observed risk areas, and the Kappa agreement index was calculated to assess the level of accuracy of the proposed map (Aburas et al., 2021).
3. Results
In this research, we use the concepts of vulnerability and susceptibility to indicate predisposed/prone terrains for the development of processes in the physical environment (floods). Already, the concept of risk was used to indicate areas likely to be affected by natural processes that can cause adverse effects of losses of life and material by floods.
The cluster analysis identified two groups of hydrographic sub-basins with similar functions of morphometric and hydrological characteristics: a group considered safe and a group characterized as naturally vulnerable to the occurrence of floods; both are described in Table 2. As an indication of susceptibility to flooding in watersheds, Dd indicates well-drained areas. Such areas convert rain into flow very quickly, causing flooding in a short period. The average Dd (Table 2) of the subbasins included in the Alto Sapucaí risk grouping was 21.65 km2, confirming its vulnerability to floods given the recurrent cases of flooding in Santa Rita do Sapucaí, Itajubá Delfín Moreira, Piranguinho, and Piranguçu by the main river, as pointed out by the Official Civil Defense Bulletin (Defesa Civil, 2022).
Table 2 Hydrographic basins, according to morphometric characteristics and parameter values. Alto Sapucaí hydrographic basin, southern Minas Gerais, Brazil.
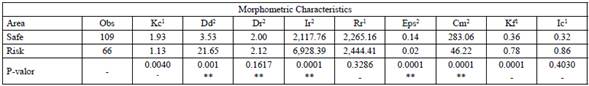
Obs: number of observations; Kc: compactness coefficient; Dd: drainage density; Dr: stream frequency; Ir: roughness index; Rr: relief ratio; Eps: stream surface length; Cm: maintenance coefficient; Kf: form factor; Ic: circularity index; 1Average; 2median; ** Mann-Whitney test.
Damage caused by floods mainly occurs between December and March. The results demonstrate that in the Santa Rita do Sapucaí region, the high values of Dd associated with extreme hydrometeorological events trigger floods (Servidoni et al., 2021). Thus, it is necessary to prepare a contingency plan for the area that includes the hydrological, climatic, geomorphological, pedological and land use aspects of the hydrographic basin, which also considers the morphometric behavior of the relief and drainage network, as shown in Table 2.
The calculated roughness index (Ir) indicates the relationship between the slope and the length of the channels. The greater the Ir is, the more sloped and dissected is the relief, more notched the shape of the flow channels is and the greater the gravitational force on the rivers. In the area, the highest Ir values partially overlap the mainstream in the upstream region associated with the knickpoints, a significant relief rupture upstream of the Alto Sapucaí hydrographic basin, resulting from lithological transitions with different resistance to erosion and regional shear zones linked to the evolution of Mantiqueira Range, developed during the Brazilian-Pan African Neoproterozoic Orogeny (Hasui, 2010; Rezende and Castro, 2016; Rezende, 2018; CPRM, 2020; Rezende and Salgado, 2020; Calegari, 2021) (Figure 2). The Ir values are consistent and agree with the results of the Machado River hydrographic basin, which also belongs to the Rio Grande hydrographic basin (Servidoni et al., 2021; 2019).
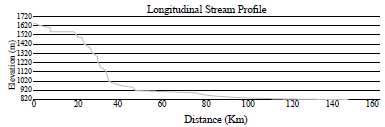
Figure 2 Longitudinal profile of the main channel of the Alto Sapucaí hydrographic basin, southern Minas Gerais, Brazil
The rupture illustrated in Figure 2 is inserted into areas with a Dd greater than 15.01 and a Dr greater than 3.01, classifying the area as well drained. This relief rupture implies a potential increase in the flow of the main course, which may cause risks to riverside populations close to urban watercourses or downstream of the mapped knickpoints (Gailleton et al., 2019). These characteristics of the downstream risk areas are illustrated by Ribeiro et al. (2016) in the municipality of the Pouso Alegre, south of Minas Gerais.
The areas in red in Figure 3 indicate subbasins that are vulnerable to floods due to the morphometric characteristics of the relief and the drainage network. There is an overlap of risk areas with Itajubá, Piranguinho, Santa Rita do Sapucaí, Piranguçu, and Delfin Moreira. In 2020, from January to March, these municipalities declared a state of emergency due to heavy rains (Defesa Civil, 2020).
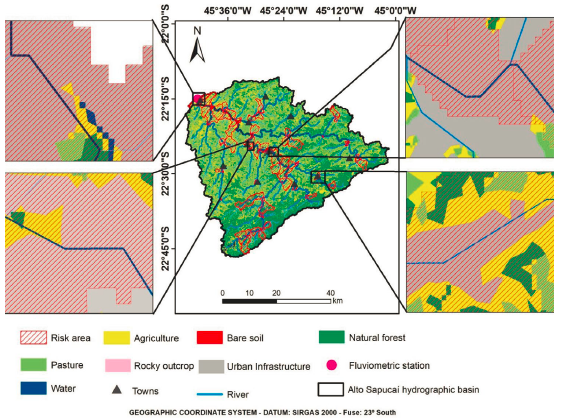
Figure 3 Map of areas at risk to floods in the Alto Sapucaí hydrographic basin, southern Minas Gerais, Brazil
Figure 3 identifies areas prone to flooding. Thus, it can be a territorial planning instrument for the preparation of contingency plans for cities. In addition, determining risk areas can target priority locations for investments and projects to contain floods. This allows for directing investments for proper disaster management in places prone to flooding in the modeled area represented in Figure 3. The identification of priority areas would enable urban space to be restructured using sustainable strategies for land use and occupation, inspecting and monitoring risk areas and planning the consolidation of new urban and rural areas into safe areas. Maps of flood-prone areas (Figure 3), when linked to land use and occupation data, can generate strategic information to prepare and execute contingency plans for floods in the Alto Sapucaí hydrographic basin (Table 3).
Table 3 Land use in risk areas of the Alto Sapucaí hydrographic basin, southern Minas Gerais, Brazil.
| Land use | Area (km2) | Area (%) | Risk Area (km2) | Risk Area (%) | Land Use Risk Area (%) |
|---|---|---|---|---|---|
| Natural Forest | 1,029.05 | 36.57 | 135.63 | 32.80 | 13.18 |
| Agricultural | 677.16 | 24.09 | 99.32 | 24.06 | 14.66 |
| Pasture | 1,060.94 | 37.70 | 161.40 | 39.04 | 15.21 |
| Rocky Outcrop | 12.93 | 0.45 | 3.74 | 0.91 | 28.92 |
| Bare Soil | 0.66 | 0.03 | 0.12 | 0.04 | 18.18 |
| Urban Infrastructure | 31.43 | 1.11 | 12.19 | 2.95 | 38.78 |
| Water | 1.46 | 0.05 | 0.85 | 0.21 | 58.22 |
| Total | 2,813.67 | 100.00 | 413.28 | 100.00 | 14.69 |
Adapted from MapBiomas Project (2018).
Table 3 presents the calculation of land use areas in the hydrographic basin. Classes are grouped to synthesize regional land use behavior. The most representative uses in the basin are Native Vegetation, Pasture, and Agricultural Areas. They occupy 36.57, 24.09, and 37.70% of the total area, respectively. However, when observing the relationship of each use with the risk area, their values are 13.18, 14.66 and 15.21%, respectively. Thus, 14.69% of the basin is vulnerable to flooding, which, despite the low numerical value, is quite significant, as this portion of the basin includes areas inhabited by people and destined for agriculture and livestock; these areas have high risk levels for damage to economic activities and life.
Urban patches occupy 31.34 km2 of risk area; however, when observing the percentage of these areas in vulnerable places, the value is 38.80% (Table 3). In other words, a significant amount of urban infrastructure historically occupies areas that are naturally prone to flooding due to the morphometric characteristics of the relief and the hydrographic network. This is due to the historical disordered occupation of the riverbanks and soil impermeabilization of the urban areas of the basin (Hora and Gomes, 2009).
The subbasins classified as vulnerable to flooding have a Kf value of 0.78, like that obtained by Taofik et al. (2017). This value expresses the flooding risk in a tropical hydrographic basin with similar morphometric and climatic characteristics. The Dd value (Figure 4) for the vulnerable cluster is 21.65, demonstrating a significant accumulation of drainage channels in this area. As it is a well-drained environment, rainfall-runoff conversion occurs abruptly in high-intensity or prolonged rainfall events (Taofik et al., 2017).
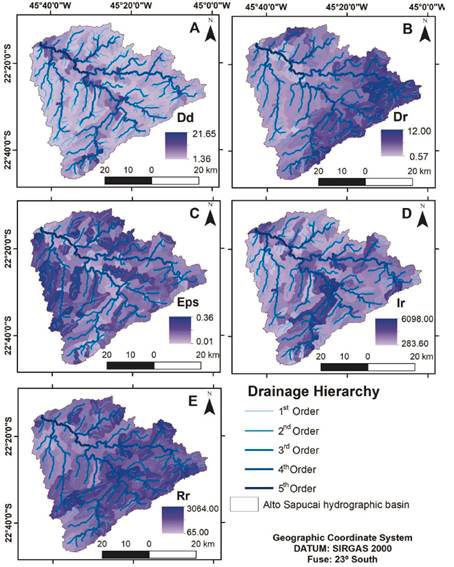
Figure 4 Map of the spatial distribution of the morphometric indices calculated for the Alto Sapucaí hydrographic basin, southern Minas Gerais, Brazil. A: Dd: Drainage density; B: Dr: Stream frequency; C: Eps: Stream surface length; D: Ir: Roughness index; E: Rr: Relief ratio.
The value of Kc 0.89 was obtained by Taofik et al. (2017) in a tropical hydrographic basin. The parity of the results obtained for the two areas demonstrates that both suffer from floods and have similar morphometric characteristics. Such values compared to other references show that Kc values between 0.75 and 1.00 characterize areas prone to flooding (Strahler, 1957; Christofoletti, 1969; Sangman and Balamurugan, 2017).
The value obtained for Kf was 0.56, indicating that the basin is subject to floods and flood peaks due to the circular shape of the downstream subbasins and the Kc values. Furthermore, such areas are concentrated near higher-order channels, such as the main channel. This can be evidenced by a comparison with the results of Purohit and Parmar (2017) in the Alaknanda Basin, India. Thus, it is essential that public administration agencies plan and adopt the necessary measures to address and mitigate the vulnerability of these areas to extreme hydrometeorological processes, with consideration given to the environmental characteristics of each area (Taofik et al., 2017).
The application of cluster analysis allows classification of the morphometric parameters into two groups. Therefore, it is possible to develop a discriminant function capable of distinguishing subbasins subject to flood risks from those that are safe (Equation 1).

Where: EFRE = Equation for flood risk evaluation; Kc: Compactness coefficient; Dd: Drainage density; Dr: Stream frequency; Cm: Maintenance coefficient; Ir: Roughness index; Kf: Form factor.
In Alto Sapucaí, the discriminant function defines an EFRE threshold value of 3.82 for the basin, below which areas are classified as naturally prone to flooding. Thus, this cutoff value classifies the watershed as a risk or safe area due to the geomorphological and fluvial characteristics (Figure 3).
The methodological proposal can be applied in spatial clippings of hydrographic basins and in different federative units, with a view to identifying areas with natural vulnerability to flooding (Brito et al., 2020). Thus, it is possible to plan actions and strategies to minimize and overcome the catastrophic effects of floods.
Cluster and discriminant function analyses are quantitative tools capable of identifying urban and regional planning priorities in areas at risk of flooding. Consequently, with such resources, governmental and nongovernmental management and actions can be more efficient. Its correct use could allow that human occupation of risk areas and loss of life, material goods, and public infrastructure are avoided.
Another advantage of the method is that it automates the detection of areas naturally vulnerable to flooding from the discriminant function applied in GIS. Automation reduces operating costs, and based on prior mapping, field activities can be concentrated in vulnerable areas.
Currently, remote object detection has been widely developed in geotechnologies, which reduces technical and operational costs, accelerates the collection of strategic information, and supports decision-making. In Brazil, a country of continental dimensions and, historically, a lack of planning and management for land use and occupation, low-cost and high-efficiency techniques to identify areas vulnerable to flooding are essential to save lives and resources (Tsatsaris et al., 2021).
The Kappa (K) test measures the degree of agreement between proportions derived from dependent samples. More than one method can map a risk area and not necessarily obtain the same result. Different methods should identify a risk area, if indeed it is a risk area. However, ideally, the different methods should achieve the same result (Landis and Koch, 1977).
Absolute agreement between two objects observed by different methods does not always occur in real life. However, it is possible to measure the reliability of two observations of the same object by K. This coefficient is based on the number of concordant responses between two products. Values close to 1.0 represent total agreement, and those close to 0.0 indicate nonagreement (Aburas et al., 2021).
Figure 5 illustrates the overlap of the risk map obtained by EFRE with those mapped by Civil Defense (Defense Civil, 2022). It should be noted that not all the municipalities surveyed have flood maps. Thus, to obtain the Kappa Agreement Index, all products available for the study area were considered. The agreement value was 0.83, which is considered solid or substantial agreement (Landis and Koch, 1977). However, such a Kappa concordance value may be higher due to the absence of maps of flooded areas in some municipalities studied.
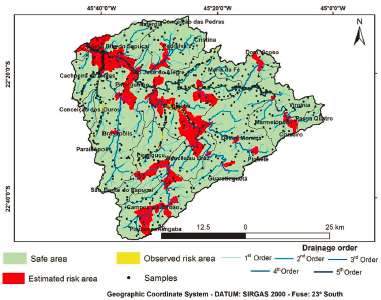
Figure 5 Map of the distribution of points to calculate the accuracy of the Kappa coefficient for the Alto Sapucaí hydrographic basin, southern Minas Gerais, Brazil.
The precision obtained by EFRE is quite satisfactory for the area. From now on, new works should seek different applications for EFRE, such as the establishment of quality control measures and model validation (Figure 5).
4. Discussion
According to Brito et al. (2020), it is vital to emphasize the importance of not waiting for the authorities to assume their responsibilities in risk management. The needs of communities affected by floods must take precedence over individual interests and real estate speculation. Due to their vulnerability, these communities must participate in the disaster management process so that, in partnership with experts, they can efficiently allocate investments to fight against and mitigate the socio-economic and environmental impacts of floods (Bogo, 2020).
However, the management of natural disasters is, above all, the responsibility of the State, which is the only entity with the legal capacity to act and regulate the occupation of risk areas. Therefore, authorities must coordinate efforts; only with the participation of all sectors of society will it be possible to achieve sustainable management and mitigation of impacts and damage caused by floods. Unfortunately, government organizations should and need to standardize procedures, which would imply changes in risk management protocols. Bureaucracy creates challenges for establishing a unified disaster management model in Brazil (Brito et al., 2020).
According to data from the João Pinheiro Foundation, 5.87 million people are part of the population affected by the Brazilian housing deficit in 2019 (FJP, 2019). These families live in marginalized urban spaces, forming clusters of poverty, and many are in areas that are inappropriate for occupation, such as slopes and riverbeds.
Brazil experienced one of its most critical summers due to the influence of the La Niña weather phenomenon. Thus, climate change promotes catastrophic events of extreme intense rains in southern Bahia and northern Minas Gerais, in addition to disasters in the cities of Rio de Janeiro and São Paulo, according to the management report of the Integrated Information System of Disasters (Civil Defense, 2022).
These increasingly commonplace events demonstrate the relevance of this type of research. This study sought to identify the area's most vulnerable to floods in a simple, objective, cheap, fast and efficient way. For a country of continental dimensions, such as Brazil, with complex hydrography and different socioenvironmental contexts, the product derived from this model is essential for the development of public policies and risk management systems in Brazilian areas, such as in the metropolitan area of Curitiba, Paraná State (Nascimento Neto, 2020), in the Itajaí-Açu River area in Blumenau, Santa Catarina State (Alberton et al., 2021); and in Amazonian cities like Belém, Pará State (Szlafsztein and Araújo, 2021).
Climate change causes storm events to become more frequent and intense, so it is essential to predict the identifying patterns, trends, and distribution of natural phenomena to reduce natural risks. Only in this way will it be possible to implement land use and occupation planning that values the quality of life and the sustainability of the environment. Therefore, the EFRE enables the identification of geomorphological conditions that potentiate flood events in tropical watersheds and may be an option to manage this problem that has devastated and claimed many lives in Brazil.
5. Conclusion
The discriminant function showed potential to identify areas susceptible to flooding. It is proposed that a value of 3.82 for the equation for flood risk evaluation indicates areas vulnerable to flooding and that higher values suggest a low natural risk of flooding.
The value of the Kappa Index was 0.83, indicating good agreement between the products obtained by the Equation Flood Risk Evaluation and the Civil Defense risk maps, demonstrating good accuracy in forecasting areas at risk of flooding.
The geomorphological characteristics and frequency of storms are the main natural factors that increase the potential for flooding in the region. Due to climate change, storm events tend to become more intense and frequent.
Of the eleven municipal seats, five are in areas at risk of flooding; these areas, Itajubá, Piranguinho, Santa Rita do Sapucaí, Piranguçu and Delfin Moreira, and have suffered flooding events in the last ten years.
Public policies to combat floods should be addressed in conjunction with the housing issue in Brazil, with the participation of vulnerable populations, providing technical support for land use planning and increasing the security of marginalized populations in urban areas.

