


 English (pdf)
 Article in xml format
 Article references
 Send this article by e-mail
 Cited by SciELO
  Cited by Google
  Similars in
SciELO
Similars in
SciELO  Similars in Google
 Permalink
1. Introduction
A landslide is a sliding movement of the earth's mass or rocks down the slope along a plane that can be seen and recorded (Habibu & Lim, 2016; Zakaria et al., 2022). Just like some Malaysian states, Penang Island, Malaysia's second most developed state and the largest by population, is prone to landslide occurrences with devastating environmental impacts (Fig. 1). These effects range from the collapse of infrastructures, loss of arable land, and sometimes deaths. Penang has a 90.8% urbanization rate, with an increased population from 722,384 (2465 per sq. km) in 2010 to 808,900 (2760 per sq. km) in 2018 (Gao et al., 2021). The landslide problem in this area with its environs is associated with excessive rainfall, particularly during the southwest and northeast monsoon seasons (Tay et al., 2015). In addition, uncontrolled urbanization and deforestation are two causes of multi-slope instabilities (Abd Majid & Rainis, 2019). However, disregarding geological, topographical, and human causes for sustainable development causes landslides (Lee & Pradhan, 2006; Pradhan & Lee, 2010; Tay et al., 2015; Achour et al., 2017; Bounemeur et al., 2022).
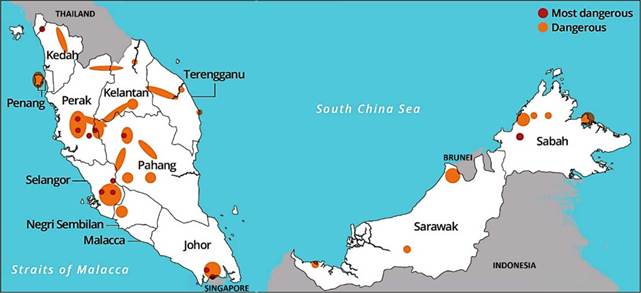
Figure 1 Landslide-prone areas in Malaysia (modified after Habibu & Lim, 2016). The degrees of catastrophes in landslide-prone areas are not drawn to scale.
Consequently, the topographic relief and the nature of the soil-rock conditions of Penang Island, which is underlain by granitic rocks, with extensive mountainous hills in the central part are issues of concern (Ong, 1993; Lee & Pradhan, 2006). In addition, the area's yearly high rainfall and hot weather aid the progressive weathering of the soil-rock profiles (Nordiana et al., 2013; Bery, 2016; Akingboye & Bery, 2022). Hence, landslides could be triggered due to oversaturation under heavy downpours, particularly in places close to the hills without proper land mitigations (Ab Talib, 2003; Alkhasawneh et al., 2013). As urbanization and land use practices are a progressive phenomenon in the study area and its environs, adequate information on surficial and subsurface landslide-prone zones would prevent landslides catastrophic events. This is because studies have proven that many landslides are triggered by climate change and human activities due to changes in land use and landforms (Alkhasawneh et al., 2013).
Over the last few decades, many studies on landslides using Geographic Information Systems (GIS), remote sensing, and multi-geophysical methods have been conducted in Penang Island, Malaysia. For instance, Ab Talib (2003), Lee & Pradhan (2006), and Tay et al. (2015), among others, have applied probabilistic and statistical methods, such as the analytical hierarchy process (AHP), ordinary least square (OLS), neuro-fuzzy and more. Remote sensing data could be used to detect geological structures associated with landslides (Lee & Pradhan, 2006; Pradhan & Lee, 2010). Application of optical remote sensing data for structural geology mapping has been much more limited in tropical environments, due to the persistent cloud coverage, scarcity of bedrock exposures, and vegetative ground cover (Pour & Hashim, 2015). Most of the geological structures and those associated with suture zones, even under dense vegetation cover for large inaccessible regions, could be detected via remote sensing data. This is because the advances in remote sensing technology have made it possible to obtain more useful geological structural information from the ground in dense tropical rainforests due to its penetration capability (Shimada & Isoguchi, 2002; Faruwa et al., 2021).
Moreover, some studies on landslides in the area used different analytical techniques, such as statistical index (SI) and landslide nominal susceptibility factor (LNSF), e.g., (Ab Talib, 2003; Lateh et al., 2011; Alkhamaiseh et al., 2018; Gao et al., 2021). However, Tay et al. (2015) proved that the frequency ratio (FR) model has a high accuracy compared to those methods. Additionally, in understanding the spatial variability of surficial and subsurface soil-rock conditions of Penang Island, many geophysical methods such as electrical and seismic refraction methods, with soil and rock mass test analyses, have also been conducted, e.g., (Pradhan & Lee, 2010; Bery, 2016; Abdullah et al., 2020; Akingboye & Bery, 2022, 2023). These studies indicate that soil behavior is a complex phenomenon related to various causative geologic hazards. Consequently, a single technique would not be sufficient to provide the required diagnostic subsurface information on soil behaviors in such landslide-prone areas. An integrated data- and image-driven approach is expected to provide detailed information on the landslide-triggering factors as related to soil-rock conditions, especially in wet tropical terrains with evidence of repeated landslides.
Given the above, remote sensing data on landslides in Penang Island from 2001 to June 2021 were acquired and used for this study to update the landslide susceptibility map of the area. Moreover, geophysical methods involving electrical resistivity tomography (ERT) and seismic refraction tomography (SRT), including time-lapse ERT (TLERT), were carried out at Penang Island's suspected landslide susceptible area. In addition to these methods, satellite-derived gravity data were also used. This integrated approach has not been adopted for landslide studies in the environment. It is expected that these methods would provide detailed insights into understanding the near-surface soil-rock profile, structures, and geohydrodynamic systems that could induce landslides in the study area. The study will also serve as a crucial scientific report to prevent, mitigate, and curtain the occurrence of landslides in the area and other tropical regions with comparable topographic and geologic features.
2. Study area and its geological settings
2.1 Study area
Penang is one of the 13 states of the Federal Territory of Malaysia. Penang Island (Fig. 2a), also known as Pulau Pinang, and the Seberang Perai (formerly the Province of Wellesley), are the two main subdivisions of Penang. Penang Island, the study area, is connected to Peninsular Malaysia by a 13.5 km bridge. It falls within latitudes 50 15' - 50 30' N and longitudes 1000 1 0'- 1000 21' E (Fig. 2a-b), covering an approximate area of 293 km2. It has an elevation of 0 to 820 m above mean sea level, as shown by the Digitized Elevation Model (DEM) in Fig. 2b, with a gradient from 0° to 67°. From the yearly precipitation, data records gathered from 2001 to 2021, the average temperature of Penang ranges from 25 °C to 32 °C (Fig. 2c), and annual precipitation of 54.7 mm to 240 mm per month, e.g., Fig. 2d (World Weather & Climate Information, 2022).
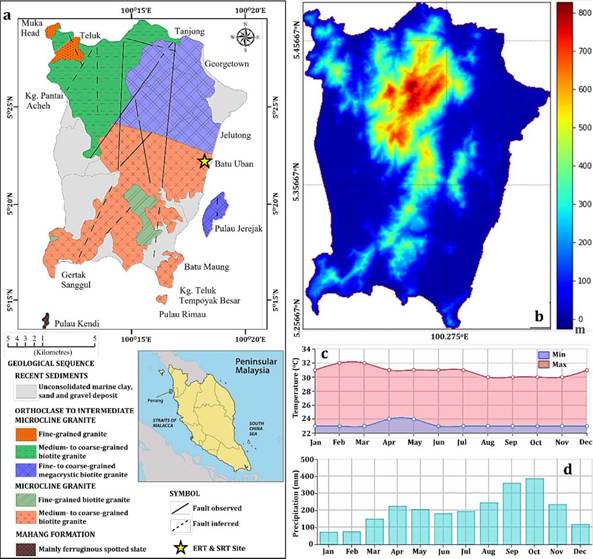
Figure 2 (a) Geological map of Penang Island, Malaysia (modified after Ong, 1993). Inset: Location map of Peninsular Malaysia showing Penang Island. (b) Digitized Elevation Model (DEM) (extracted from Gao et al., 2021), (c) average monthly temperature chart, and (d) average monthly precipitation chart of Penang Island, Malaysia (extracted from World Weather & Climate Information, 2022).
2.2 Geological settings
Malaysia Peninsula is of two conjugated Late Triassic tectonic terranes, viz., the Western Sibumasu Terrane and the Eastern Sukhothai Arc (Metcalfe, 2013a, 2013b; Pour & Hashim, 2015). These tectonic terranes are located at the southeast margin of the Eurasian continent, and they were formed during the Permian-Triassic period by the merging of the Sibumasu and Indochina Blocks along the Bentong-Raub Suture Zone (Metcalfe, 2000, 2001, 2013b). The suture zone and Lebir faults divide Peninsular Malaysia into the Western Belt, Central Belt, and Eastern Belt (Metcalfe, 2001). The Central Belt consists of limestone, shale with subordinate sandstone, siltstone, and conglomerate, with Late Carboniferous-Early Permian age (Pour & Hashim, 2015). The granitoids, typically granite, make up about 90% of the plutonic rocks in Peninsular Malaysia (Ng et al., 2015).
Penang is a mountainous granitic island centrally in a north-south direction, with a low-lying plain situated on both the eastern and western coasts of the island. The granitic outcrops are exposed due to tectonic uplift during the Oligocene-Miocene period (Ong, 1993). The author reported a major fault system striking roughly N-S that is evident in the island's two granitic plutons, namely the North Penang Pluton (NPP) and the South Penang Pluton (SPP), Figure 2a. The classifications were based on the differences in the proportion of alkali feldspar to total feldspar (Ong, 1993).
Penang Island is characterized by the Gula, Beruas, and Simpang Formations (Hassan, 1990), which are the derivatives of the underlying granitic rocks (Ong, 1993), Fig. 2b. The NPP rocks are subdivided into different groups, namely the Tanjung Bungah, Paya Terubong, and Batu Ferringhi groups, as well as the Muka Head micro granite (Ong, 1993). The medium to coarse-grained biotite granites of Tanjung Bungah was formed in the Early Jurassic. The medium to coarse-grained biotite granite of the Paya Terubong group was formed in the Early Permian to Late Carboniferous. The Early Jurassic Batu Ferringhi group comprises medium to coarse-grained biotite granites. The SPP is the Batu Maung granite, with microcline feldspar, and the Sungai Ara granite.
3. Methods
This research aims to produce, validate, and improve the landslide susceptibility map of Penang Island, using different landslide inventories and itemized causative factors from remote sensing and multi-geophysical datasets. The methodological approaches are geared toward mapping the landslide susceptibility indices via 2-D spatial remote sensing mapping. The remotely sensed causative factors datasets were analyzed using the frequency ratio (FR) approach to develop a landslide susceptibility map, and the results were co-interpreted with the multi-geophysical models. The employed multi-geophysical methods include ERT and SRT, with the TLERT, and satellite-derived Bouguer gravity modeling. The results derived from the use of remotely sensed causative factors are supported by strong surficial-to-subsurface soil-rock conditions and their integrity as well as water-rock interaction and soil-water/moisture monitoring from geophysical modeling. This combined help to delineate subtle near-surface and deep crustal features to target landslide-induced mechanisms.
3.1 Remote sensing data acquisition procedures, correction, and processing
Landslide susceptibility evaluation is very crucial for probabilistic analysis of landslide indices and their occurrence. To this end, remote sensing is one of the approaches used for mapping landslides. According to Gomes et al. (2013) and Tien Bui et al. (2018), datasets such as lithological (including soil) maps, rainfall data, DEM, and satellite imageries are essential in preparing landslide inventories, selecting landslide causative factors, and constructing the spatial database for landslide predictions. Hence, the lists of datasets acquired over two decades (2001 to 2021), as presented in Table 1, including aerial photographs and satellite images, were used and analyzed to map landslide indices at Penang Island (the study area). The datasets used comprise 100 satellite imageries retrieved from Landsat 7 ETM+ and Landsat 8 Operation Land Imager (OLI) satellite imagery websites, including Google Earth (Table 1). Landsat datasets can provide high-resolution spectral bands for monitoring land use and capturing land change due to climate change, urbanization, drought, wildfire, biomass changes, and different natural and human-induced changes at drastically reduced costs.
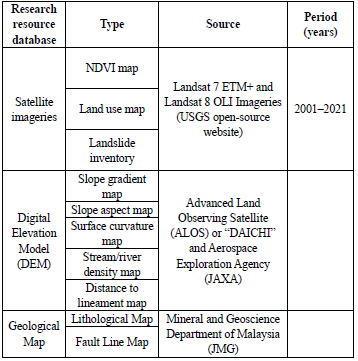
To effectively map landslides in the study area, landslide causative factors, namely geology (lithologies and structures), topography (slope steepness, slope angle, curvature, and orientation), vegetation cover (NDVI), and land use datasets (Table 2), were leveraged. This is because the causative factors, particularly topography, geology, and land use, including weather conditions and anthropogenic factors, control the degree and distribution of landslides (Khan et al., 2019). After acquiring the remote sensing datasets, they were grouped as thematic maps and geological hazard maps (Table 2). Some of these datasets are on the scale of 1:10,000 to 1:150,000, while some are in spatial resolution dimensions of 30 m x 30 m based on the numbers of grids, polygons, lines, and points.
Table 2 Summarized classification of the remote sense data layer for the study.
| Classification | Sub-classification | GIS data type | Scale |
|---|---|---|---|
| Thematic map | Topography | Line, point, and polygon | 1:50,000 |
| Geology | Polygon | 1:50,000 | |
| Land use | Grid | 30 m x 30 m | |
| Vegetation Index | Grid | 30 m x 30 m | |
| Lineament | Line | 1:50,000 | |
| Geological hazard map | Landslide susceptibility | Point | 1:50,000 |
The modeling of the study area's topographic features was based on slope, surface curvature, stream/river density, and distance to lineament data, including DEM, acquired from the Japan Aerospace Exploration Agency (JAXA). On the other hand, the geological map that depicts lithologies and faults/fractures in the study area was acquired from the Mineral and Geoscience Department of Malaysia (JMG). Upon acquisition, the maps were correlated with existing geological maps of the study area, e.g., (Ong, 1993). It is important to note that DEM serves as a foundation upon which many landslide causative factors could be determined (Komac, 2006).
Afterward, Landsat data corrections and reductions were performed using the FLAASH Atmospheric Correction Module in ENVI software. FLAASH is an acronym for Fast Line-of-sight Atmospheric Analysis of Hypercubes. It is a first-principles atmospheric correction tool that corrects wavelengths in the visible through near-infrared and shortwave infrared regions, up to 3 µm (Yuan & Niu, 2008). It is compatible with most hyperspectral and multispectral data. The purpose of atmospheric correction is to eliminate the influence of the atmosphere, return the reflectance value of the actual object on the earth's surface, and rectify images taken in vertical (nadir) or slant-viewing geometries (Ilori et al., 2019). In addition, it removes the scattering and absorption effects from the atmosphere to obtain surface reflectance properties. The gapfill interface in the software was also used to fill the gaps (wedge-shaped gaps) in the Landsat images. A band combination of 6,5,2 for Landsat datasets was used because it discriminates between vegetation and bare land. This band combination uses a shortwave-infrared band [SWIR-1] (6), near-infrared (5), and blue (2).
3.2 Modeling landslide causative factors and landslide susceptibility
The spatial database for causative factors was developed using spatial analytical tools in both ArcGIS (v10.8) and ENVI software. The treated landslide causative factors include lithology, slope gradient, slope aspect, surface curvature, stream/river density, distance to lineament, normalized difference vegetation index (NDVI), and land use/cover. After careful evaluations of the Landsat datasets acquired from 2001 to 2021, the most recent Landsat 8 OLI data (2021) was used to evaluate the landslide causative factors. A 5-m resolution of Advanced Land Observing Satellite (ALOS) DEM from JAXA was used to model the landslide causative factors: lithology, slope gradient, slope aspect, surface curvature, stream/river density, and distance to lineament, using ArcGIS software. Based on the sub-classifications of landslide causative factors in Table 2, the analyzed datasets were transformed into raster maps with the same coordinate system and pixels. This way, detailed insights into how each of these parameters contributes to landslide occurrence were gained, including a proper understanding of the area's landslide mechanisms.
The slope aspect technique, or the orientation of a slope, expressed in degrees or compass directions, controls the slope's exposure to climatic conditions such as sunlight, wind direction, rainfall, etc (Komac, 2006). Slope steepness is a risk factor associated with most soil profiles influencing slope stability. This is because the steeper the slope, the greater the probability of landslides occurrence due to gravity influences (Kornejady et al., 2018). The slope aspect also has a significant impact on vegetation cover, moisture retention, and soil strength. Similarly, slope gradient provides significant information on the rate of surficial soil erodibility and their sliding potential (Ab Talib, 2003). Also, the degrees of surface curvature, distance to lineament, and stream density are significant factors that must be ascertained in landslide study as they mitigate or adversely induce landslide occurrence. For instance, the force of gravity increases on a steeper slope as the shear stresses in loose soils or unconsolidated materials increase (Bery, 2016; Khan et al., 2019). Most landslides are associated with areas of high river/stream and those close to lineaments.
Furthermore, the NDVI of the study area was produced after FLAASH atmospheric corrections via ENVI, based on Eq. 1, and the resulting map was also generated to depict the area's vegetation distribution and their contribution to landslide occurrence.

Where R and NIR imply the spectral reflectance measurements acquired in the red (visible) and near-infrared regions, respectively. Generally, if there is much more reflected radiation in near-infrared wavelengths than in visible wavelengths, then the vegetation in that pixel is likely to be dense and may contain some type of forest. NDVI is directly related to the photosynthetic capacity and hence energy absorption of plant canopies (Myneni et al., 1995). Low NDVI values indicate moisture-stressed and sparse vegetation while higher values indicate a higher density of green healthy and dense vegetation (Gessesse & Melesse, 2019). This parameter can be negative, even in densely populated urban areas and the NDVI is usually of a (small) positive value. Negative values are more likely to be observed in the atmosphere and some specific materials (Myneni et al., 1995).
To adequately analyze the land use factor, seven land uses namely forest, waterbody, urban area, cultivated land, dry paddy, wet paddy, and cleared land, were classified from the derivation of the land use map based on supervised classification associated with the Maximum Likelihood of Landsat 8 OLI multispectral imaging (Abdelouhed et al., 2021). The classification provided significant insights into land use, and in turn, serve as clues in understanding the landslide-triggering mechanism in the study area. It is worth noting that slope instability can result from a change in land use due to human activities such as deforestation, overgrazing, excessive farming, slope cutting, construction, etc.
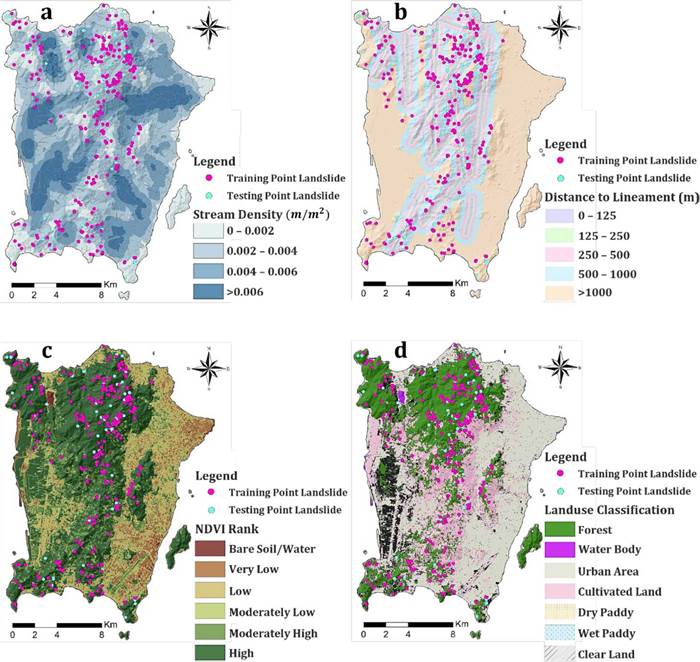
The propensity of landslides to occur in an area is a critical evaluation, especially in the study area with an extensive hilly interior that is surrounded by low valleys and coastal plains. Hence, frequency ratio (FR) was used in the quantitative modeling of landslide occurrence and its damaging potential. FR is one of the quantitative techniques used for calculating the ratio of probabilities of landslide occurrence to non-occurrence for given causative factors using the GIS approach. To obtain the FR for each causative factor, the weight or FR of each element is obtained by dividing the total landslide-prone area by the total area coverage of each causative factor based on Equation 2 (Lee & Pradhan, 2006; Bounemeur et al., 2022). In addition, to develop the area's landslide susceptibility index (LSI), the correlation rating of each landslide causative factor (LCFR) was estimated from the relationship between a landslide and each causative factor. LCFR value estimated for each element was summed based on Equation 3, e.g., (Ab Talib, 2003; Khan et al., 2020). In general, landslide mapping and observations in the landslide causative factors derived results and maps were based on the interpretations of breaks in the forest canopy, bare soil, and other geomorphic characteristics, including landslide head and side scars, flow tracks, and debris deposits below the scars.
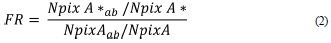
Where FR is the frequency ratio of each causative factor.
Npix A * ab is the number of pixels of area of the observed landslide of class a of parameter b.
Npix A ab is the number of pixels of area of class a of parameter b.
Npix A *is the number of pixels of the total area of the observed landslide.
Npix A is the number of pixels of the total area of the map.
Following the derivation of the maps for landslide causative factors, all the maps were integrated to map landslide-prone sections in the study area. In total, 340 landslides within 293 km2 were mapped and observed in aerial photographs based on the analysis and interpretation of the aforementioned geomorphic characteristics. All landslides were verified using Google Earth, ensuring that they are not misconstrued with agriculture areas such as terrain slope agriculture or dry paddy land. To achieve and accurately map the landslide susceptibility indices in the study area, predictive modeling was utilized. According to Kornejady et al. (2018), landslides are of different types including falls, rotational and translational slides, earth flows, complex, and creeps due to various predisposing factors. It is, therefore, recommended to treat landslides separately. This, however, is impossible because different landslide kinds share the same factor importance ranking, particularly top-ranked factors. As a result, the total landslides mapped were divided into a set of training (80%) and testing data (20%). The training data were used for constructing the predictive models while testing data were used to validate the models to ascertain the accuracy of the mapped landslide indices.
The accuracy of the landslide susceptibility index (LSI) map was assessed using a method known as the area under the curve (AUC) proposed by Lee & Pradhan (2006). The rate curve was created to explain how well the technique predicted intended landslides. The AUC graph represents the quality and accuracy of the model used to classify landslide occurrence. To have a success rate, index values of all the landslide pixels from the LSI map were calculated and reclassified into 100 classes. The outcome data were plotted as a graphical model, with an accumulated 1% interval for the true positive rate on the Y-axis against the false positive rate results which could reveal the relationship between the true positive and false positive rates on the X-axis (Biggerstaff, 2000).
3.2 Geophysical field data measurements and processing
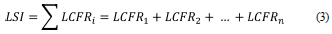
A combination of two ground-based geophysical methods (ERT and SRT) was carried out at a suspected landslide site on the main campus of Universiti Sains Malaysia (USM), Fig. 3a, due to its landscape gradient. The methods investigate the subsurface heterogeneous soil profiles and geologic structures that could trigger landslides. The infield ERT and SRT surveys lasted three months, from January to March. The periods are remarkable for their appreciable sunshine and high downpours. Generally, resistivity and seismic refraction techniques are the most used geophysical methods to investigate subsurface soil-rock conditions. For the resistivity method, the result mainly depends on the variations in resistivity factors in which soil water content plays a significant role (Kherrouba et al., 2019, 2022; Zakaria et al., 2022). However, SRT is influenced by subsurface seismic P-wave velocity (Vp) variations and can be interpreted based on the measured range of velocities (Dahlin & Wisén, 2018).
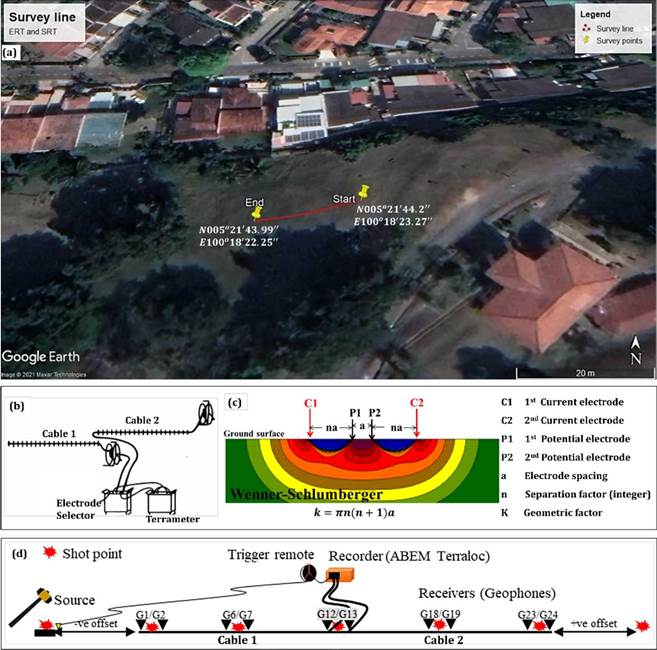
Figure 3 (a) Aerial data acquisition map of the studied site for ERT and SRT data measurements. (b) A typical 2-D layout and setup for a two-cable reel resistivity measuring system. (c) A typical schematic diagram of a 2-D Wenner-Schlumberger ERT acquisition layout with its subsurface sensitivity pattern. (d) A typical schematic diagram of a 2-D SRT acquisition layout.
A single geophysical survey line in approximately NE-SW direction for both ERT and SRT measurements was established at a landslide-suspected section within USM, as a monitoring site (Fig. 3a). The profile for the ERT and TLERT was 22 m while that of the SRT was 23 m long. The ABEM SAS Terrameter 4000 was used for the ERT survey (Fig. 3b), employing the Wenner-Schlumberger array (Fig. 3c) with a 0.5 m station spacing. The Wenner-Schlumberger array configuration is more sensitive to horizontal and vertical structures than the Wenner and dipole-dipole arrays. Besides, it has a deeper depth penetration than a narrower model (Loke, 2002; Akingboye & Bery, 2022). The resulting field-measured resistivity datasets were processed and modeled using RES2D software (Loke, 2002), leveraging standard least-squares data inversion constraints based on the finite-element method of four nodes with L2-norm to minimize the difference between the measured and observed resistivities. Also, a damping factor of 0.05, with a minimum value of 0.01, was used to improve the accuracy and resolution of the inversion model. The TLERT models depicting the percentage changes in resistivities for the investigated months were also derived from the same software.
Moreover, the SRT data acquisition was conducted using the ABEM Terraloc Mk 8, employing a channel of 24 geophones at 12 Hz each, a 12-pound hammer, and a striker metal plate (Fig. 3d). The measured Vp datasets were processed by first enhancing weak seismic traces, employing the auto-gain control technique in the SeisOpt@2D software, to amplify the first arrival traveltimes for easy identification and picking. The first arrival traveltimes were picked using the same software from the resulting enhanced Vp datasets. The simulated annealing optimization method, an interface of SeisOpt software, was used to invert the first arrival seismic traces and to generate the resulting Vp models (Zakaria et al., 2022). Ensuring smooth
Landslide susceptibility mapping of Penang Island, Malaysia, using remote sensing and multi-geophysical methods interpretation and detailed landslide susceptibility characterization, the satellite-derived Bouguer gravity anomaly datasets of Penang Island, derived from the Bureau Gravimétrique International (BGI), were modeled using Oasis Montaj software. The gravity method was adopted due to its extensive area coverage, ability to differentiate crustal densities, and deeper depth penetration. The results were co-interpreted with the generated ERT and SRT models for the landslide monitoring site.
4. Results and discussion
4.1 Landslide susceptibility assessment using frequency ratio (FR) model
The derived causative factors for characterizing landslide occurrences in Penang Island, Malaysia, are shown in Table 3. Their 2-D maps were also generated. The relationship between slope gradient and landslide occurrence
is one factor widely used as a landslide-triggering mechanism because they are directly proportional. The digitized lithology map, based on their locations in the study area, as shown in Fig. 4a, was analyzed alongside all the landslides' causative factors models. It is important to note that the steeper the slope, the greater the probability of landslides due to gravity influences (Bery, 2016; Khan et al., 2019). The force of gravity increases on a steeper slope as the shear stresses in loose soils or unconsolidated materials increase. The surface runoff on the steeper slope is higher and faster than on the gentle slope. Hence, the very low landslide occurrence probability is below 5°, with an FR of 0.04. When the FR is greater than 1, significantly above a slope of 15°, it indicates a very high landslide occurrence probability (Table 3 and Fig. 4b). These zones are peculiar to the mountainous sections, especially in the central part. The residential areas are characterized by 20° slope angles, with low to moderate landslide occurrence probability.
Table 3 Causative factors for evaluating landslide occurrence in Penang Island, Malaysia.
| Factor | Class | Total number of pixels | Total number of pixels | Frequency ratio (Fr) | ||
|---|---|---|---|---|---|---|
| Npix A ^ | Npix A* ^ | Npix A * | Npix A | |||
| Slope gradient | 0° - 5° | 113198 | 33.59 | 5 | 1.47 | 0.04 |
| 5°- 15° | 76827 | 22.80 | 63 | 18.53 | 0.81 | |
| 15° - 25° | 83443 | 24.76 | 133 | 39.12 | 1.58 | |
| 25° - 35° | 55066 | 16.34 | 118 | 34.71 | 2.12 | |
| > 35° | 8463 | 2.51 | 21 | 6.18 | 2.46 | |
| Slope aspect | North | 32597 | 9.67 | 37 | 10.88 | 2.26 |
| Northeast | 37162 | 11.03 | 53 | 15.59 | 1.41 | |
| East | 49591 | 14.72 | 68 | 20.00 | 1.36 | |
| Southeast | 47442 | 14.08 | 72 | 21.18 | 1.50 | |
| South | 36386 | 10.80 | 30 | 8.82 | 0.82 | |
| Southwest | 36011 | 10.69 | 23 | 6.76 | 0.63 | |
| West | 46463 | 13.79 | 32 | 9.41 | 0.68 | |
| Northwest | 44402 | 13.18 | 25 | 7.35 | 0.56 | |
| Surface curvature | Convex | 161161 | 47.34 | 138 | 40.59 | 0.86 |
| Flat | 28427 | 8.35 | 9 | 2.65 | 0.32 | |
| Concave | 150846 | 44.31 | 193 | 56.76 | 1.28 | |
| Stream density | 0 - 0.002m/m2 | 91175 | 26.75 | 148 | 43.53 | 1.63 |
| 0.002 - 0.004 m/m2 | 114650 | 33.64 | 140 | 41.18 | 1.22 | |
| 0.004 - 0.006 m/m2 | 89430 | 26.24 | 47 | 13.82 | 0.53 | |
| >0.006 m/m2 | 45610 | 13.38 | 5 | 1.47 | 0.11 | |
| Distance to lineament | 0 - 125 m | 23609 | 6.93 | 35 | 10.29 | 1.49 |
| 125 -250 m | 23681 | 6.95 | 30 | 8.82 | 1.27 | |
| 250 - 500 m | 46075 | 13.52 | 57 | 16.76 | 1.24 | |
| 500 - 1000 m | 76856 | 22.55 | 97 | 28.53 | 1.27 | |
| >1000m | 170590 | 50.05 | 121 | 35.59 | 0.71 | |
| Lithology | Batu Maung Granite | 79237 | 23.25 | 100 | 29.41 | 1.27 |
| Matang Gelugor Member of the Gula Formation | 11093 | 3.25 | 3 | 0.88 | 0.27 | |
| Simpang Formation | 26298 | 7.72 | 1 | 0.29 | 0.04 | |
| Sungai Ara Granite | 8443 | 2.48 | 12 | 3.53 | 1.42 | |
| Parit Buntar Member of the Gula Formation | 13261 | 3.89 | 0 | 0.00 | 0.00 | |
| Beruas Formation | 26877 | 7.89 | 0 | 0.00 | 0.00 | |
| Undifferentiated Fill Materials | 9032 | 2.65 | 0 | 0.00 | 0.00 | |
| Gula Formation, Undifferentiated | 15262 | 4.48 | 0 | 0.00 | 0.00 | |
| Batu Feringgi Granite | 67529 | 19.81 | 84 | 24.71 | 1.25 | |
| Muka Head Granite | 5449 | 1.60 | 8 | 2.35 | 1.47 | |
| Tanjung Bungah Granite | 67045 | 19.67 | 132 | 38.82 | 1.97 | |
| Port Weld Member of the Gula Formation | 11308 | 3.32 | 0 | 0.00 | 0.00 | |
| NDVI | Bare soil/water | 217383 | 38.74 | 0 | 0.00 | 0.00 |
| Very low | 33429 | 5.96 | 1 | 0.29 | 0.05 | |
| Low | 44377 | 7.91 | 2 | 0.59 | 0.07 | |
| Moderately low | 35766 | 6.37 | 10 | 2.94 | 0.46 | |
| Moderately high | 57933 | 10.33 | 94 | 27.65 | 2.68 | |
| High | 172202 | 30.69 | 233 | 68.53 | 2.23 | |
| Landuse classification | Forest | 108438 | 16.43 | 155 | 45.59 | 2.77 |
| Waterbody | 311515 | 47.21 | 0 | 0.00 | 0.00 | |
| Urban area | 111441 | 16.89 | 13 | 3.82 | 0.23 | |
| Cultivated land | 88645 | 13.43 | 137 | 40.29 | 3.00 | |
| Dry paddy | 3987 | 0.60 | 0 | 0.00 | 0.00 | |
| Wet paddy | 31094 | 4.71 | 34 | 10.00 | 2.12 | |
| Clear land | 4722 | 0.72 | 1 | 0.29 | 0.41 | |
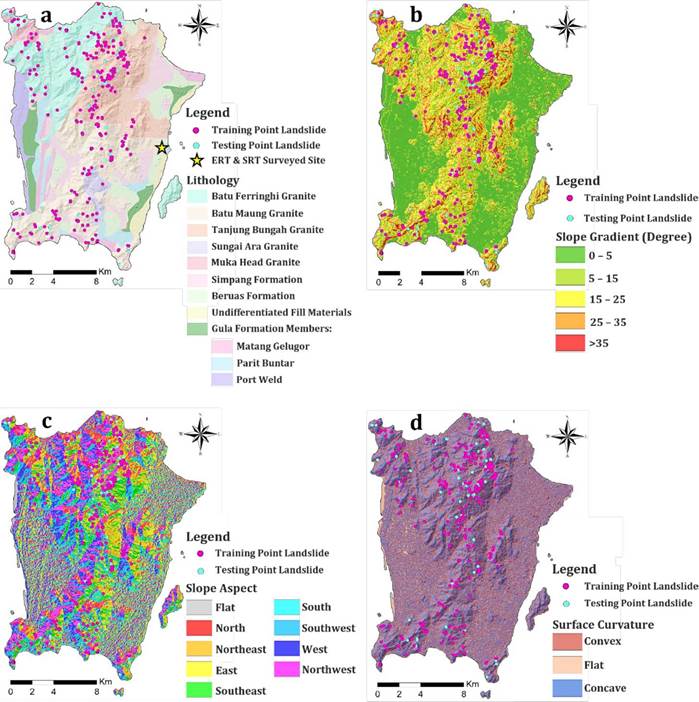
Figure 4 (a) Lithological map, (b) slope gradient map, (c) slope aspect map, and (d) surface curvature map of Penang Island, Malaysia.
Slope aspect and surface curvature are also essential factors to be considered for the occurrence of landslides. According to Carrara et al. (1991) and Wan Mohd Muhiyuddin (2005), a sloppy surface facing sunlight is dried compared to the one prevented. The latter is responsible for most landslides due to wet or moist conditions. In this study, the highest FR values (Table 3) dominate areas in the north, followed by the southeast and northeast (Fig. 4c). Meanwhile, the curvature of the slope, representing the surface morphology, is usually parallel to the hill, hence, affects the acceleration or deceleration of water flow. A positive value indicates a sloppy concave surface with an accelerated flow. A negative value represents a sloppy convex surface with declining water flow, while a neutral value (i.e., zero) indicates a flat surface. As shown in Table 3 and Figure 4d, the FR value of 0.86 indicates a convex surface with the greatest possibility for landslide occurrence in the event of a heavy downpour due to repeated dilation and contraction. As a result, loose debris on an inclined surface is prone to induced soil creep or mudslides which could also contribute to landslide reoccurrence at existing location. Whereas a concave slope, with an FR of 1.28, will retain water for a longer period (Alkhasawneh et al., 2013).
Stream densities and distance to lineaments also play a part in the occurrence of landslides. The closer a region is to streams and lineaments, the greater the likelihood of a landslide occurrence. This is because the stream will erode the slope base and saturate the underwater part, resulting in gully erosion and terrain alteration. Table 3 reveals that most landslides occur at a density of 0-0.002 m/m2 for streams, corresponding to distances 0-125 m from lineaments (Fig. 5a-b). The comparison of Table 2 and Fig. 4a indicates that the highest FR of landslide is associated with the rocky igneous area, with Tanjung Bunga Granite at FR of 1.97. Followed by Muka Head Granite, Sungai Ara Granite, and Batu Maung Granite with FR values of 1.47, 1.42, and 1.27, respectively. In the case of the Vegetation Index (NDVI), as shown in Table 2 and Figure 5c, the NDVI values ranging from 0.6-0.8, with the highest FR of 2.68, indicate the possibility of moderately high to high landslide occurrence. The NDVI values of 0.4 (and below) are indications of low landslide occurrence. The results suggest that a low NDVI increases the likelihood of landslides. Most of Penang Island's areas with thick forests are found on steep sections (Fig. 5c). As a result, the slope instabilities could be triggered by human activities such as deforestation, overgrazing, intensive farming, slope cutting, slope agriculture, construction, and more. Most landslides will occur in cleared and cultivated areas (Bukit Bendera and the western section), with the highest FR of 2.68 (Table 3 and Fig. 5d).
4.2 Interpretation of geophysical methods at the landslide-suspected area
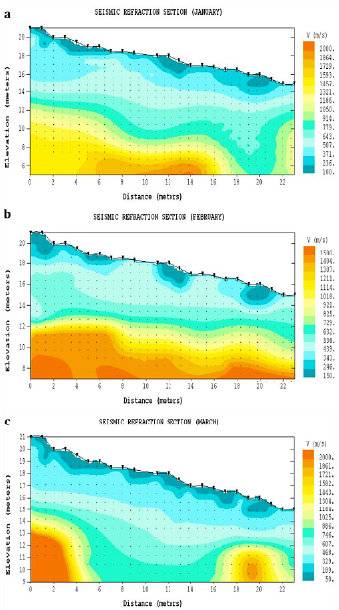
Based on the ERT results derived from the test site from January to March during the northeast monsoon season, the subsurface lithological conditions are characterized by saturated and unsaturated residual soil profiles (rich in clayey sand) with resistivity values of 5-300 Ωm and >300 Dm, respectively (Fig. 6a-c). The saturated bodies are extensive, occurring within the motley topsoil with interspersed stiff-to-hard soils (highly varied in resistivity) and granitic boulders (>1000 Ωm), Fig. 6a. In February (Fig. 6b), the water-retention level in some subsurface constituents tends to be lower than it was for the other two months. On the other hand, the SRT models (Fig. 7a-c) also depict corresponding responses, whereby the residual soil profile across the investigated site varies from 50-800 m/s, the weathered granitic layer has Vp values of 800-2000 m/s, while the integral/fresh granitic bedrock is characterized by >2000 m/s. From January to March, significant changes in the Vp values of the residual soil and weathered layers were observed (Fig. 7a-c), especially between station distances of 4 m and 18 m in Fig. 7c with an identifiable extensive deep-weathered trough. The observed variations are attributed to varying soil composition, rock structures, and degree of weathering and water affinity.
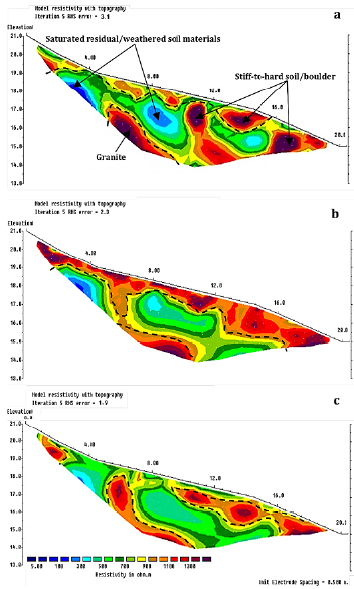
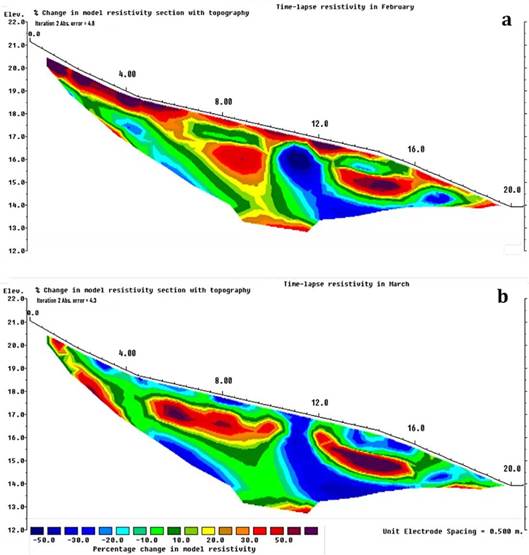
The observed variations in geophysical signatures were also clearly interpreted by the percentage changes in measured resistivities between January and February (Fig. 8a) and in March (Fig. 8b). These models show the changes in the water saturation level beneath the investigated area. The residual soil and the weathered sections (between stations 10 m and 12 m) are greatly impacted by saturating water, stretching to the station position of 6 m beyond (Fig. 8a-b). Based on Figures 6-8, the principal landslide triggering mechanism, for instance, is the extensive saturated residual and weathered soil profiles with >40% resistivity changes (extending to depth >15 m). As a result, the identified section and other steep contractive soil (silt/clay) sections may be subjected to intense soil creep and sliding. This is because soil creep and dissolution are enhanced by soil-rock configuration and water affinities (Bery, 2016; Zakaria et al., 2022).
4.3 Interpretation of satellite-derived gravity model of Penang Island
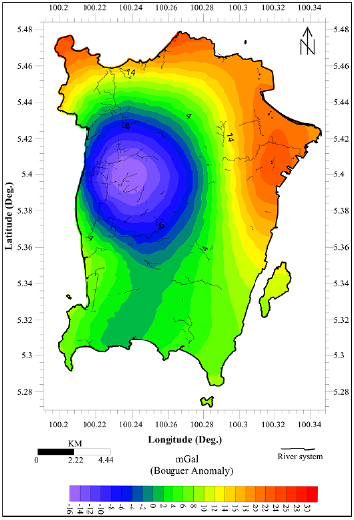
To further strengthen the interpretations of the study, the satellite-derived Bouguer gravity anomaly map of Penang Island (Fig. 9) was developed to comprehensively depict the lithological conditions and embedded geologic structures which could trigger landslides. The derived Penang Island's Bouguer anomaly map is characterized by negative and positive gravity anomalies ranging from -16 to >30 mGal. The negative Bouguer gravity values gradually attain positive values as one progresses toward the low-lying areas. The high positive Bouguer anomalies ranging from >2-30 mGal dominate the largest portion of the study area. The conspicuous central quasi-ring negative Bouguer gravity anomaly with its parts stretching southward depicts the section dominated by the mountainous granitic rocks because such features are characterized by varied mass compared to surrounding lithologies as well as effects associated with tectonic uplift, mineral composition, and structural complexities (Balogun, 2019; Okpoli & Akingboye, 2019, 2020). Gravity attraction on the hill mass due to isostatic imbalance may also reduce gravity (Balogun, 2019).
The studied site within USM for monitoring the nature and degree of surficial and subsurface soil-rock profiles and hydrodynamics of a typical steep section has Bouguer gravity values between 14 and 18 mGal. Potential lineament and/or drainage features were also mapped, as shown by trending black lines in Figure 9. The varied lithological conditions of the area as observed in the Bouguer gravity model (Fig. 9) also affirm the near-surface features identified in the ERT and SRT models for the monitoring site (Figs. 6-8). Comparing the Vp and resistivity results obtained at the suspected landslide sites (Figs. 6-8) and those of Figures 4-5 with Figure 9, the sections with the negative Bouguer gravity anomalies (-16 to 2 mGal) may be identified as landslide-susceptible zones due to their topography reliefs (Fig. 2b) as well as soil profiles and shallow lineaments. Consequently, slope failure may be imminent at landslide-suspected sections due to intense soil creep, especially at steep slopes with contractive soils (silt/clay) and water-escape structures (Zakaria et al., 2022).
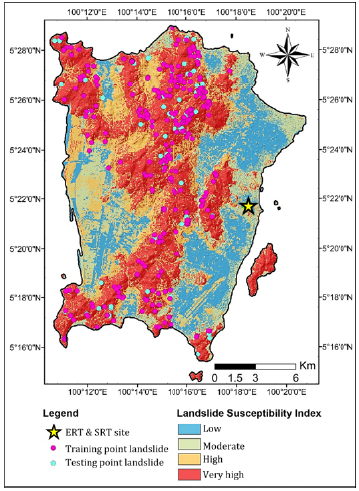
4.4 Landslide susceptibility index and modeling
To have a detailed update and understand the landslide susceptibility of the study area, a landslide susceptibility index (LSI) map is needed. This was achievable from the summation of all causative factors, and the resulting LSI map of Penang Island is shown in Figure 10. Based on LSI estimates from Equation 3, the region is characterized by values ranging from 2.46 to 9.23, with a standard deviation 2.37. The range of values depicts the susceptibility indices for the area. Hence, the observed and predicted landslide-susceptible areas (with moderate to very high LSI) fall on the hilly and elevated sections, especially sections with contractive silty/clayey soils and poor ground mitigation. Whereas the less susceptible sections are places with flat topographic reliefs. These results also conform with the interpreted results in Figs. 4-9, hence validating the accuracy of the methods employed and their generated results to accurately predict future landslides in the study area.
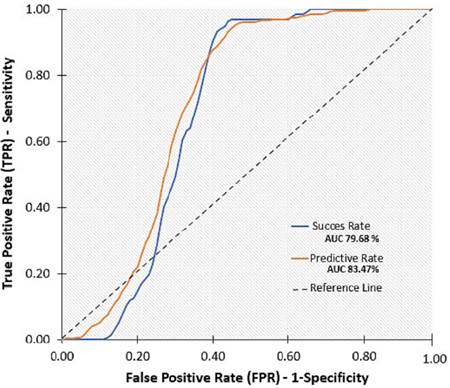
The LSI result was also verified based on the AUC model (Fig. 11) using pixels from the LSI map. This approach evaluates how successfully the LSI map matched the occurrence of landslides. The success rate curve was derived using testing point landslide datasets, whereas the predictive rate curve was derived from training point landslide datasets. The AUC is a graph that displays varying index numbers, often between maximum values of 1 equal 100%, and a value of 0.5 that equals 50%. AUC is one kind of accuracy metric used to predict, evaluate, or interpret natural disaster models (probabilities). A score between 0.8 and 0.9 is considered to be good and is an excellent classification, a score of 0.7-0.8 is a moderate or decent classification, and a score of less than 0.6 is an inadequate classification. As observed in the AUC model, the success rate shows the model's ability to consistently categorize the occurrence of existing landslides, whereas the AUC of the predictive rate illustrates the proposed landslide model's ability to anticipate landslide susceptibility (Pamela et al., 2018). Based on Fig. 11, the AUC prediction accuracy is 0.8347, translating to a prediction accuracy of 83.47%. On the other hand, the ratio for the success rate is 0.7968, indicating a prediction accuracy of 79.68%. This accuracy assessment is slightly higher than that of Khan et al. (2019). As a result, there is a higher chance of landslide occurrence at the identified sections in the future and even at previously reported sections with no ground mitigation.
5. Conclusions
This study has demonstrated the efficiency of combining remotely sensed analytical models via the FR technique with the results of multi-geophysical methods (ERT, SRT, and satellite-derived gravity) to generate and update the landslide susceptibility map of Panang Island, Malaysia. Based on the results of the analyzed remotely sensed causative factors for the study area, the slope gradient and cultivation land factors are the most influential landslide causative factors, where most of the landslides are likely to occur in the northern and southern parts. This is also supported by the interpretive assertions made from the ERT, SRT, satellite-derived Bouguer gravity, and LSI models/maps of the study area.
Comparatively based on these analyzed models/maps, prospective landslides were pinned on the hilly and elevated sections, especially sections with varied contractive soils and shallow structures, while the less susceptible sections were identified on flat topographic reliefs. On that account, the possibility of landslides occurring at the investigated monitoring site and other identified sections is high as suggested by the predictive AUC modeling of LSI data. Though this study does not fully leverage some necessary enhancement gravity techniques to delineate shallow to deep crustal structures attributed to regional crustal deformation, it has provided helpful recommendations in planning future urban development and mitigating the occurrence of future landslides in the study area.

