1. Introduction
Soil compaction is fundamental to improving the geotechnical characteristics and behavior of soils used in natural and engineering structures. Therefore, an evaluation of compaction characteristics is needed to maintain the long-term performance of these structures (Powrie, 2009). However, soil compaction is a function of key compaction variables such as MC, DUW, and E levels employed. In geotechnical testing, Standard Proctor SP ASTM D698 (2012) and Modified Proctor MP ASTM D1557 (2012) compaction tests have been developed to evaluate soil compaction characteristics. In these laboratory tests, compaction curves, which relate to MC and DUW are derived, from which OMC and MDUW are determined and used to monitor field compaction specifications.
In practice, the available methods for measuring MC of soil, such as the oven drying method and soil probes (Robinson et al., 2008), and for calculating DUW of soil such as nuclear density gauge and sand cone methods (AL-Shammary et al., 2018), are destructive and time-consuming. Therefore, there is a continuous need to introduce quick and efficient methods to evaluate these parameters, preferably in a low-cost and non-destructive manner (Beck et al., 2011; Melo et al., 2021).
Indirect geophysical methods, such as the ER method, have frequently been used as a non-invasive, quick, and cost-effective tool to address hydrogeological (Al Farajat et al., 2015), geotechnical (Farooq et al., 2012), underground mining and tunneling (Ebrahimi and Abbasinia, 2015; Ebrahimi et al., 2016), and environmental problems (Srinivasamoorthy et al., 2009; Moghaddam et al., 2017; Ebrahimi et al., 2021).
As electrical conduction is mainly controlled by pore water and the air is infinitely resistive, it has been reported that the ER is influenced, among other variables, by MC and DUW (Seladji et al., 2010; Kibria and Hossain, 2012). Numerous studies have reported a non-linear (power, polynomial, or exponential) relationship between ER and MC; the higher the MC, the lower the ER (Calamita et al., 2012). As the moisture state of soil can be expressed in terms of MC, 0, or Sr, some of these studies correlated ER with MC (Memon et al., 2017; Bery et al., 2018), while other studies correlated ER with 0 (McCarter, 1984; Singh and Shah, 2015) or with Sr (Abu-Hassanein et al., 1996; Hassan and Toll, 2015).
The compaction of soil increases its dry density (or DUW) and reduces its void ratio. Therefore, it was reported that increasing the DUW of soil reduces its ER, especially in drier conditions (Beck et al., 2011; Bai et al., 2013). However, Qiu et al. (2021) emphasized that MC has a greater impact on ER than DUW when the soil is compacted at low moisture levels. Roodposhti et al. (2019) evaluated the influence of moisture content and compaction on construction materials.
Several studies have highlighted the effect of E levels on ER of soil. For instance, Hassan and Toll (2015) and Alibrahim and Uygar (2021) noticed that increasing compaction energy reduces air voids, hence, lowering ER, and this influence is insignificant for soils compacted at high MC levels. Similarly, Melo et al. (2021) found that the ER-MC relationship is strongly influenced by compaction, particularly in drier conditions, due to the predominant effect of MC on the ER of soil. Geotechnical-geoelectrical correlations discussed in the literature have shown that the ER method is useful for predicting different geotechnical properties (Bryson, 2005; Siddiqui and Osman, 2013).
However, previously published studies have shown that the ER of compacted soils is affected by various interlinked variables that should be addressed simultaneously (Hassan and Toll, 2015) and the influence of MC and DUW on the ER has rarely been distinguished in the literature (Beck et al., 2011).
Therefore, the main interest of this work is to investigate the influence of MC and DUW in addition to E levels on the ER of compacted fine-grained soils. To achieve this goal, soil specimens collected from the east of Baghdad city were prepared and mechanically compacted at different ranges of MC and DUW using five E levels. The influence of these interlinked variables on the ER characteristics was addressed separately, and the geotechnical-geoelectrical relationships between ER and different geotechnical variables such as MC, DUW, E level, e, 0, and Sr were developed and discussed according to the microstructural changes of soil due to the compaction process.
2. Materials
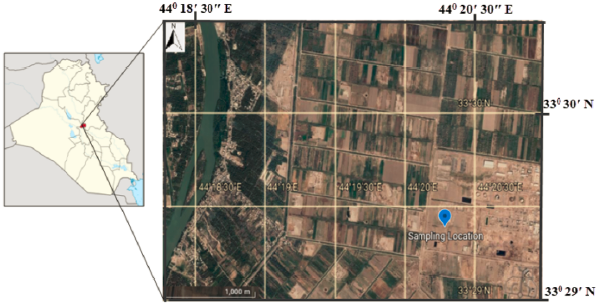
This study was conducted on soil specimens collected east of Baghdad city (Figure 1). Baghdad is located on the Tigris River; therefore, the city is covered by recent heterogeneous alluvial deposits accumulated in the Mesopotamian plain due to repeated floods of the rivers Alshakarchi and Turkie (2011). The soil is a landfill material that can be distinguished into two layers; the top one consists mainly of clay, or brown silty clay, or clayey silt with some sand, or gravel; whereas the bottom one consists of dense sand mixed with gravel, or lenses of fine-grained clay or silty clay (Karim and Wadaa, 2017).
Soil specimens collected from the area were properly secured in plastic bags and brought to the lab for testing. Thirty-five specimens were prepared and compacted at different MC, DUW, and E levels, as discussed in the next section.
3. Methods
After soil sampling, laboratory tests were carried out to characterize the soil used in this study based on the ASTM standards shown in Table 1. ASTM D422 (2002) was used to determine the grain size distribution. In this test, the oven-dried soil was poured above a stack of standard sieves for 15 minutes, and the mass retained on each sieve was determined to obtain the percentage of coarse-grained particles. The percentage of silt and clay was determined using the hydrometer. ASTM D2216 (2005) was performed for MC determination. The soil specimen was oven-dried overnight at 105 °C, and the mass of water and dried soil was then calculated to determine the MC of the soil. ASTM D4318 (2005) was utilized to determine the LL and PL of soils. The LL was determined using the Casagrande device. Several trials of different moisture contents were prepared. LL is the MC at which a standard groove made into the soil closes for 12 mm on being given 25 blows. The PL was determined by manually rolling out a tiny ball of moist plastic soil into a 3 mm thread until it crumbled at the moisture content known as the PL.
Table 1 ASTM standards adopted for the laboratory tests
| Laboratory Test | Standard Test Method |
|---|---|
| Grain Size Analysis | ASTM D422, (2002) |
| Moisture Content | ASTM D2216, (2005) |
| Liquid Limit | ASTM D4318, (2005) |
| Plastic Limit | ASTM D4318, (2005) |
| Soil Classification | ASTM D2487, (2017) |
| Standard Proctor Test | ASTM D698, (2012) |
| Soil Resistivity | ASTM G187, (2005) |
In addition, ASTM D2487 (2017) was adopted to classify the soil based on USCS classification. Furthermore, the SP compaction test ASTM D698 (2012) was carried out to compact the soil, from which compaction curves were plotted and OMC and MDD were obtained. Finally, soil resistivity was measured according to ASTM G187 (2005) and compared with different geotechnical properties.
To prepare the compacted specimens, the soil was oven-dried for 24 hours, mixed to the desired MC using distilled water, and left for 48 hours in sealed bags to facilitate moisture homogenization. The specimens were prepared at different MC levels ranging from 6.5% to 20.5% and compacted using a standard ASTM mold of 10.16 cm diameter, 11.64 cm height, and 944 cm3 volume (Figure 2-a). Soil specimens were compacted using five E levels using 15, 25, 35, 45, and 55 blows, including Standard Proctor (i.e., 25 blows), leading to a wide range of DUW values. In this method, thirty-five specimens were compacted at E ranges from 355.98 to 1305.25 (kNm/m3) (Table 2). This procedure was applied to cover a wide range of MC, DUW, and E that can be found in geotechnical practice. After compaction, the ER of specimens was measured using the Kangda KD2571B2 resistance instrument (Figure 2-b). Two circular electrodes were attached to the end of the compacted specimen and connected to the instrument (Figure 2-c). Using this method, the ER of soil was calculated according to the following formula:
Table 2 Soil compaction procedure
| Level of Compaction Energy | Number of Blows | Number of Soil Layers | Hammer Weight (kN) | Hammer Height (mm) | Compaction Energy E (kNm/m3) | Number of Specimens |
|---|---|---|---|---|---|---|
| E1 | 15 | 3 | 2.495 | 304.9 | 355.98 | 7 |
| E2* | 25 | 3 | 2.495 | 304.9 | 593.29 | 7 |
| E3 | 35 | 3 | 2.495 | 304.9 | 830.61 | 7 |
| E4 | 45 | 3 | 2.495 | 304.9 | 1067.93 | 7 |
| E5 | 55 | 3 | 2.495 | 304.9 | 1305.25 | 7 |
*Standard Proctor Compaction
∆V (volt) is the measured voltage drop, I (ampere) is the injected current, A (m2) is the specimen's cross-sectional area, and L (m) is the length of the specimen. This method facilitates a simple and direct ER measurement, as adopted by several authors (McCarter, 1984; Memon et al., 2017; Qiu et al., 2021).
4. Results and Discussion
4.1. Soil characterization
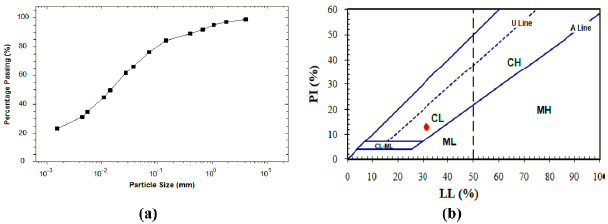
Figure 3-a depicts the particle size distribution of the soil. The soil consists of 1.03% gravel, 20.50% sand, 42.12% silt, and 36.35% clay. The soil is considered fine-grained as more than 50% of the soil passed through a #200 (0.075 mm) sieve. LL is 31.5%. PL is 18.5%, and PI is 13.00%. According to the plasticity chart shown in Figure 3-b and the Unified Soil Classification System (USCS), the soil is classified as type CL (low plasticity clay soil).
4.2. Compaction Characteristics
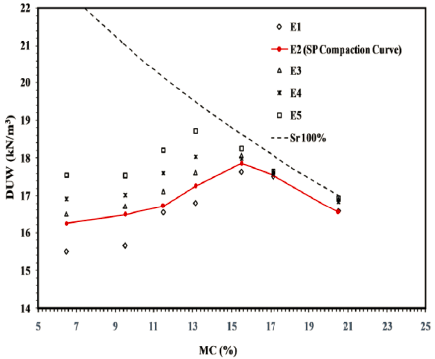
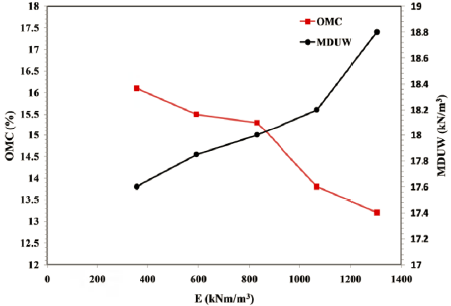
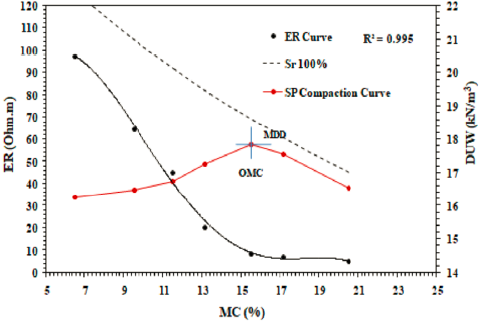
In geotechnical testing, the compaction curve that relates MC and DUW is usually used to determine the compaction characteristics (i.e., OMC and MDUW). Because of compaction, the air is removed from the pores dry of optimum, which makes the soil grains denser (i.e., DUW increases). However, at high MC levels (beyond the optimum), the voids are more filled with water, which prevents soil densification (i.e., DUW decreases). Figure 4 depicts compaction curves of compacted specimens using compaction effort or E levels ranging from 355.98 to 1305.25 kNm/m3 including the SP (25 blow) compaction curve with the Sr 100% line (or Zero Air Void ZAV line). From the SP compaction curve shown in red, it can be noticed that OMC is 15.50% and MDUW is 17.85 kN/m3. Figure 5 shows the influence of increasing E levels on MDUW and MC. Increasing the E level reduces air voids and increases the DUW of the soil (i.e., forces the soil particles to pack in a denser state); therefore, E increases MDUW and decreases the OMC required to reach the optimum (Das & Khaled, 2018).
4.3. Influence of compaction and E level on the ER of soil
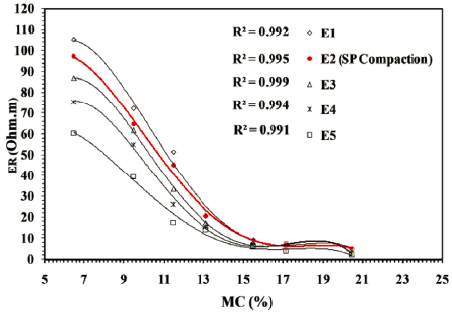
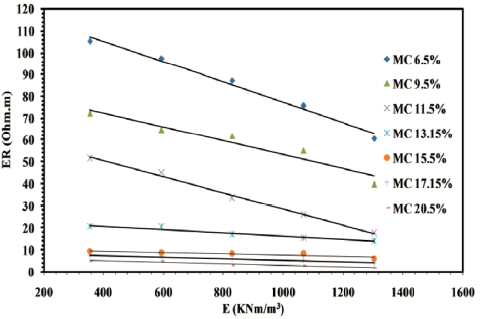
Figure 6 presents the ER-MC relationships of compacted specimens using different E levels. ER decreases with increasing MC, and increasing E from 15-55 blows decreases ER, particularly at low MC levels. However, the influence of compaction on ER is insignificant at high MC levels. For instance, ER decreases from 105.12 Ohm.m to 60.55 Ohm.m for the specimens compacted at 6.5% MC using E1 and E5 (i.e., 15 and 55 blows, respectively). In a comparison, ER at a high 20.5% MC is very low (ER~5.00 Ohm.m) and not affected the E level used. At low MC levels where voids are mostly filled with air, ER is relatively high, and increasing the E level reduces air voids, hence lowering ER. At a high MC level, ER is relatively low and not affected by compaction due to the predominant effect of MC on ER as electrical conduction is already achieved, and increasing E level has an insignificant effect on ER (Melo et al., 2021; Qiu et al., 2021). The influence of E level on ER is further investigated for different MC levels, as shown in Figure 7. It is evident that ER decreases linearly with increasing E level for a particular MC level, and this effect is more significant at a low MC level. ER is constant and not influenced by the E level used at the high MC level, as the slope of the linear relationship flattens at the high MC level, which supports the above discussion.
4.4. Influence of MC on the ER of soil
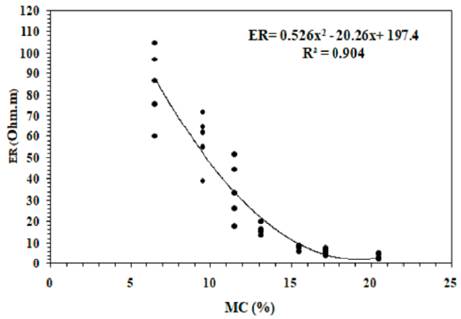
Figure 6 shows that ER decreases non-linearly with increasing MC; the higher the MC, the lower the ER. Similar non-linear relationships have been widely developed in the literature (e.g., Seladji et al., 2010; Beck et al., 2011; Bery et al., 2018). Figure 6 also indicates that ER is strongly correlated to MC for different E levels with R2>0.99, demonstrating that ER can be used to estimate the MC of compacted soils. In addition, the ER-MC relationship is further discussed for SP compacted specimens in Figure 8. ER is relatively high at low MC levels dry of optimum, while it is relatively low and constant at high MC levels wet of optimum. The ER-MC relationship can be discussed regarding the microstructure changes of fine-grained soil because of the compaction process. At low MC, soil grains are characterized by a high air void ratio and are difficult to remold, resulting in higher ER. In contrast, soil grains are easy to remold at high MC as the voids are more filled with water, resulting in lower resistivity (Abu-Hassanein et al., 1996). The moisture discontinuity dry of optimum, hence high ER, and the continuity of moisture wet of optimum, hence low ER, support such ER behavior (Fukue et al.,1999). Similar relationships were reported in the literature (Beck et al., 2011; Hassan and D. Toll, 2015). The ER-MC relationship for all compacted specimens using E1 to E5 levels is fitted to the non-linear (polynomial) relationship presented in Figure 9, and expressed as follows:
Although a high R2 of 0.904 is achieved, using ER to estimate MC (gravimetric) can be erroneous, especially in dry conditions, as the soils in the field can be found at the same MC level but compacted at different E levels and Sr values. Therefore, it is better to correlate ER with 0 or Sr, as will be discussed later.
4.5. Influence of DUW/ e on the ER of soil
In geotechnical testing, it is well known that the compaction process increases DUW at the dry side of optimum up to the MDUW, then DUW increases at the wet of optimum (Budhu, 2015), as can be noticed in the compaction curve shown in Figure 8.
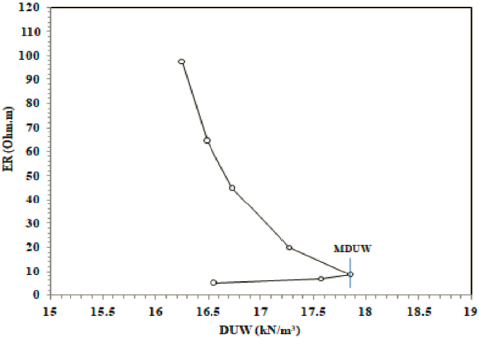
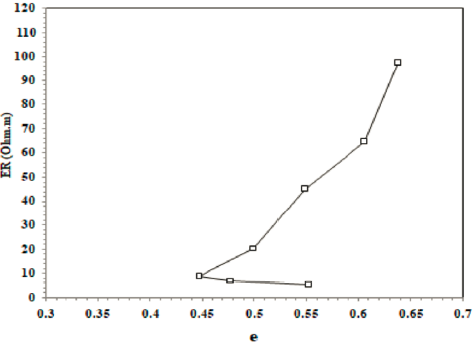
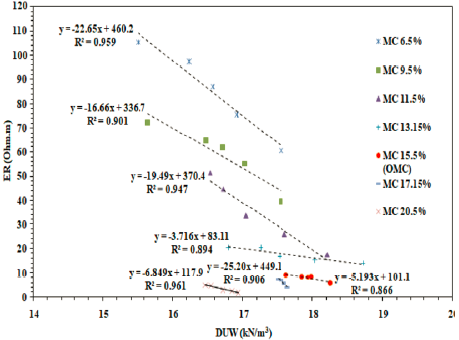
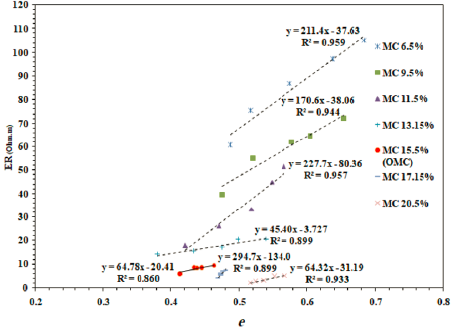
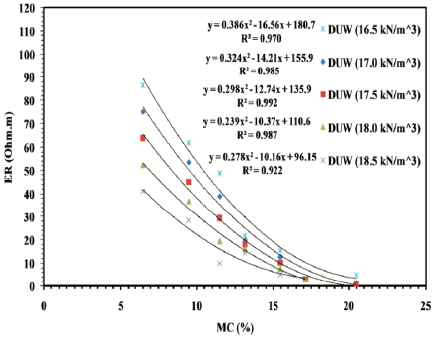
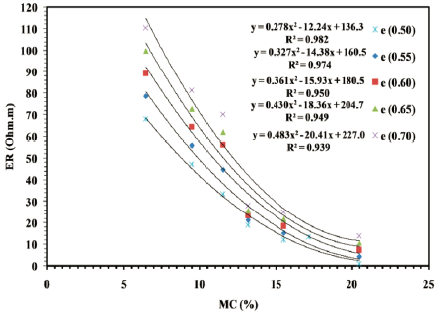
To explore the influence of DUW and e on ER, ER is plotted against DUW in Figure 10 and against e in Figure 11 for SP compacted specimens. ER is more influenced by DUW and e variations dry of optimum. ER decreases rapidly with increasing DUW and increases with decreasing e at the dry side of the optimum up MDUW, then ER decreases gently wet of the optimum. It seems that two ER behaviors are separated by the optimum, which is an interesting finding reported by Beck et al. (2011). As discussed earlier, at the dry side of optimum, increasing DUW decreases e in the soil and lowers ER. However, this effect is insignificant at wet of optimum because of the water that fills the pores, which facilitates electrical conduction and lowers ER (Melo et al., 2021; Qiu et al., 2021). To further investigate the influence of DUW and e on ER for specimens compacted using different E levels, ER is plotted against DUW and e for different MC levels, as shown in Figures 12 and 13, respectively. ER decreases linearly with increasing DUW, and increases with increasing e for different MC levels, particularly at the low MC levels (or dry of optimum). The slope of the relationships is relatively steep and flattens at high MC levels (or wet of optimum). This behavior confirms that the influence of compaction on ER is significant at low MC levels compared to high levels.
Using the regression equations shown in Figures 12 and 13, ER-MC relationships are plotted for constant DUW and e values, as shown in Figures 14 and 15, respectively. ER increases with decreasing MC at a constant DUW or e. However, increasing DUW/decreasing e, makes ER-MC relationships flatter. This behavior supports the above discussion, as when DUW increases/ e decreases, more voids are filled with water, which improves electrical conduction and reduces the ER of the soil.
4.6. ER- ϴ and ER-Sr relationships
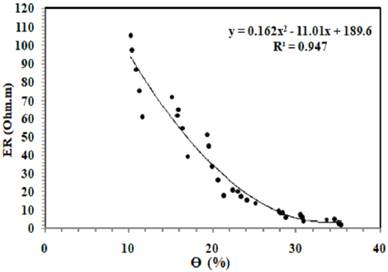
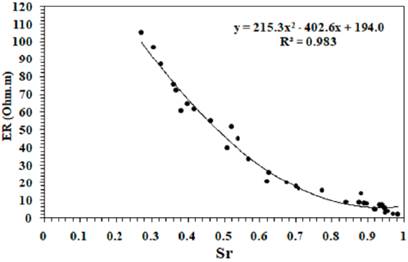
The above discussions showed that the ER is sensitive and well correlated to the main compaction variables (MC, DUW, and E levels employed). MC and DUW can be integrated into one geotechnical property, 0. Furthermore, increasing E is accompanied by increasing Sr, which integrates the influence of MC and e of the soil.
Figures 16 and 17 show ER- 0 and ER-Sr relationships for all data presented in this work. Figure 16 shows that ER decreases with increasing ϴ. Increasing ϴ means more water available in the pores that enhance the electrical conduction, hence low ER, and vice versa. The ER- 0 relationship is formulated using the following equation:
The high R2 achieved demonstrates that ER is strongly related to 0 and can be used to estimate 0 ofthe soil (McCarter, 1984; Fukue et al., 1999; Michot et al., 2003; Hassa and Toll, 2015). Similarly, ER decreases with increasing Sr, as shown in Figure 17. At low Sr levels, the discontinuity of water in the voids makes ER relatively high and changes abruptly; however, at high Sr levels, the continuity of water is improved so that the electrical conduction causes a decrease in ER. The ER-Sr relationship is formulated using the following equation:
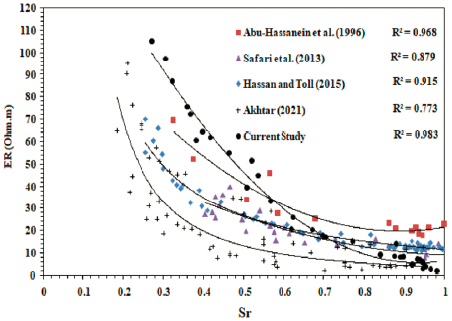
The high R2 achieved indicated that ER is strongly correlated with Sr and can be used to estimate this geotechnical property (Abu-Hassanein et al., 1996; Safari et al., 2013; Hassan and Toll, 2015). Similar ER-Sr relationships that are relatively less dependent on the E level used have been reported in previous studies (Abu-Hassanein et al., 1996; Hassan and Toll, 2015). Moreover, the ANOVA tool was used to examine the statistical significance of the correlations shown in Figures 16 and 17. The p-values were 2.99E-15 and 1.11E-18 for the ER-0 relationship and the ER-Sr, respectively. P-values less than 0.05 indicate that these correlations were statistically significant. Finally, ER-0 and ER-Sr relationships presented in this study are compared with those similar relationships published in the literature, as shown in Figures 18 and 19, respectively. The current relationships confirm the non-linear trend reported in the previous studies, which confirms the validity of using the ER method for rapid and low-cost preliminary estimation of these geotechnical parameters. However, more work is required on specimens compacted at extremely low MC levels. In addition, the current laboratory findings need to be confirmed on soils of different types. Moreover, the influence of compaction, compaction energy, and other physical properties on the ER of fine and coarse-grained soils needs to be further investigated at laboratory and field scales.
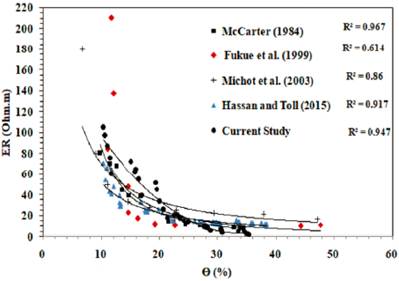
Figure 18 A comparison between the ER-0 relationship of the current study and similar published relationships
5. Conclusions
This study aimed to investigate the distinct influence of compaction on the ER of fine-grained soil collected from the east of Baghdad City. It was found that the ER of soil is influenced by key compaction variables: MC, DUW, and E levels employed, and this influence is more significant for specimens compacted at the dry of the optimum; the lower the MC, DUW, and E levels, the higher the ER. This trend can be explained in terms of microstructure changes due to the compaction process. The ER is non-linearly correlated with the MC of soil specimens compacted at different E levels, while it shows a linear correlation with the DUW. As soil can be found in the field at the same MC but different compaction levels, it is better to correlate ER with 0 and Sr instead of MC. It was noted that the ER is strongly correlated with 0 and Sr, with high R2 values of 0.947 and 0.983 and p-values of 2.99E-15 and 1.11E-18, respectively which indicate that these correlations are statistically significant. Moreover, the geotechnical-geoelectrical correlations achieved in this study were consistent with those reported in the literature. The current study indicated that the ER method can be a preliminary, cost-effective tool for evaluating compacted soils at the early stages of engineering site investigations. However, the current findings need to be explored and confirmed on different types of soils. More work must be done on soil compacted at very low MC levels. Furthermore, the influence of compaction and other soil physical properties on the ER of soil needs to be addressed in the field.


