1. Introduction
As an important energy resource, coal has played an irreplaceable role in the social and economic development of China (Yuan et al., 2021; Peng et al., 2020). During coal mining, mine water hazards, which have caused very large casualties and property loss, represent the second leading cause of coal mine accident-related deaths (Cheng et al., 2014; Yang et al., 2016). According to statistics, the driving face is the main place where water accidents occur. To detect water-bearing anomalies prior to excavations, advanced electrical detection technology based on the resistivity difference between groundwater and surrounding rock has become an important pre-detection method in the past 20 years (Wang et al., 2021; Zhang et al., 2015; Yue et al., 2019). Regarding mining DC advanced detection technology, many scholars have performed much research. Zhou Guanqun et al. (Zhou et al., 2022) proposed a "triangular cone" type DC advanced detection three-dimensional observation system, which solves the problem that the traditional DC advanced detection method cannot determine the specific location of the target, avoids the existing obstacles in the current traditional tunnel DC advanced detection, and provides a new solution for advanced detection. With the help of comparative analyses, Xiaolong Wang and Jifeng Zhang (Wang et al., 2011; Hao et al., 2020) simulated the solutions of forward models and theoretical values using COMSOL Multiphysics software and established 3-D geoelectric models for advanced detection in mine roadways. Additionally, via forward simulations using COMSOL Multiphysics software, they studied the shapes and positions of the extreme values on the apparent resistivity curves for the advanced detection of different abnormal mine bodies before the roadway. Thus, the possibility of applying COMSOL Multiphysics software in forward simulations for advanced DC detection in mine roadways was verified. Through the combination of numerical simulations, physical simulations, and engineering applications, Lu Liu and Wenfeng Zhan (Liu, 2014; Zhan et al., 2018) systematically studied the impact of various influencing factors on the results of advanced detection using the DC electric method. They derived a 3-D advanced detection system and tested its efficiency in numerical simulations, physical laboratory experiments, and on-site data. Thereafter, they proposed a corresponding data processing approach. Based on physical experiments and numerical simulations, Bingzhen Ma and Jifeng Zhang (Ma and Li, 2013; Zhang et al., 2016) systematically studied the effect of the size of the roadway on the accuracy of the results of advanced DC electric measurements in mines and provided a practical formula for the coefficient of the influencing roadway.
Advanced detection using the DC electric method in roadways has been successfully applied in some mines. However, several problems that require further investigation still exist. For example, during actual detection, the roadway cavity and its ambient environment disrupt the accuracy of the detection, resulting in differences in the electric field distribution characteristics in full space. This increases the difficulties associated with data interpretation and induces a deviation in the positioning of the abnormal bodies in front of the roadway (Li et al., 2020; Yang et al., 2013). If the influence of the roadway cavity is neglected (Lu and Wu, 2013), the advanced detection data would be inaccurate, and the resulting errors may likely lead to the distortion of the position of the anomaly to be detected (Zhang, 2011). However, if it is considered, it will be very difficult to distribute the electric field in the roadway or obtain an analytical solution to the apparent resistivity of advanced detection. Based on these previous studies, the numerical simulation of the resistivity method in COMSOL Multiphysics software is emphasized in this study to investigate the response characteristics of the electric field prior to the working face in an excavation roadway. The ratio method was used to correct the influence of the roadway, and the accurate positioning of the abnormal bodies was achieved. Additionally, the response results of the survey line layout at different locations along the roadway were discussed, and a theoretical basis for practical operation was proposed.
2. Principle of advanced DC detection in mines
2.1. Boundary value and variational problem of the stable electric field
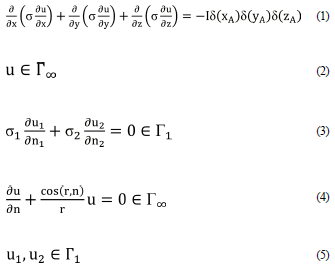
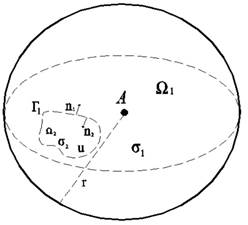
If the underground power source is the point "A" and "I", 'Γ", and "Ω" represent the electric current intensity, the closed surface, and the area surrounded by “Γ” as shown in Figure 1, respectively, the rectangular coordinate "U", which is the boundary values that make up the 3-D electric field potential, is summarized as:
where “Γ1”, “Γ∞”, “σ”, “δ”, “n”, and “r” represent the medium interface in the area, the infinite boundary, the electrical conductivity of the underground medium, the Dirac function, the coordinate variable in the normal direction of the boundary, and the vector radius from the source point to the boundary, respectively. The boundary of Area “Ω” represents the interface of the natural boundary conditions. It is automatically satisfied during the process of obtaining the functional extreme values; thus, its consideration is not necessary.
When the finite element is used to solve the boundary value problem, it first transforms the boundary value into a variational problem, as shown in the equation below.
Substituting this equation into Equation 1 provides:
Substituting this equation into Equation 4 gives:
After transposition is completed, the following is obtained:
Therefore, the equivalent variational problem of the extreme boundary values of the 3-D electric field is:
To solve the variational problem, the first step is to subdivide and discretize the model. Thereafter, the tetrahedral element is used to divide the model into nonuniform grids. The division of the grids around the point power source and the abnormal body is denser. Moreover, as the distance to the center of the model increases, the grids are more widely spaced. Thus, both the accuracy and computation speed are enhanced.
2.2. Basic principle of the advanced detection method
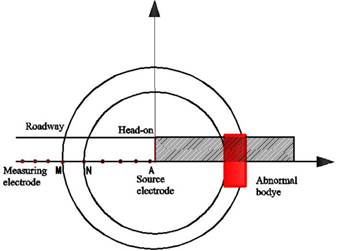
To predict the distribution of geological anomalies in a nonexcavated and nonmined area in mines, the advanced detection DC electric method is used to obtain the characteristics of the distribution and the variation of the stable electric field by moving the measuring electrodes. In a uniform medium, the equipotential surface of the point power source is a concentric spherical surface with the source as the center. However, in a nonuniform medium, the equipotential surface is not a concentric spherical surface because the anomaly occupies the place of the equivalent spherical surface. Thus, it became an equipotential curved surface with a form that is related to the nature of an abnormal body in the medium. Therefore, the distortion of the spherical equipotential surface served as an anomaly indicator, i.e., the deformation of the spherical shell where the measuring electrodes are located is indicative of the presence of an anomaly. According to the principle of spherical symmetry, the anomaly can also be detected from the observation points in the roadway. Thus, the advanced DC electric method detects geological anomalies in advance, as shown in Figure 2. In Figure 2, "A" represents the source electrodes, and "M" and "N" represent the measuring electrodes.
3. Numerical simulation of 3-D advanced detection
3.1. COMSOL simulation process
COMSOL Multiphysics simulations can be divided into three steps as follows: preprocessing, solution, and postprocessing. The preprocessing step involves the creation of finite element models as well as the applied load, the solution step involves grid subdivision and the matrix solution, and the postprocessing step involves the visualized display of the analysis results and data output (Zhao et al., 2018). In this study, by defining Poisson's equation on the basis of a mathematical module, the solution was derived using COMSOL Multiphysics software.
3.2. Comparison of the analytical and numerical solutions
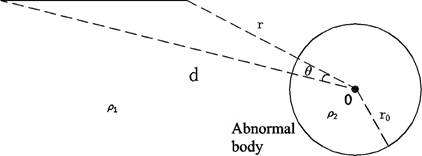
Assuming a sphere with a radius, r0, resistivity, p2, and Point A that is located outside the sphere, the analytic expression of the potential at Point M in the space outside the sphere, which represents the location of the power source according to the principle of the DC detection method, would be:
where "pl" and "p2" represent the resistivity of the surrounding rocks and the sphere, respectively; "d" represents the distance between the point power source (A) and the center of the sphere (O); r represents the distance between the potential electrode and the center of the sphere (O); "R" represents the distance between "A" and "M"; "9" represents the included angle between "AO" and "MO"; and Pn(cosθ) represents Lengendre polynomials. The above equation could be used to calculate the potential difference UMN at Points "M" and "N" with "AMN" located along the same straight line (i.e., along the excavated roadway). Thus, a sphere with a low resistivity for advanced detection in the head-on front of the roadway was simulated. The distribution of the electric field of the sphere with low resistivity in full space as well as the analytical solution of the apparent resistivity of the advanced detection could be obtained using Equation 13.
If the resistivity of the surrounding rocks in full space (p1, the resistivity of the sphere of low resistivity (p2), the radius (r0), and the distance (d) between the point power source (A) and the center of the sphere (O) are 100 Ωm, p2 1 Ωm, 5 m, and 15 m, respectively, the power current is 1 A. Additionally, a comparison of the simulated and the analytical values of the potential is presented in Table 1, which shows that closeness to the power supply point (< 2 m away) resulted in a more significant error in the measured potential. Conversely, the farther the power supply point was, the smaller the error; i.e., near the boundary, the absolute error tended to 0. The relative error at 1 m away from the power supply point was 5.68%, and at 80 m away, it was 0.12%. Obviously, this indicates that the computation results obtained using COMSOL Multiphysics software for the 3-D forward modeling using the mine DC electric method are credible and have a higher computation accuracy.
Table 1 Comparison of the analytical and numerical solutions.
| x/m | Analytical/V | Numerical/V | Relative error/% |
|---|---|---|---|
| 1 | 7.9601 | 7.5073 | 5.68 |
| 2 | 3.9811 | 4.1530 | 4.32 |
| 3 | 2.6546 | 2.7372 | 3.11 |
| 5 | 1.5933 | 16108 | 1.10 |
| 10 | 0.8856 | 0.8941 | 0.96 |
| 15 | 0.5315 | 0.5268 | 0.88 |
| 20 | 0.3987 | 0.3960 | 0.66 |
| 40 | 0.1993 | 0.1985 | 0.40 |
| 80 | 0.0996 | 0.0997 | 0.12 |
4. Research on the advanced detection of apparent resistivity in mine roadways
4.1. Analysis of the influence of the roadway cavity
During actual advanced detection, the results of the detection are greatly influenced by the roadway cavity. If the influence of the roadway is neglected, the detection results will be associated with significant errors, thus directly limiting the detection accuracy. In this study, a numerical simulation for advanced detection was performed by taking into account the influence of the roadway cavity, and the model parameters were as follows:
The resistivity of the roadway cavity (air) was 1010 Ω-m, the cross-section of the roadway cavity was a 3 m x 3 m square, the resistivity of the surrounding rocks was 100 Ω-m, the length x width x height of the abnormal body was 15 m x 5 m x 15 m, the coordinates of the central point were (10,0,0), the resistivity of the abnormal body was 1 Ω-m, the coordinates of the power supply point were (-5,0,0), and the midpoint of the demarcation line of the tunnel face and the floor was the zero of the coordinates of the central point. The schematic model is illustrated in Figure 4 below.

Figure 4 Schematic representation of the location of a roadway cavity and a cuboidal water-bearing structure.
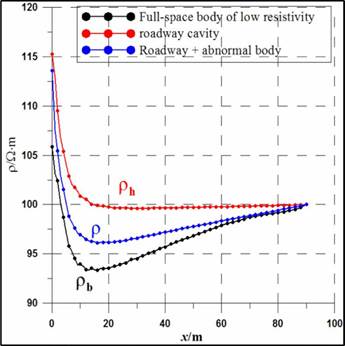
The apparent resistivity curves of the advanced detection using the same model parameters in several cases are shown in the sequence in Figure 5. Here, p represents the response curve of a tabular abnormal body of low resistivity in front of the roadway. On the other hand, pb represents the response curve of the full-space tabular abnormal body of low resistivity (assuming that there is no roadway at the rear), and ph represents the response curve when there exists only a roadway without any tabular abnormal body at the head-on front.
Figure 5 reveals that the three curves showed a consistent trend. The influence of the roadway cavity resulted in a significant error difference between pb and p. Additionally, p obviously had a higher resistance, which was between those of ph and pb. This result demonstrates that even though the roadway cavity significantly influences the simulation results, taking this influence into account does not completely eliminate the errors associated with the advanced detection of the geological anomaly. The advanced detection curves in cases where the existence of the roadway was considered not only contained geological abnormal information regarding the front of the working face but also included errors associated with the influence of the roadway cavity. However, it was impossible to distinguish the curves using only the individual curves' characteristics.
4.2. Correction of the roadway influence
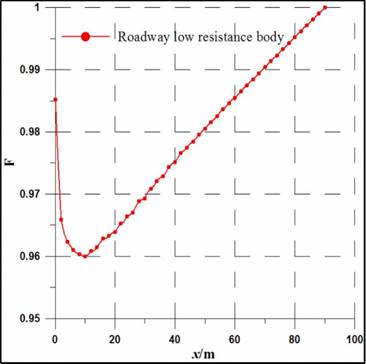
During actual advanced detection using the DC electric method, the roadway possibly influences the accuracy of the detection results because it influences the distribution of the geoelectric field in the full space, making the advanced detection results more complicated. Since the roadway cavity would influence the response characteristics of a geological anomaly in the front during data processing, it is necessary to eliminate the influence of the roadway cavity to avoid the detection of false anomalies. Through the ratio curve, the roadway correction coefficient, F = p/ph, was introduced to eliminate any abnormal response induced by the roadway cavity (p represents the existing roadway when there is a tabular abnormal body of low resistivity in front of the roadway, and ph represents the existing roadway when there is no tabular abnormal body of low resistivity in the head-on front). The ratio method was adopted to obtain the response curves of low resistivity in the roadway space, and the results are shown in Figure 6.
Figure 6 shows that the influence of the roadway on the curve was eliminated; thus, the resolution of the anomaly was enhanced. Additionally, a minimum value appeared, and the extreme point was located 10 m away, coinciding with the location of the center of the actual anomaly. The calibration results of the roadway influence show that the ratio method can not only reduce the influence of the roadway cavity but also enhance the amplitude of the abnormal response, which is conducive to the accurate location of the abnormal body.
Since the roadway influences the results of DC electric detection in mines, the ratio method is more efficient in eliminating the influence of the roadway. Thus, this method was preferentially adopted prior to mapping.
4.3. Analysis of the influence of the electrode layout location
During on-site detection using the DC electric method, the location of the electrode layout in the roadway is an important influencing factor that should also be considered. Scholars have studied the relationship between the influence of the roadway cavity and the location of the electrode layout. Based on their findings, the curves at the junction line of the sidewall and the floor were determined to be easy to correct. However, the corrected results were not compared. Therefore, in this study, the apparent resistivity response curves at different electrode locations in the same roadway were compared. Under conditions that maintain the properties of the abnormal bodies in the surrounding rocks and the roadway to be constant (the same as that in Section 3.1), the results based on different electrode layout locations were simulated. Regarding the same roadway, the simulation results from the different electrode layout locations with symmetric layouts coincided, i.e., the characteristics on the left and right sides of the roadway were the same. Therefore, in this study, only the response results based on the left side of the roadway were considered. The location of the survey line layout is shown in Figure 7.
The black line, the red line and the blue line represent the response results of the electrode layout at the center of the roadway floor, on the left wall along the driving direction, and out on the included angles on the left wall and floor along the driving direction, respectively. The results of the forward modeling are shown in Figure 8.
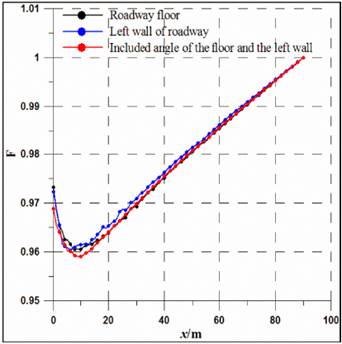
Figure 8 Comparison of the abnormal amplitude values at different positions in the survey line layout.
Figure 8 shows that as the overall trend of the three curves coincided, the resistance decreased gradually, after which a minimum value appeared. As the crossover distance increased, the influence of the electrode position weakened rapidly, and the curves tended gradually toward 1. By comparison, it was found that the first curve for the electrodes positioned along the included angle of the roadway floor and the left wall was only slightly influenced, and the resolution of the anomaly was highest. The curves for the electrodes positioned on the roadway floor as well as the included angle of the roadway floor and the left wall could facilitate the accurate determination of the location of the anomalies. However, the position of the anomalies in the curves of the electrodes positioned on the left side of the roadway showed some offset.
5. Case analysis
The return airway in a mine in southern Shanxi was excavated along the coal seam floor. The airway was approximately 5.6 m wide and 3.7 m high. From the head-on observation, the coal seam was perfect without obvious fractures and fragmentations. Moreover, to ensure safe mining, the DC electric method was adopted to perform advanced detection.
During underground operation, a three-point tripolar detection system was adopted. The distance between the power supply electrodes "A", "B", and "C" was 4 m. "C" was 14 m away from the head-on front, and the distance between this electrode and the measuring electrodes, "MN", was 4 m. After data was collected, the collected data were first processed, and the results obtained are shown in Figure 9. Thereafter, the roadway space was corrected using the ratio method, i.e., the influence of the roadway floor and the geological bodies at the rear of the roadway was removed, and finally, mapping was performed. The results are shown in Figure 10.
The detection results in Figure 9 show that the major anomaly of low resistivity was located at ~22-26 m in the head-on front, and a weak low resistance anomaly was observed at ~50-54 m. They were named the No. 1 anomaly and No. 2 anomaly, respectively. The apparent resistivity of the No. 2 anomaly is similar to the background field, and the anomaly is relatively weak. Thus, it cannot be determined whether it is caused by a water-bearing geological structure. After correction is performed using the ratio method, it was found that the anomaly still existed at ~22-26 m, and the anomaly at ~50-54 m was evidently enhanced. It was confirmed that when the excavation reached 52 m at the head-on front, an abandoned roadway with mined-out area water was obtained, and the accumulative amount of inrush water reached approximately 180,000 m3. It is verified that the accuracy of the advanced detection results of the DC method corrected by the ratio method is higher. Combined with the results of numerical simulation and engineering application research, it can be seen that using the ratio method to correct the advanced detection data of the direct current method can effectively reduce the influence of the roadway cavity, improve the response amplitude and detection accuracy of the water-bearing geological body in front of the roadway, and achieve the accurate location of the water-bearing geological body in front of the roadway by the DC resistivity method, which is conducive to the popularization and application of the method in the advanced detection of the roadway.
6. Conclusion
Based on previous studies on advanced detection using the DC electric method, COMSOL Multiphysics software was further utilized in this study to determine the influence of the roadway and the relative position of electrodes on the accuracy of the advanced detection of anomalies in mines using the DC electric method. The following conclusions were obtained.
During advanced anomaly detection in mines using the DC electric method, the influence of the roadway is related to the location of the electrode layout. When the electrodes are set at the junction of the floor and the sidewalls, the influence of the roadway on the accuracy of the detection results is minimal, i.e., the determination of the positioning of the anomaly is more accurate, and its resolution is higher.
To correct the influence of the roadway, the ratio method can be used during data processing. The analysis results showed that employing the ratio method can lead to a more accurate and efficient reflection of the true response of abnormal bodies.


