


 English (pdf)
 Article in xml format
 Article references
 Send this article by e-mail
 Cited by SciELO
  Cited by Google
  Similars in
SciELO
Similars in
SciELO  Similars in Google
 Permalink
1. Introduction
Vision loss is one of the most debilitating sensory deficits for humans, as we rely heavily on our sense of sight to gather information from the external environment. This becomes more apparent when considering the percent age of the cerebral cortex allocated to our visual sys tem, which imposes a high risk of visual loss when brain damage occurs.
Electroencephalography (EEG) signals are recorded noninvasively through electrodes placed on the scalp and have a high temporal resolution, making it one of the most widely used recording modalities to study brain activity (Orban et al., 2022). EEG measures the elec trical activity of the brain caused by the flow of electri cal currents during synaptic excitations and inhibition of dendrites in neurons (Beniczky et al., 2020; Brienza et al., 2019). EEG research is useful in the diagnosis and rehabilitation of the cognitive problems of individ ual head injury (Alouani et al., 2022; Kadri et al., 2022), and visual evoked potentials (VEP) have shown infor mation about the functional status of the visual sys tem (Sanchez-Lopez et al., 2019). Other studies have also used these potentials to characterize vision func tions in children and adults and have reported objective measures to support clinical evaluations in healthy sub jects and visually impaired patients (Bach et al., 2019; Hemptinne et al., 2019; Kiiski et al., 2016; Sahel et al., 2021; Sarzaeimet al., 2022; Zheng et al., 2019). However, although VEPs are measurements that offer valuable in formation on amplitude, latency, and spectral character istics, some of them are sensitive to external factors such as the type of monitor, signal acquisition system, ambi ent light, etc. (Fox et al., 2014). It is important to ana lyze EEG measurements that can be sensitive indicators of pathology (Zhong et al., 2023) and allow the use of transferable equipment that facilitates implementation in clinical settings. VEPs are the most widely used tech nique to explore the visual cortex since they allow the ex ploration of basic visual neurophysiology and the diagno sis of various optical and neurological pathologies. There are two forms for VEPs: VEP transient and VEP sta tionary or Steady State VEP (SSVEP). Transient VEPs (TVEPs) occur when stimuli are presented at a slow rate (below 4 Hz), allowing the stimulus-evoked brain activ ity to return to baseline before the next stimulus is de livered (Nicolas-Alonso et al., 2012; Sanchez-Lopez et al., 2019). Some studies have carried out treatments for multiple sclerosis (MS) and optic neuritis, showing sig nificant results with P100 in rehabilitation treatments (Kiiski et al., 2016; Marcar et al., 2018). It is more com mon to use steady-state VEP (SSVEP) to analyze neuro-ophthahnological diseases (Sanchez-Lopez et al., 2019), considering the SSVEP as a solid method to study visual perception, spatial and selective attention, cognitive fa tigue, and working memory (Mora-Cortes et al., 2018).
Repetitive (or flickering) visual stimuli occur at high fre quency (usually 6 to 20 Hz), as proposed by Lantz et al. (2021), causing a continuous and constant sequence of oscillatory potential changes that arise primarily in the visual cortex. This stimulation is fast enough to prevent evoked neural activity from returning to base line. SSVEPs reflect high-propagation properties (i.e., a mix of local and widely distributed time sources), are less sensitive to different types of artifacts, require much less time to acquire data, and have a higher signal-to- noise ratio (SNR) than the TVEP (Norcia et al., 2015; Sanchez-Lopez et al., 2019). In addition, other SSVEPs have made it possible to measure acuity and contrast sensitivity (Ahmoqbel et al., 2017; Baker et al., 2015). Therefore, these potentials are a useful tool to charac terize the visual system differences, and they are even observed when evaluating the visual system using filters or lenses, or when performing monocular and binocular tasks (Richard et al., 2018). This study focuses specifi cally on visual physiology and steady-state evoked poten tials and aims to demonstrate the efficacy of a portable EEG device, and the OpenBGI acquisition device used in previous work (Cadavid et al., 2021; Ortega et al., 2019), to capture visually evoked potentials that differ entiate stimulus perception in individuals with corrected- to-normal vision. The research includes the development of a protocol that combines visual testing and EEG mea surements. By analyzing the acquired EEG signals, the study provides recommendations for procedures in stimu lation, EEG recording and processing, and data analysis. The results consistently showed that neurons were acti vated in all cases, confirming that the portable device is effective for studying the brain. This research intends to provide helpful suggestions for recording SSVEP us ing OpenBGI, which could create common ways to do things like (a) deciding how to make the brain respond, (b) recording and looking at brain activity, and (c) per forming data analysis. Furthermore, this study also re veals differences in the effects of wearing glasses, which adds more insight to using SSVEP to study how our visual system works. The following sections describe the current methodology for detecting neural activation, starting with the selection of the population of interest. Next, the tools for developing the experimental stimula tion tasks and the subject’s position during stimulation are developed. Then, the data acquisition protocols and the different preprocessing steps (e.g., EEG acquisition and processing, reference, artifact removal, wavelet, and FIR filtering) are considered. After that, the recorded EEG signals in which the VEP is present are analyzed by observing the power spectral density at the stimulation frequency, and a survey is conducted to assess the sub ject’s comfort level. Finally, the results obtained using the signal-to-noise ratio (SNR) and Welch’s method are presented and discussed to draw conclusions.
2. Methods
2.1 Subjects
23 adult volunteers were evaluated, 13 women and 10 men, aged between 18 and 60 years with a mean age of 25.04 ± 9.0 years. This group comprised individuals who rely on glasses for their daily activities. The aim was to assess potential variations in visual perception among participants when conducting experiments with and without glasses.
Additionally, participants were required to have no history of epilepsy due to the potential risk of certain types of visual stimuli triggering seizures in individuals with this condition.
Ethical approval declarations. All participants were from Medellín, Colombia, and the surrounding area, and signed an informed consent form approved by the Ethics Committee of the University Research Center of Universidad de Antioquia (Acta 18-59-828).
Participants were recruited through telephone calls, an enrollment form, and e-mail. Personal and demo graphic data, such as age, sex, and whether they suf fered from epilepsy, were previously recorded. At the end of the recording, each subject was given a satisfac tion test survey using the Google form, where comfort during the test, perception of the stimuli, and additional suggestions were recorded.
2.2 Stimulation Conditions
The stimulus was created using the Python 2.7 program ming language, Psychopy3 experiment creation software, and the OpenDesigner tool, and was presented on a Sam sung SyncMaster 2243LNX display. During the experi ment, subjects kept their heads on a stand to maintain a viewing distance of 1 meter, the stimulus was displayed for binocular vision, and all participants were guided to remain comfortably seated while attentively observing the stimulus, avoiding movement during recording. The visual stimulus employed was Vernier acuity. This in volved switching between two patterns: a regular linear grating and a grating with a Vernier displacement of 15 arcminutes. These states alternated at a rate of 5 Hz, and the entire stimulation lasted for 30 seconds. The operational setup can be observed in Figure 1. This stimulus was selected because it activates the visual cor tex and allows obtaining the visual acuity from the EEG measurement (Tan et al., 2018; Zheng et al., 2020), and the selected stimulation frequency has a greater ampli tude compared to other frequencies and provides greater comfort during stimulation (O’Hare, 2017).
2.3 EEG Acquisition
The acquisition of brain activity was performed via EEG from eight electrodes (FCz, Oz, O1, O2, PO7, PO8, PO3, and PO4) placed according to the 10-10 system (Nuwer, 2018). The specific placement of these elec trodes is illustrated in Figure 2. The data were recorded directly from a code generated in Python language and the data was acquired via Bluetooth from the OpenBCI device card at a sampling rate of 250 Hz.
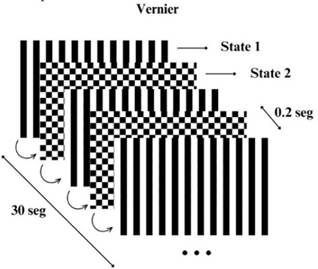
Note. The stimulus oscillates at a frequency of 5 Hz, resulting in a switching time between states 1 and 2 of .2 seconds. Source: authors
Figure 1 Schematic Representation of the Stimulus used in the Experiment
Note. The electrodes are positioned over the occipital area, targeting the visual cortex, constituting approxi mately 5% of the total electrode array. Source: authors
Figure 2 Schematic Representation of the Electrode Setup Utilized during Experimentation
Signal acquisition was only performed after the fol lowing procedures were completed for the EEG device: calibration of the channel impedance, ensuring that the contact impedances of the EEG electrodes were kept below 30 kQ, connection of the ground and reference channel sockets to the common and reference ground, re spectively, located on the earlobes. Finally, verification that the signals captured by the electrodes were stable.
Signals were recorded for each subject in the present study at rest with eyes closed and at rest with eyes open, both for 5 minutes. Finally, signals were recorded for each subject under stimulation conditions, as illustrated in Figure 3. The stimulation was measured both with and without glasses to observe differences in EEG re sponses to the same visual stimulus.

Note. This diagram outlines the sequence of the ex perimental task. It begins with a 5-minute rest period with eyes closed, followed by a 5-minute rest period with eyes open. The task concludes with a 30-second stimulation using a 5 Hz Vernier pattern while the sub ject’s eyes remain open. This sequence aims to estab lish baseline EEG activity with and without visual in put, and then measure the response to specific visual stimulation. Source: authors
Figure 3 Sequence of the Experimental Task
2.4 EEG Processing
The data processing flow is shown in Figure 4. EEG signals obtained were loaded and processed in Python 3.0 using the Google Collaboratory tool.
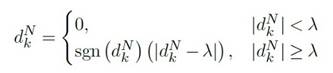
As a first step in the preprocessing of the different sig nals obtained, a re-referencing was carried out by using as reference the signal of the FCz electrode (see Figure 2), located at the medial zone of the coronal suture, a zone in which non-visual related brain activity can be recorded. The aim of re-referencing is to remove the de fault brain activity, so that what is recorded in the chan nels of interest located in the occipital area is mainly due to the visual stimulus (Leuchs, 2019). This method has been effectively used in simultaneous EEG-fMRI studies because of the ease with which it can be attached to the scalp and because it favors the subsequent removal of artifacts during processing (Lei, 2017). To remove arti facts, the EEG signals were filtered. First, linear trends were removed, then a 3-Hz linear high-pass filter was applied, followed by the nonlinear Wavelet filter, and finally a 45-Hz linear low-pass filter was implemented. The nonlinear Wavelet filter used is a de-noising proce dure, it was developed in three steps, all by performing 8 levels of decomposition (N = 8), having into account the db6 wavelet as the Wavelet family (Patil, 2012): The wavelet decomposition of the signal was calculated at level N, where the approximation and detail coefficients were obtained. Therefore, the threshold called universal was chosen and soft thresholding was applied to the de tail coefficients. The value of the universal threshold is calculated with the Equation 1, where n is the number of samples of the signal (Guarnizo-Lemus, 2008).
 (1)
(1)
The soft thresholding is given by the Equation 2, were d k N is the wavelet detail coefficient k of level N , y sgn is the sign function (Guarnizo-Lemus, 2008).
 (2)
(2)
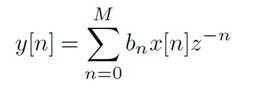
Finally, the wavelet reconstruction was computed from the original approximation coefficients of level N and the modified detail coefficients of levels 1 to N. Us ing this filter, it becomes possible to selectively retain coefficients surpassing a specified threshold for incorpo ration into the signal reconstruction. Meanwhile, co efficients falling below this threshold, regarded as sig nal noise, are discarded. This is due to the Wavelet transform’s capability to concentrate the signal’s energy within a handful of coefficients, whereas noise energy is distributed among numerous coefficients. As a result, the clean signal coefficients exhibit relatively higher val ues compared to those of the noise signal (Ballesteros Larrota, 2004). Subsequently, the non-filtered signal is subtracted from the Wavelet-filtered signal to account for the inherent lower amplitude of biological signals in relation to noise. For the linear filtering, FIR-type fil ters were used described by the Equation 3, where bn are the coefficients of the filter and Z -1 correspond to the Z transform with M as the order of the filter. Finally, a 454-order high-pass filter and a 74-order low-pass filter were selected (Gunaydin, 2010).
 (3)
(3)
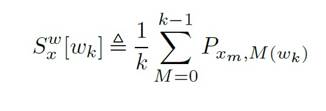
For the frequency domain analysis, the Welch peri odogram was used, which calculates the power spectral density (PSD) by applying the fast Fourier transform (Carvalho et al., 2015). Welch’s method is performed by dividing the time signal into successive blocks, form ing the periodogram for each block, and averaging. For the signal xxx, set mmm as the windowed, zero-padded frame. The signal is then defined as xm , w(n) x (n + mR) for n = 0, 1, . . . , M1 and m = 0, 1, . . . , K1, where R is the window hop size, and K denotes the number of available frames. The Welch estimate of the power spec tral density is given by Equation 4. The periodogram of the m block is given Equation 5 (Smith, 2011).
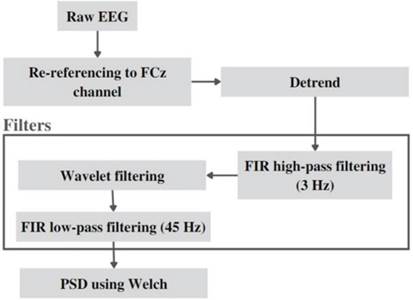
Note. This diagram shows the processing pipeline for EEG data, outlining the sequence of steps and the parameters used. The initial raw EEG data is first re-referenced to the FCz channel, which serves as a common reference point. Next, linear trends are removed (detrending) to minimize baseline drift. The data then undergoes high-pass filtering using a Finite Impulse Response (FIR) filter at a cutoff frequency of 3 Hz to remove low-frequency noise. After that, a wavelet-based filtering is applied to further denoise the signal. This is followed by a low-pass FIR filter with a cutoff frequency of 45 Hz to remove high-frequency artifacts. Finally, the Power Spectral Density (PSD) is calculated using the Welch method, providing a frequency-domain representation of the EEG signal. This pipeline aims to produce a cleaner signal for subsequent analysis and interpretation. Source: authors
Figure 4 Steps and Parameters of the Processing Pipeline for EEG Data
 (4)
(4)
 (5)
(5)
To obtain the PSD with this method, a Hamming window was chosen with an overlap equal to the sam pling frequency and length of each segment of 2 times the sampling frequency, obtaining values every .5 Hz.
2.5 Data Analysis
To establish the EEG signals recorded where VEP is presented, the signals to be analyzed were restricted to those recorded by the Oz electrode, since the area where this channel is located is closely associated with the ac tivity of the primary visual cortex (Carvalho et al., 2015; Marcar, 2018). Likewise, two criteria were used to se lect the signals that comply with the SSVEP. First, the power spectral density at the stimulation frequency (5 Hz) had to be greater than the average of the density of the neighbouring frequencies (4 Hz and 6 Hz), meaning that the signal-to-noise ratio (SNR) had to be greater than 1, and, additionally, the power spectral density at the stimulation frequency had to be greater than both neighboring densities. Equation 6 represents the signal- to-noise ratio (Meigen, 1999):
 (6)
(6)
 (7)
(7)
Where: mj : Magnitude of interest, nj : Average mag nitude of the two neighboring frequencies, corresponds to noise.
It is also verified that the frequency where the first harmonics are present fulfills the selection criteria.
A statistical analysis was conducted using the Wilcox on signed-rank test to compare two related paired sam ples: one set corresponding to PSD measurements ob tained while wearing glasses, and the other set correspond ing to PSD measurements obtained without wearing glass es. The purpose of this analysis was to determine whether there were significant differences in PSD when observing a visual stimulus with and without glasses.
Note. This figure illustrates the effect of the filtering process on EEG signals. The top subplot shows the raw EEG signal before any processing. The middle subplot presents the signal after removing linear trends (detrending). The bottom subplot depicts the signal after applying both wavelet-based and FIR (Finite Impulse Response) filters, demonstrating a clearer signal with reduced noise. The x-axis represents time, while the y-axis indicates the amplitude of the EEG signal. Each subplot includes a grid for easier reference and a legend in the lower right corner to identify each stage of the filtering process. Source: authors
Figure 5 Effect of the Filtering Process on EEG Signals
It is important to note that while the statistical test involves a null hypothesis regarding the similarity of dis tributions between the paired samples (Woolson, 2008), in this context, our focus was on identifying and quan tifying any observed differences, rather than testing a specific hypothesis. Thus, the analysis aimed to assess the magnitude of the differences between the two condi tions and determine their statistical significance.
This test was performed using the SciPy library in Python, and the significance level considered was .05.
2.6 Survey
User comfort was related to the performance of the rep resentative visual stimuli. This was measured subjec tively by a three-question survey administered to each participant at the end of each experiment. The survey questions were:
Please rate your comfort level during the procedure using the following options: Very comfortable, Comfort able, Normal, Increasing discomfort over time.
How well were you able to see the changes in the images presented, from the largest to the smallest?
Comments and suggestions.
The purpose of this survey was to assess the comfort level of patients during the enrolment process, with the goal of effectively presenting the portable capture device as a viable option that would be well received by participants.
3. Results
After the recording of the signals, the described prepro cessing pipeline was applied. The change in the signal of one of the subjects recorded after performing the filter ing process selected for the present study can be seen in Figure 5 . The first graph corresponds to the unfiltered signal, the second one, to the signal after eliminating linear trends, and the last one, the signal after applying the FIR filters and Wavelet de-noising.
After the acquisition and processing of the signals, these were analyzed in the frequency domain, expecting neural activation at the stimulation frequencies (SSVEP). Figure 6 shows the comparison of the PSD obtained for the subjects when observing the stimulus with and with out glasses. The values obtained for subjects with glasses and without them was 2.60±0.57 SNR and 2.17±.75 SNR, respectively. Neural activation on the stimulation frequency was achieved in both cases with significant dif ferences in amplitude (30 PSD).
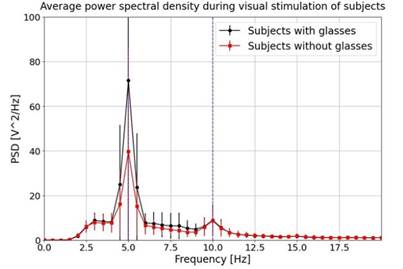
Note. This graph presents a comparison of the average power spectral density (PSD) at 5 Hz obtained during LogMAR 1.18 stimulation for two groups of subjects: those wearing glasses and those not wearing glasses. The x-axis represents frequency in Hz, while the y- axis indicates the PSD. The black curve represents the average PSD for subjects wearing glasses, while the red curve represents the average for those not wearing glasses. Error bars depict the standard deviation for each group. Dashed blue vertical lines at 10 Hz and 20 Hz serve as reference markers. This plot visualizes differences in PSD between the two groups, suggesting variations in visual processing depending on the pres ence or absence of glasses. Source: authors
Figure 6 Comparison of the Average Power Spectral Density (PSD) for the two Subjects
During this comparison, a paired non-parametric Wil coxon test was conducted with the null hypothesis, as suming that both groups originated from the same dis tribution. The obtained p-value of .03 indicated sta tistically significant differences, suggesting distinct be haviors in PSD when subjects wore and did not wear glasses. This signifies differences in visual perception with and without glasses, as supported by Figure 6, which demonstrates increased visual perception in sub jects when wearing glasses.
It is important to highlight that that not all sub jects had identical visual disorders prompting the use of glasses. However, given the aim of comparing general differences in visual perception (assessed through PSD response) when wearing versus not wearing glasses, the diverse range of visual disorders or impairments among participants facilitated the observation of the intended phenomena. Furthermore, all findings indicated a re duction in the amplitude of neural response at the stim ulation frequency, as expected due to decreased visual perception when not wearing glasses, despite the pres ence of varying visual disorders.
To compare EEG at rest and during stimulation, Fig ure 7 shows the average power spectral density during a eyes-open resting state and stimulation state, where both present a different behavior, mainly around the stimulation frequency (5 Hz), indicating changes in the neural activity due to the visual stimulation used.
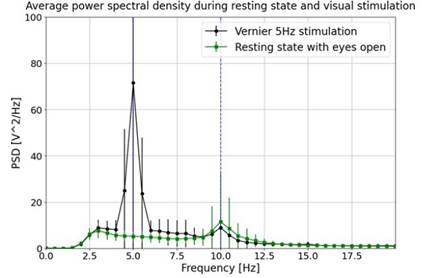
Note. It was used a Vernier pattern at 5 Hz, as part of LogMAR 1.18 stimulation, and during the eyes-open resting state. Error bars represent the standard devi ation. Dashed blue vertical lines at 10 Hz and 20 Hz serve as reference markers. Source: authors
Figure 7 Comparison of Average Spectral Density Obtained during Visual Stimulation
Bar plots were implemented to identify subject-level differences (see Figure 8). It shows that 90.5% of subjects have more neural activation using glasses than without glasses, and it could be explained by the correction of the visual acuity of the glasses. Additionally, there are two atypical values (Subjects 8 and 17, account for the variability observed in the power spectral density plots).
The results of the satisfaction survey showed how the subjects felt during the procedure, as illustrated in Figure 9. The results of the survey indicate that 42% of the sub jects reported feeling comfortable during the registration process, while 37% mentioned feeling very comfortable. A smaller percentage, 12%, expressed a neutral percep tion of their comfort level, describing it as “Normal”. Fi nally, only 9% of the participants reported an increase in discomfort over time throughout the registration proce dure, according to the survey responses. Likewise, most of the respondents had no suggestions or comments.
4. Discussion
This study successfully demonstrated the feasibility of acquiring, processing, and analyzing EEG signals of the visual system using a transferable EEG device. The cost effectiveness of OpenBCI, which is at least three times cheaper compared to traditional EEG devices, highlights the potential for developing affordable solutions in the field of EEG acquisition and analysis (Bach, 2019; Hemptinne et al., 2019; Kiiski et al., 2016; Sahel et al., 2021; Sarzaeim et al., 2022; Zheng et al., 2019).
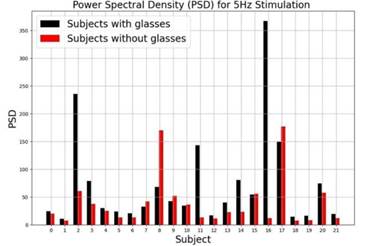
Note. Bar plot showing Power Spectral Density (PSD) during 5 Hz frequency stimulation for two groups: subjects with glasses (black bars) and subjects without glasses (red bars). The x-axis represents different subjects, and the y-axis indicates the PSD in the measured units. Source: authors
Figure 8 Power Spectral Density (PSD) during 5 Hz Frequency Simulation for the two Groups
Note. 37% reported feeling “Very comfortable”, 42% reported feeling “Comfortable”, 12% reported feeling “Normal”, and 9% reported experiencing increased discomfort over time. Source: authors
Figure 9 Distribution of Subjects’ Comfort Levels during the Test
The experimental setup utilizing OpenBCI as the portable EEG equipment proved to be suitable for clinical office imple mentation, as it does not require significant space and the overall cost is approximately 1060 USD, including the OpenBCI device, electrodes, electrode cap gel, and the display. The study employed specific visual stimuli, such as the Vernier stimulus, which are well-documented in the literature and known for eliciting steady-state visual evoked potentials (Tan et al., 2018; Zheng et al., 2020). Care was taken to ensure adequate stimulation times to prevent visual fatigue and enhance comfort for the subjects participating in the tests. This comfort is reflected in the results of the survey carried out, where more than 70% of the subjects expressed feeling comfort able or very comfortable during the registration. The perception results were taken with a subject approach and for future evaluations of the data. In the short term, this study seeks to characterize the ability of the ex periment to capture the SSVEP. However, in the long term it, it is proposed to implement a system like this for therapy inside or outside a doctor’s office, and the possibility of extending this stimulus in applications involving measure visual acuity. The results of the study demonstrated excellent visual activation in response to the Vernier acuity stimulus at 5 Hz for the LogMAR 1.18. The signal-to-noise ratio (SNR) values were 2.59±.57 SNR and 2.17±.75 SNR for subjects with and without glasses, respectively, indicating the potential improvement in neural activation through visual acuity correction. Regarding the stimulation equipment, certain factors that could introduce variability in the results were identified. These factors included the precision and accuracy of the equipment to present stimuli at the desired frequency, potential participant movements during stim ulation, inherent noise from participants’ signals, and visual fatigue from prolonged screen observation. The goal in this type of studies is to reduce complexity, cost, and difficulty by utilizing open-source or commercial BGI software, which enables adaptability to different experi mental situations and facilitates the operation of entire research programs. Low-cost EEG headsets offer porta bility and varying degrees of success for real-world oc cupational use, but open-source software and contextual development can enhance their potential. By leveraging open components and collaborative development, the BGI community aims to extend this technology to the general population and develop stable, scalable applications comparable to medical-grade equipment (Chan dran, 2020). In conclusion, this study contributes to the development of cost-effective and portable EEG so lutions for visual system analysis. It demonstrates the potential for applying transferable EEG devices in clin ical settings and highlights the importance of tailored visual stimuli for reliable neural activation (Tan et al., 2018; Zheng et al., 2020).
5. Conclusions
The conclusions of the study underscore its valuable con tribution to advancing cost-effective and portable EEG solutions for the analysis of the visual system. Notably, the research illustrates the feasibility of employing trans ferable EEG devices in clinical settings, emphasizing the significance of customized visual stimuli to ensure consistent neural activation.
The findings emphasize the potential of low-cost EEG in terms of portability, while acknowledging varying degrees of success in real-world occupational applications. The study suggests that the optimization of these devices can be achieved through the utilization of open- source software and contextual development, thereby enhancing their overall capabilities. The collaborative efforts within the Brain-Computer Interface (BGI) com munity, focusing on open components and shared devel opment, emerge as a promising avenue.
Future works in this field should concentrate on refining the performance of low-cost EEG through continued collaborative efforts. Additionally, exploring diverse visual stimuli and their impact on neural responses could further enhance the reliability and applicability of these devices. Further research could delve into the development of user-friendly interfaces and the integration of advanced signal processing techniques to elevate the overall effectiveness and accessibility of cost-effective EEG solutions. These endeavors will play a pivotal role in bridging the gap between affordable EEG technology and its widespread utilization in both clinical and occupational settings.

