English (pdf)
 Article in xml format
 Article references
 Send this article by e-mail
 Cited by SciELO
  Cited by Google
  Similars in
SciELO
Similars in
SciELO  Similars in Google
 Permalink
1. Introduction
Stroke is the disease with the second highest mortal ity rate in the world and the first cause of disability in developed countries (Roth et al., 2020). Stroke lesions are related to the interruption of blood flow, causing irreversible damage by tissue death on the brain cells (Rekik et al., 2012). The early localization, measure ment, and characterization of stroke lesions are critical to determine if a patient is a candidate for a reperfusion therapy. Computerized tomography (CT) is the most common study for stroke triage and diagnosis, due to the high availability in clinical centers and the relatively fast protocols of attention. Nonetheless, CT studies have low contrast, and the use in early stages is limited to triage analysis to distinguish between ischemic and hem orrhagic, or other brain affectations (Von Kummer et al., 1994). To complement such analysis, it is demanding to use perfusion protocols, obtaining complementary maps (CTP, CT perfusion) that describe the behavior of a fluid around the lesion. From this bank of multimodal CT and CTP studies, the expert should localize, and delineate lesions to characterize lesions and determine an attention protocol. This procedure is a tedious task that takes approximately 15 minutes per case (Martel et al., 1999), and a reported low concordance between experts (Neumann et al., 2009).
Computational strategies have recently been proposed to deal with automatic stroke segmentation from CT and CTP studies. Recently, these strategies have been based on deep autoencoders that learn to discriminate between healthy and hypoperfused tissue, guided by expert anno tations, allowing to support the segmentation (Liu et al., 2020; Wang et al., 2020). For instance, Tureckova and Rodríguez-Sánchez (2018) built a Unet with dilated con volutions to enlarge the receptive field, including a major computation context, and allowing the characterization of lesions with different sizes. Likewise, Dolz et al. (2018) built a multi-input autoencoder to model the intrinsic fea tures from each modality with a dedicated convolutional branch. Moreover, Clerigues et al. (2019) separated the images into small patches, to build a balanced dataset with the same number of lesions and healthy patches. Sub sequently, the balanced patches dataset was used to train an asymmetric autoencoder. Alternative strategies have used generative frameworks to segment ischemic lesions from synthetic diffusion-weighted MRI modalities, which have greater sensitivity in the acute setting. For instance, Liu (2019) built a GAN strategy to generate synthetic diffusion-weighted imaging (DWI) sequences from CTP maps which were used afterward to estimate the lesions using a Unet.
This work introduces a novel deep cascade strategy that includes multimodal inputs (GT and CTP maps) to segment ischemic stroke lesions. For doing so, a deep autoencoder is herein adjusted embedded multimodal information and decodified lesion annotations, follow ing a supervised scheme. From the architecture, mul tiple additive-cross attention mechanisms are included between the encoder and decoder to force representa tion to stand out hypoperfused marks and regions as sociated with stroke lesions. From the learning scheme, this work introduced a cascade scheme to refine lesion estimations in two stages. In the first stage, the architec ture is optimized to generate synthetic CTP maps that complement information and help with stroke localiza tion. Afterward, in the second stage, the synthetic input together with GT and CTP studies estimates a refined Stroke lesion.
2. Proposed Approach
We propose a cross-attentional autoencoder to segment ischemic stroke lesions from GT and CTP parametric maps. The proposed architecture is trained under a cas cade framework that monitors the contribution of all de coder levels, and a weighted loss function to deal with the natural class imbalance of stroke segmentation. In a first cascade stage, synthetic maps are generated to guide and refine stroke segmentation in further stages. The general description of our proposed framework is described in Figure 1.
2.1 Additive Cross-Attentional Autoencoder
Nowadays, autoencoders are the most used architecture to deal with stroke lesion segmentation. Specifically, Unet (Ronneberger et al., 2015) autoencoder includes skip connections to integrate deep features from the encoder to the decoder, in the same level of process ing. In such cases, the architecture has been proven to be ideal in problems that require the recovery of struc tural and global shape information. Nevertheless, these connections could integrate uncorrelated features into the decoder representation, harming the decoder rep resentation and slowing the learning process. Hence, we implement a special autoencoder that includes cross attention mechanisms (ATT) as skip connections, pre serving highly correlated features, and following an ad ditive alignment (Gómez et al., 2023).
In general, the cross-attentional architecture is a con volutional neural network (CNN) that receives a GT im age (I(x)) and CTP parametric maps (Mp(x)) in a sim ple concatenation scheme ({I(x);Mp(x)}). The encoder maps the sequences into a low-dimensional latent space representation (h -> S'(x)) that retains the most impor tant visual stroke patterns. Next, the latent vector is decoded into a probability map (S'(x)) that highlights potential hypoperfused regions. In every level of the decoder, the convolutional activations (X l d ) are comple mented by the responses from the encoder (X l e ) on the same processing level (Z) with additive cross-attention modules. To compute the similarity between encoder and decoder features, both features are linearly projected, summed, and activated with a ReLU (a 1) func tion to consider only positive similarities. Following this, a single attention map is calculated using a 1 x 1 convolutional layer and a sigmoid activation (a2) func tion. Thereafter, refined characteristics are computed from the encoder (X re) with a Hadamard product (0) between the features of the encoder and the attention map. The refinement of encoder features is described by: /
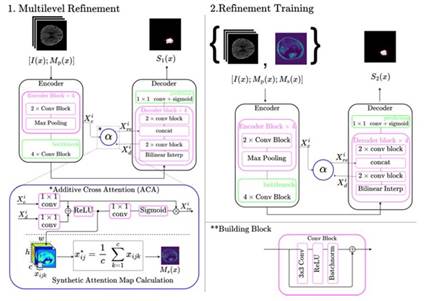
2.2 Multilevel Refinement
To deal with the natural class imbalance of stroke seg mentation and promote the learning of deep features in the attentional autoencoder, the cross-attentional ar chitecture is adjusted with multilevel refinement (MR) in the decoder. The multilevel refinement consists of monitoring the contribution of the decoder blocks with a weighted loss between a low-scale prediction and the ground truth. To measure this contribution, deep su pervision layers were placed in the decoder blocks from all levels. This deep supervision consists of applying a bilinear interpolation on output features, followed by 1 x 1 conv and sigmoid activation to estimate a low- scale version of the stroke lesion. Deep supervision of the representation allows to minimize the propagation of errors and avoid the vanishing of the gradient (Li et al., 2022). The loss function is a binary cross-entropy, weighted by class weight maps (C) that give more im portance to lesion pixels. These weight class maps are built from the manual delineations of the ischemic le sions as a reference and assign a specific weight to the pixels of the same class. Consequently the estimations are used alongside their corresponding weight maps to calculate the final loss as:  where , Ŷ
l
is the model’s prediction at each level l, and W
l
is a positive number evidencing the importance of the lth layer segmentation.
where , Ŷ
l
is the model’s prediction at each level l, and W
l
is a positive number evidencing the importance of the lth layer segmentation.
2.3 Cascade Training
Typically, stroke is assessed from multiple CT sequences. In particular, perfusion studies record the blood flow through the brain parenchyma, potentially indicating brain damage due to stroke. From these CTP studies are computed parametric maps that summarize kine matic information, allowing to approximate indexes re lated to the damaged tissue. To exploit the non-local information from these CTP sequences, we conducted a cascade training to i) learn attention maps that high light the ischemic stroke lesion visual patterns and ii) segment the acute ischemic stroke lesions. In the first phase, the proposed attentional autoencoder is trained to segment the ischemic stroke lesions from the CTP inputs. During training the attention maps learn to highlight regions that resemble ischemic patterns. After wards, from the additive-cross attention module in the first level, synthetic maps Ms(x) are obtained by aver aging the positive similarities across channels. Finally, the proposed architecture is adjusted from the concate nation of the CTP inputs and the synthetic attention map ([I(x);Mp(x);Ms(x)]). These maps emphasize the most important parts of the image and a possible indi cation of the shape of the lesion, guiding the network when segmenting if they are added from the start.
Table 1 Dice Score for Different Configurations of the Proposed Method with all the Present Modalities on the ISLES2018 Dataset
| Configuration | Modalities | |||||
|---|---|---|---|---|---|---|
| MR | ATT | NCCT | CBV | CBF | TMax | MTT |
| X | X | .20 ±.26 | .51 ±.30 | .57±.26 | .50±.25 | .56 ±.30 |
| ✓ | X | .26 ±.24 | .51 ±.27 | .58 ±.22 | .55 ±.26 | .57±.26 |
| ✓ | ✓ | .24±.19 | .54 ±.28 | .57±.23 | .55 ±.28 | .55±.21 |
Note. MR is for multilevel refinement and ATT is for attention mechanisms.
3. Experimental Setup
The proposed methodology was validated on the Ischemic Stroke Lesion Segmentation 2018 (ISLES2018) public dataset. This dataset contains 156 studies of patients di agnosed with acute ischemic stroke, and it is partitioned in 94 training studies and 62 testing studies. Each study contains a plain CT image, the raw 4D perfusion study, and four parametric maps, namely cerebral blood flow (CBF), cerebral blood volume (CBV), mean transit time (MTT), and time to maximum (TMax). The segmen tation of the ischemic lesions was performed manually by expert radiologists over DWI sequences, acquired af ter the CTP. The delineations are only available for the training studies.
The cross-attentional autoencoder is made of convo lutional blocks with two 2D convolutional layers that include batch normalization and a ReLU activation. In total, the encoder and decoder both have six levels of processing with 32, 64, 128, 256, 512, and 1024 filters, respectively. In each encoder level, max-pooling layers, with a reduction factor of 2 were included after every con volutional block to reduce the spatial dimensionality. Bi linear interpolations were added pre-convolutional block to expand the spatial dimensionality by a factor of 2 in the decoder.
For training, 19 studies were randomly excluded from the training set to use as validation. All images were re sized to 224x224. The training was done for 600 epochs with a binary cross-entropy loss, and an AdamW opti mizer with an initial learning rate of 3e-2, and weight decay of le-5. Furthermore, data augmentation such as random brightness and contrast, flips, rotations, random elastic transformations, and random grid and optical dis tortions were applied to the slices. The weights for the segmentation outputs were set to W = {.03, .045, .05, .125, .25, .5} and the weights used to construct the class weight maps were .7 for the lesion and .3 for the background.
4. Evaluation and Results
Firstly, we carry out an ablation study to measure the contribution of each modality included in this study, and the contribution of each component of the proposed ap proach. Hence, in the first experiment, we measured the performance of unimodal models to exploit the informa tion available on every modality of the dataset. Table 1 shows the dice score for all the selected configurations on every modality on the dataset.
The best configuration was achieved from the archi tecture with MR (.58), and using CBF maps. Is notewor thy an improvement on the dice score of .026 and .022 for the configurations MR and MR ± ATT compared with the standard autoencoder. There is also a considerable difference in the models that use CT together with the parametric maps. This fact is due to the low CT sen sitivity. As the image shows, the best overlap with the expert’s segmentation is obtained when using the para metric maps in comparison to the CT one which failed in both localization and characterization of the lesion. In this case, multimodal information provides better ap proximations when generating the segmentations.
In a second experiment, we exploit the multimodal nature of the adjusted autoencoder. For doing so, the ar chitecture was adjusted using multi-context information, i.e., following an early fusion of the CT and parametric maps at the input of the autoencoder. Table 2 shows the obtained results for every chosen parametric map group and configuration of the model. In such cases, there exists an exhaustive validation regarding the com ponents of the architecture, as well as, the combination of potential maps that observe lesion findings.
As observed, the proposed cascade methodology has the capability to fuse and take advantage of lesion find ings observed from different studies. In fact, the mod els that include multicontext information are superior to unimodal models. The best performance (.63) is ob tained by two configurations, the one that uses all para metric maps with the original CT and the one that uses a combination of Tmax, CBV and CBF. Nevertheless, the mean dice scores for the experiments with all inputs are more consistent than the combination that only uses three of them. An example of the output segmentations obtained is presented on Figure 3. As this image il lustrates, the MR and attention mechanisms provide a greater degree of local delineation, preserving particular structures of the lesion and obtaining a great overlap in the masks.
Table 2 Dice Score for Different Configurations of the Proposed Method with Different Combinations of Modalities from the ISLES2018 Dataset
| Configuration | Modalities | |||||
|---|---|---|---|---|---|---|
| MR | ATT | TMax+CVB | TMax+CBF | CVB+CBF | TMax+CVB+CBF | All |
| X | X | .58 ±.25 | .58 ±.24 | .53 ±.26 | .60 ±.24 | .62 ±.23 |
| ✓ | X | . 61 ±. 23 | . 62 ±. 20 | .54 ±.27 | . 63 ±. 21 | .63 ±.22 |
| ✓ | ✓ | .60 ±.23 | . 62 ±. 21 | . 55 ±. 25 | .61 ±.25 | . 63 ±. 16 |
Note. MR is for multilevel refinement and ATT is for attention mechanisms.
Note. The red line shows the shape of the lesion indicated by the expert and the blue one the output from the network
Figure 2 Examples of the Realized Segmentation for Every Modality of the First Table
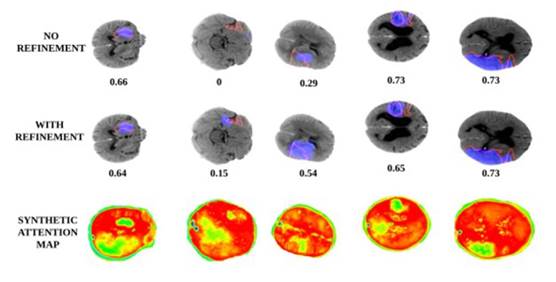
Finally, Figure 4 shows the achieved results with and without cascaded refinement stages. Also, it is observed in the last row the output synthetic maps, generated by the autoencoder in the first phase, which is then used to complement inputs in a refinement stage. As observed, the use of a cascade strategy allows to deal with the chal lenging problem of stroke lesion segmentation, allowing among others to obtain a better overlap score, but at least, allowing to localize tiny lesions, which are indica tive of early stages of the disease. Additionally, these synthetic maps can potentially be used in clinical prac tice to support observational analysis, for instance, in centers that only have available CT studies.
5. Conclusions and Perspectives
This work introduced a cascade training scheme that ad justs a deep attention autoencoder to segment stroke le sions. The introduced methodology has the ability to manage multi-context information, allowing an early fu sion of parametric maps (CTP) and CT studies. The introduced cascade training strategy in the first stage generates a synthetic map that complements studies to observe localizations, while in the second stage achieves a refinement of the lesion. The reported results evidence a better support of cascade strategy, that together with the multilevel refinement and the attention mechanisms, achieve the localization and delineation of stroke lesions. The proposed approach was validated on a public dataset outperforming results, but also showing the challenges on the stroke segmentation from raw CT studies. Future works include alternative mechanisms to learn from mul tiple modalities. Also, the validation on extra datasets that include additional studies, but also multiple expert radiologists to avoid the bias from an expert.
Note. The red line shows the shape of the lesion indicated by the expert and the blue one the output from the network.
Figure 3 Examples of the Realized Segmentation for Every Modality of the First Table