INTRODUCTION
Banana (Musa AAA Simmonds) is one of the more consumed fruits worldwide because of its nutritional contribution. In 2019, this species was planted in 5,158,582 ha, with a production of 116,781,658 t, where countries such as India (26.0%), China (10.2%), Indonesia (6.2%), Brazil (5.8%), and Ecuador (5.6%) are the main producers. Colombia ranks tenth in production with 2,914,419 (2.5%) in 105,609 ha (FAO, 2021). Bananas are of economic and social importance, being the third agricultural export product after flowers and coffee (ICA, 2019). In 2020, Colombia produced a total of 109 million boxes for export from 51,454 ha. The Uraba region of Antioquia has the largest established area with 36,582 ha and a production of 1,299,526 t (AUGURA, 2021). One of the greatest challenges for banana production in this region is implementing agronomic management strategies to reduce the negative effects of climate variability on crop yield (Barrera et al., 2020). As part of this strategy, determining the physiological responses of plants and how they are affected by environmental aspects such as climate, nutrition, and agronomic management is of great importance to recognize the main factors that affect production (Maxwell and Johnson, 2000; Sánchez-Reinoso et al., 2019). One of the more regularly affected components is photosystem II (PSII) because of deficiencies in nutrition, changes in climatic variables, soil conditions, and damage generated by crop management. This leads to a reduction in light absorption and increases the dissipation mechanisms of excess energy by fluorescence (Maxwell and Johnson, 2000).
The description of the photosynthetic process in terms of photochemistry and its dissipation in heat and other forms has been of great value in characterizing the responses of plants. The chlorophyll fluorescence protocol with functional parameters has made it possible to understand the responses of plants to the associated external factors that affect photochemistry and the relationship between assimilated light energy with a reduction in the assimilation of carbon potential crop yield (Adak, 2018). Chlorophyll fluorescence has been used to understand the physiological mechanisms of cold tolerance in banana plants (Zhang et al., 2012); nutritional deficiencies such as iron (Catalina, 2015), calcium (Sanz et al., 2001), and nitrogen (Pérez et al., 2017) have been used to identify mechanisms of resistance to drought stress in bananas (Ravi et al., 2013) and for monitoring and early detection to reduce the spread of diseases in crops (Kim et al., 2019). However, little is known about the participation of chlorophyll fluorescence parameters and their relationship with the productive potential of bananas in terms of climatic and edaphic supply. Therefore, this study aimed to identify correlations between the maximum quantum efficiency of PSII (Qy= Fv/Fm) with climatic and edaphic variables associated with fruit yield, helping to determine an indicator that explains variations in banana fruit yield.
MATERIALS AND METHODS
Location
The study was conducted in the Ramiro Jaramillo Sossa - AUGURA-CENIBANANO Experimental Field (CE) located in the municipality of Carepa, Antioquia (Colombia) (7°46'48.2" N; 76°40'23.0" W) in 2007, a farm dedicated to the conventional production of bananas for export. The experimental field is at 20 m a.s.l., with an average temperature of 27.0ºC, solar brightness of 1,800 h year-1, relative humidity of 87%, and rainfall of 2,933 mm with 28% distributed in the first semester (cycle) and 62% in the second semester of production (Pérez and Torres-Bazurto, 2020). An AgroMET meteorological station (RainWise® Inc.) and 15 min intervals were used to determine the climatic variables: radiation (W m-2), temperature (°C), relative humidity (%), dew point (°C), atmospheric pressure (mb), rainfall (mm), wind speed (m s-1) and vapor pressure deficit (VPD).
Experiment design
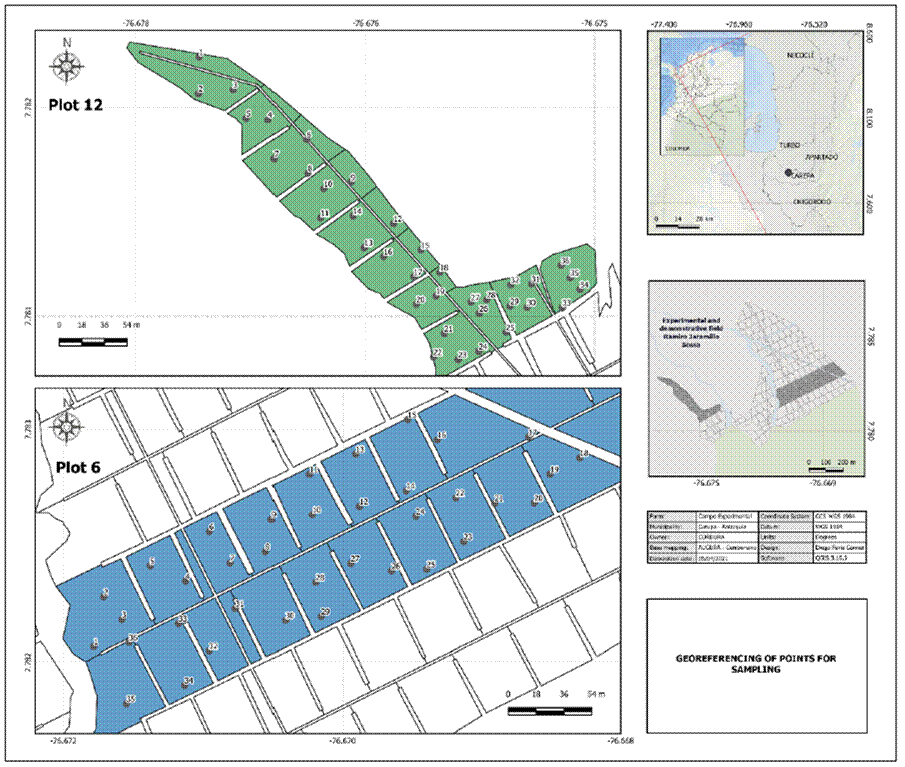
This work was an observational study. Two experiment areas (plots) of 1,563 m2 were selected, with two productive levels. The first plot (P12) was planted in 2007, with an average weight of 27.13 kg per bunch, and the second (P6) plot was sown in 2005, with an average bunch weight of 22.91 kg. Each experiment plot (Fig. 1) had 36 productive units (mother-daughter) of bananas that were randomly selected, with a single successional sucker in an F10 + 2 physiological stage (leaf three emitted entirely). The plant material was from the Musa AAA group, Cavendish subgroup, Gran Nain clone, sown at a density of 1,780 plants/ha in plot P6 and 1,685 plants/ha in plot P12.
Chlorophyll a fluorescence
The maximum fluorescence (Fm), basal (Fo), variable (Fv), and maximum quantum efficiency of the PSII (Qy = Fv/Fm) were estimated in the middle third of the leaf in the sucker in each production unit. The chlorophyll fluorometer OS30p+ (Opti-Sciences) was used on dark-adapted leaves (30 min) with a modulation light intensity at 70% and saturation light intensity at 3,600 μmols at 60% with the width of 1.0 s. This was repeated until leaf F10 + 10 (independent vegetative stage), always ensuring the leaf sampling was in position three from week 47 of 2020 to week 8 of 2021.
Soil analysis
A soil sample was taken at 0.3 m from the pseudostem in each production unit. The soil texture was determined using the Bouyoucos (1936) method (hydrometer), while the soil pH was estimated using a SevenCompact S220 pH meter with Inlab sensor® Expert Pro - ISM (Mettler - Toledo) in 1:1 solution (20 g of soil: 20 mL of distilled water). Additionally, soil penetration resistance was determined in the first 0.8 m depth at each site, using a 6.08 Penetrometer (Eijkelkamp) with a Thetaprobe ML3 soil moisture sensor.
Foliar nutrient content
In the sucker of each productive unit, samples of leaf tissue between 10 and 15 cm wide were taken (perpendicular to the central rib) on leaf number three (3). The samples were washed with distilled water and oven-dried at 45°C for 2 weeks, ground and sieved to 2 mm, and analyzed in the Soil Health Laboratory BioFertilizar S.A.S. to determine the content of foliar nutrients: nitrogen (Kjeldhal method), phosphorus (Phosphomolybdate complex colorimetric method), sulfur (Bactogelatin BaCl2 turbidimetry method), boron (Azomethin h colorimetric method) and the nutrients calcium, magnesium, potassium, iron, manganese, copper, and zinc (atomic absorption method).
Bunch weight
The average bunch (11 weeks) weight of the plants at harvest in each plot was recorded weekly using an XR3000 (Tru-Test®) electronic scale.
Statistical analysis
The experiment design used in the field was an observational and longitudinal study without intervening in their natural course over time (Manterola and Zavando, 2009). Assumptions of normality and homoscedasticity for Qy (Fv/Fm) were carried out with Kolmogorov-Smirnov and Bartlett tests (P<0.05), respectively. Since the data did not meet these assumptions, the comparison of significant differences for Qy was done using the Kruskal-Wallis rank-sum test (P<0.05). Once the comparisons were made between the leaves emitted from the F10, a correlation of the group of leaves of equal efficiency and the climatic variables was carried out, using a two-way ANOVA. For this, the value of the median Qy every 15 min was used as a sample for its correlation with radiation, temperature, VPD, humidity, dew point, atmospheric pressure, wind speed, and streaks through Pearson correlation (P<0.05) and principal components analysis.
For the correlation with the soil variables (pH, proportion of soil particles, and resistance to penetration), the average Fv/Fm per sampling point was used, and a Pearson raster correlation was calculated in SAGA (2.3.2) using the scatter plot tool. On the other hand, the rainfall was correlated using accumulated values at 7 d before the measurement of Qy. For the correlation with weekly yield (average bunch weight), the bias that presented a higher Pearson correlation coefficient (P<0.05) with the Qy curve from leaf six was evaluated. All analyses were carried out with the statistical software R (v. 4.1.0), using the libraries agricolae (De Mendiburu, 2021), nortest (Gross and Ligges, 2015), ggplot2 (Wickham, 2016), and GGally (Schloerke, 2021).
RESULTS AND DISCUSSION
Chlorophyll a fluorescence
Qy (Fv/Fm) is subject to the foliar development of bananas. Figure 2 shows the quantum yield of photosystem II (Qy) for each leaf emitted in the independent vegetative phenological stage (F10 ± 11 leaves). In this stage, the banana plant emits several leaves (± 12) before floral differentiation. The Qy values increased from leaf F10 to F10 + 4, at which point the emitted leaves presented similar values for the quantum efficiency of Photosystem II. This variation was associated with the fact that even though leaf F10 is a functional leaf, it is the first completely open leaf that the sucker emits and begins the stage of independent vegetative growth; from this moment on, the leaves increase in size and functionality. From leaf number 5 (F10 + 4) to number 9 (F10 + 8), Qy remained constant. This behavior shows that, although the photosystems are active in the leaf tissue, leaf development significantly influences efficiency.

Figure 2. Maximum quantum efficiency of PSII (Qy = Fv/Fm) in each banana leaf emitted by Cavendish subgroup, Gran Nain clone. According to the Kruskal-Wallis test, boxes with different lowercase letters indicate statistical differences between leaves (P≤0.05).
In banana cultivation, two stages are identified during the development of plants: a vegetative stage characterized by the emission of leaves and a productive stage easily identifiable by the emission of inflorescence. There is a phase known as the dependent vegetative during the vegetative stage where sucker development depends on the mother plant. Once the sucker emits the F10 leaf (10 cm wide), the plant enters the independent vegetative stage (Lobo et al., 2020).
According to Robinson and Galán (2010), the first leaves produced from the central meristem of a developing banana regrowth (sucker) are scale leaves, followed by narrow sword-shaped leaves and broader leaves with blades that gradually widen to mature. Thus, leaf F10 signals the end of hormonal inhibition of suckers by mother plants and the beginning of the emission of leaves that begin to significantly increase their size (Donato et al., 2015).
In this study, the F10+9 and F10+10 leaves showed severe attack by the phytophagous mite (Tetranychus sp.), commonly known as “red spider mite”, which generates foliar tanning through its feeding, with a significant decrease in Qy. Similar results were reported by Chacón-Hernández et al. (2018), who indicated that prolonged feeding periods by Tetranychus urticae result in a significant decrease in the content and fluorescence of chlorophyll in rose crops; and Buffon et al. (2020), which verified a decrease in chlorophyll fluorescence parameters in rice species attacked by the mite Schizotetranychus oryzae (Acari: Tetranychidae).
Chlorophyll a fluorescence - climate relationship
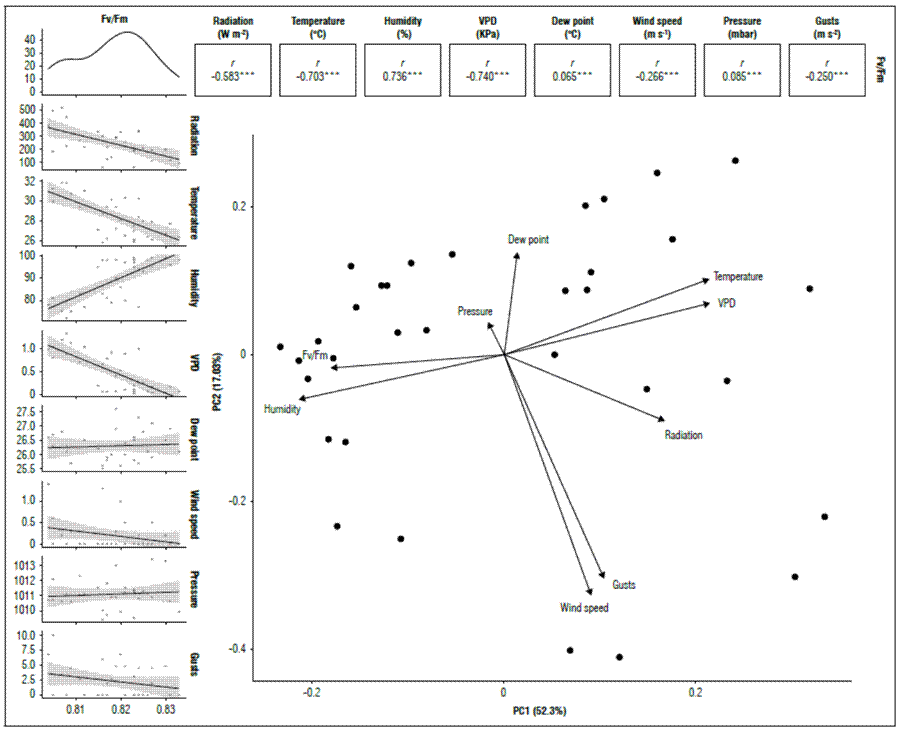
When the Qy was related to the climatic variables, a significant correlation (P<0.05) was found for the quantum yield of chlorophyll a, compared to the behavior of temperature (-0.703), VPD (-0.740), and radiation (-0.583); environmental factors that have an immediate influence on the functioning of the Photosystem II and are inversely proportional (Fig. 3).

Figure 3. Correlation between climatic variables and PSII quantum yield (Qy=Fv/Fm) in banana leaves of Cavendish subgroup, Gran Nain clone.
Adams et al. (1989) measured Qy during the day. They found that, as the day progresses, this variable decreases as the result of an increase in temperature and radiation, which reach their maximum peaks in the afternoon. However, Qy values increase again towards the afternoon hours. The contrary was reported by Thomas and Turner (2001), who evaluated this variable during the day at total sun exposure; however, Qy decreased throughout the day. Temperature also affects quantum efficiency; Haldimann and Feller (2004) found that, when exceeding 35°C, this variable begins to reduce significantly, results that coincide with that reported by Havaux (1993) in potatoes. Although this temperature was never reached in this study, the results showed a sensitivity of bananas to temperature variations over 30°C, with a decrease in Qy.
For relative humidity, there was a high and positive correlation with Qy. It should be noted that both temperature and relative humidity are climatic variables that regulate the VPD in the atmosphere directly and inversely proportionally, respectively. VPD has been identified as one of the most determining factors in the functioning of plants and has been considered one of the more important causes of plant mortality, mainly induced by water deficits. In this sense, Grossiord et al. (2020) suggested that stomatal conductance decreases with a high VPD, and transpiration increases up to a given VPD threshold in most species, leading to a cascade of subsequent impacts, including reduced photosynthesis, growth, and production.
Accumulated rainfall and Fv/Fm had a low correlation of 0.13, not significant (P=0.45). This result was due to the indirect relationship that rain has with the response to stress in leaves, which also indicates that high rainfall does not translate into an increase in Qy or vice versa; the adequate availability of moisture in the soil regulates the response of the photosynthetic apparatus. Authors such as Bukhov and Carpentier (2004) indicated that Qy is not sensitive to early or moderate water stress only when it is due to severe drought or severe water deficits and in certain species. Even under greenhouse conditions, the induction of water stress affects the variation significantly in Qy after 15 d (Živčák et al., 2008), while results obtained by Da Silva and Arrabaça (2004) did not find a correlation between Qy and rapid water stress (RWS). However, a water deficit generates dehydration and overheating of cells and tissue, reducing the CO2 assimilation capacity and, finally, the yields of certain crops (Ravi et al., 2013). Work carried out by Robinson and Bower (1988) showed that growth and yield decreased drastically when soil moisture fell below 66% of the total available soil moisture in banana cultivation.
Chlorophyll a fluorescence - soil relationship
When the soil physical properties and the Qy were correlated, higher coefficients were presented for pH in plot P6, with a resistance to penetration of 0.3-0.6 m in plot P12 and values of r² of 12.77 and 24.28%, respectively (Tab. 1).
Table 1. Correlation coefficients between the soil physical properties and the quantum yield of PSII (Fv/Fm) in banana leaves of Cavendish subgroup, Gran Nain clone.
| Physical properties | Correlation coefficients* (r²) for Qy (Fv/Fm) | |
|---|---|---|
| Plot P6 | Plot P12 | |
| Soil pH | 12.77 | 2.57 |
| Clay (%) | 1.19 | 0.27 |
| Sand (%) | 0.66 | 2.55 |
| Silt (%) | 0.38 | 3.14 |
| Penetration resistance 0-0.3 m (MPa) | 0.34 | 0.08 |
| Penetration resistance 0.3-0.6 m (MPa) | 3.79 | 24.18 |
| Penetration resistance 0.6-0.8 m (MPa) | 5.63 | 3.29 |
* Pearson raster - raster correlation using the scatterplot tool (P<0.05).
This result indicated a spatial distribution of low Qy zones with a pH lower than 5.4 (Fig. 4A) and resistance below 1.36 Mpa (Fig. 4B).

Figure 4. Spatial correlation of soil variables and the quantum yield of PSII (Qy=Fv/Fm). A: plot number 6 and B: plot number 12.
The maximum photochemical efficiency of PSII (Fv/Fm) and the effective light quantum yield [Y (II)] in blueberry (Vaccinium spp.) leaves decreased as the soil pH increased, going from 0.787 (pH 4.5) to 0.745 (pH 6.0) (Jiang et al., 2017). High pH values influence the absorption, transport, and distribution of nutrients in plants, lead to an imbalance of nutrients and affect plant growth and development. A change in chlorophyll a fluorescence can indirectly reflect a shift in photosynthetic activity and yield potency. Therefore, it is possible to indirectly measure the photosynthesis capacity of plants through the fluorescence of chlorophyll (Jiang et al., 2017).
Chlorophyll a fluorescence - foliar nutrient content relationship
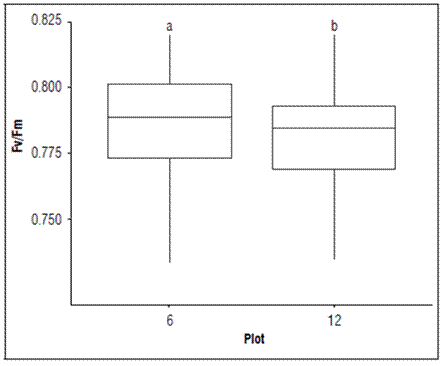
In both plots, the Fv/Fm presented statistical difference, where the highest value was recorded in P6 (lower production) and the lowest in P12 (higher production) (Fig. 5).

Figure 5. Maximum quantum efficiency of the PSII (Qy=Fv/Fm) in each plot of banana leaves of Cavendish subgroup, Gran Nain clone. According to the Kruskal-Wallis test, boxes with different lowercase letters indicate statistical differences between leaves (P≤ 0.05).
This result may be related to the availability of some elements in the leaves (Tab. 2), where P12 had lower concentrations of nitrogen, manganese, and boron than P6. However, P12 had higher production, with a better balance in the different relationships between the nutritional elements in the leaf tissue. According to Cheng et al. (2000), for significant changes in the variation of Qy to occur, the nitrogen contents in leaves must be below 2%, a situation that occurred for the Qy values registered in both plots of production but was lower in P6 (lower yield).
Table 2. Foliar chemical analysis of banana Cavendish subgroup, Gran Nain clone in the study areas (P6 and P12).
| Mineral nutrient | Optimal ranges * | Plot | |||
|---|---|---|---|---|---|
| 6 | Category** | 12 | Category** | ||
| N % | 2.70-3.60 | 1.97 | B | 1.89 | B |
| P % | 0.16-0.27 | 0.12 | B | 0.15 | B |
| K % | 3.20-5.40 | 1.73 | B | 1.94 | B |
| Ca % | 0.60-1.20 | 0.32 | B | 0.43 | B |
| Mg % | 0.27-0.60 | 0.17 | B | 0.18 | B |
| S % | 0.16-0.30 | 0.11 | B | 0.14 | B |
| Fe (mg kg-1) | 80-360 | 100 | M | 115 | M |
| Mn (mg kg-1) | 200-1,000 | 190 | B | 150 | B |
| Cu (mg kg-1) | 6-30 | 12 | M | 16 | M |
| Zn (mg kg-1) | 20-50 | 23 | M | 35 | M |
| B (mg kg-1) | 10-25 | 17 | M | 11 | M |
Interpretation: B: low (poor); M: medium (sufficient); H: High. Osorio (2014).
Chlorophyll a fluorescence - bunch weight relationship
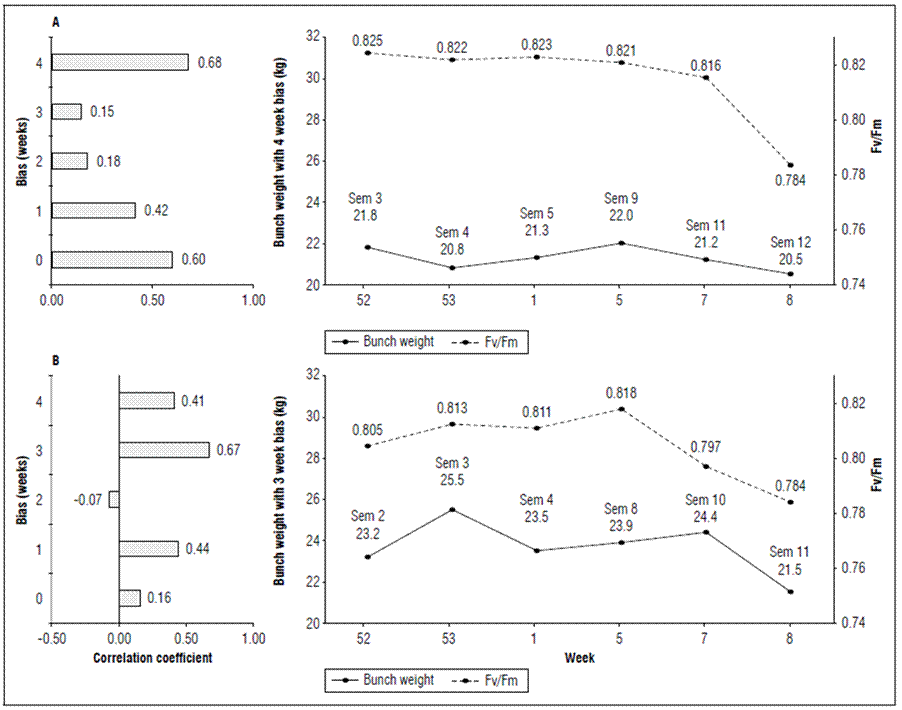
The weekly average bunch weight curve was evaluated with different biases (0 to 4 weeks) to the Qy measurement, where the highest r² = 0.68 was seen four weeks after measuring the quantum yield efficiency in banana leaves in plot P6, and three weeks with r² = 0.67 in plot P12, which represents, in addition to a faster sensitivity of plot P12 to stress, a decrease of approximately 1.5 kg in the bunches of P6 and 2.9 kg in P12 after the collapse in Qy occurred in week 5 (Fig. 6).

Figure 6. Correlation with time-biased production and quantum yield of PSII (Qy=Fv/Fm) in banana leaves of Cavendish subgroup, Gran Nain clone. A: P6, and B: P12.
It is important to note that, although P6 had higher Qy values than P12, it continued to present lower values in the average bunch weight, which indicated that production is sensitive to the variation in PSII efficiency within the same plot but, in terms of other plots, it is not correlated with the eigenvalue of Qy.
CONCLUSION
The variation of the Qy was correlated with environmental variables, such as radiation, temperature, VPD, relative humidity, soil pH, and soil resistance to penetration. The quantum yield of the photosystem II explained reductions in fruit yield that impacted farm productivity as a response of banana plants to any stress.


