INTRODUCTION
Croton is a genus in the Euphorbiaceae family with about 1,300 widely distributed species in tropical and subtropical regions, mainly in arid and semi-arid areas, with greater diversity in Brazil, Madagascar and the Caribbean(Luján et al., 2015). It is the second most numerous and diverse genus and encompasses herbs and trees with varied leaf forms, with glands at the base of the leaf or on the petiolo and female flowers with reduced or absent petals. Most Croton species have secretory structures such as floral and extrafloral nectaries (Salatino et al., 2007; Luján et al., 2015) and have abundant compounds with biological activity, mainly diterpenoids and active alkaloids (Milanowski et al., 2002; Block et al., 2004). Taspine is a minor alkaloid found in the sap of mature trees (Perdue et al., 1979).
A wide range of chemical compounds, such as terpenes, alkaloids and others with biological, medicinal and industrial properties, impart a high economic potential to the Croton genus. (Murillo, 1999). The Croton genus is characterized by species with a large number of uses at the ethnobotanical level, as validated by ancestral stories and the bibliography of recent decades. In Colombia, the first records date back to 1940, where 13 new species were reported along with a taxonomic and biogeographic discussion of related species. No new updated reviews of the genus Croton are known in Colombia (Coy et al., 2016). Croton is frequently used by indigenous communities in South America. A red latex is obtained from trees that is popularly known as "Drago's blood", which is used to treat different diseases(Godoy et al., 2020). Several species are used in traditional medicine on different continents. Popular uses include treatments for cancer, constipation, diabetes, digestive problems, dysentery, fever, hypertension, malaria, and ulcers, among others (Salatino et al., 2007). More traditional and medicinal uses for Croton have recently been reported (Costa et al., 2020).
Croton is widely distributed in the Department of Norte de Santander (Colombia). However, despite the importance of this genus at a cultural and medicinal levels and its pharmacological potential thanks to the high chemical diversity in the trees of this genus, no studies have been reported on genetic variability among Croton species in this department. Informative intraspecific genetic markers are important for evolutionary and conservation genetic studies. Nuclear ribosomal ITS has been the most used marker for evolutionary studies in different plant species. The ITS region is flanked by well-conserved rRNA genes and universal primers that can be used for widely different plant groups, avoiding the need for developing specific primer sets, such as the case of SSR markers (Mäder et al., 2010). The objective of this research was to study genetic diversity and phylogenetic relationships based on the ITS regions in Croton genotypes from Norte de Santander.
MATERIALS AND METHODS
Plant samples
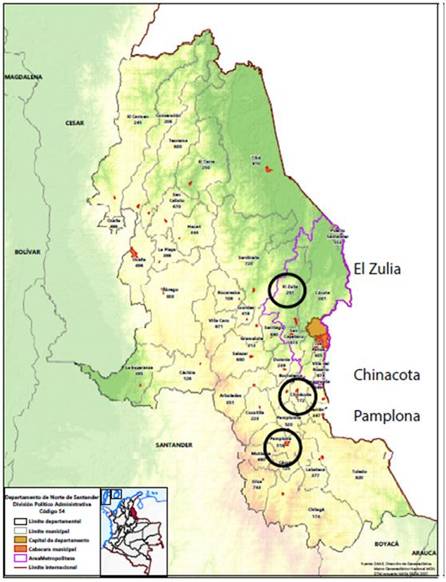
Young leaves of Croton genotypes were collected in three different municipalities in Norte de Santander (Colombia): Chinacota, El Zulia and Pamplona (Fig. 1). From each locality, 10 individuals were sampled. The criteria for the collection of samples were those described by Farias et al. (2009): (1) healthy in appearance, (2) approximately the same height (12 m), and (3) approximately the same diameter at base height (30 cm). The leaves were packed in paper bags, labeled, stored in a polystyrene refrigerator with dry ice and taken to the FITOBIOMOL research laboratory at the Francisco de Paula Santander University, Cucuta, where they were stored in a Thermo ScientificTM FormaTM 88000 series freezer (Thermo, Waltham, MA) for preservation until processing. Altitude, latitude and longitude data were obtained with an eTrex 32X GPS (Garmin). The relative humidity and temperature were obtained with a digital TTH00 thermohygrometer (Halthen).
DNA isolation
DNA from each Croton sample was extracted using a Monarch® genomic DNA purification kit (New England BioLabs) according to the manufacturer's instructions. The quality of the DNA was observed in a 1% agarose gel under ultraviolet light. Each sample was quantified in a UV Vis Spectrophotometer GenesysTM 10S (Thermo, Waltham, MA) at wavelengths of 260 and 280 nm and diluted to 10 ng uL-1 for PCR assays. The DNA was stored at -80°C for preservation and further analysis.
PCR amplification of ITS regions
Croton genomic DNA amplification was performed on a gradient thermal cycler LTCG-48-101 (Labocon, Leicester, UK) at a final reaction volume of 25 uL using the oligonucleotides ITS1 5'-TCCGTAGGGAACCTGCGGC-3' and ITS4 5'-TCCTCCGCTTATGC-3' (White et al., 1990). The reaction mixture was made using Taq polymerase from Biolobas® (Ipswichj, MA) following the manufacturer's instructions. The initial denaturation was at 95ºC for 5 min, followed by denaturation at 95ºC for 30 s, hybridization at a temperature of 52°C during 30 s, final extension of 72ºC for 2 min, and 35 cycles. The verification of the amplified products was done in 1% agarose gels that were subsequently dyed with Gelred® (Biotium, San Francisco, CA).
Sequencing and phylogenetic analysis
The PCR products were purified from agarose gels using a Monarch® DNA Gel Extraction Kit from Biolobas® (Ipswichj, MA) according to the manufacturer's instructions. Each purified and verified PCR product was sent to Macrogen, Korea, for sequencing. The sequences were compared to the GenBank database (Clark et al., 2016) using a BLAST analysis, aligned using MegAlign (LaserGene, DNASTAR, Madison, WI) and the ClustalW algorithm (Li et al., 2015). The phylogenetic analysis was performed using the Maximum-Likelihood method with 1,000 iterations to estimate the confidence of the grouping and the General Time Reversible model in MEGAX (Kumar et al., 2018). The nodes were collapsed using TreeGraph 2 (Stöver and Muller, 2010).
RESULTS AND DISCUSSION
Sampling regions
The three municipalities from Norte de Santander where Croton was sampled have different environmental conditions. The Chinacota samples were collected at an average altitude of 1,554 m a.s.l. and an average temperature of 21°C. The samples from Pamplona were collected at an average altitude of 2,276 m and an average temperature of 22.2°C. The samples from El Zulia were collected at an altitude of 157 m and an average temperature of 29.7°C. The collection information for some samples (Chinacota 5, Pamplona 9, El Zulia 7) and the codes assigned to each sample are shown in table 1.
Table 1. Geographical location of Croton samples collected in Norte de Santander.
| Sample Id | Location | T° | RH | Latitude | Longitude | Altitude (m a.s.l.) |
|---|---|---|---|---|---|---|
| Chinacota | ||||||
| M1CH | Chinácota Centro | 26 | 48% | 7.6216 N 7°37´17.47362´´ | -72.5964 W 72°35´48.01743´´ | 1,232 |
| M2CH | Cineral | 24 | 73% | 7.569867 (N7°34’11.52168”) | -72.584099 (W72°35’2.75574”).I4 | 1,568 |
| M3CH | Iscala Sur | 20 | 61% | 7.510164 N 7°30’36.59121” | -72.566934 W 72°34´0.96209” | 1,975 |
| M4CH | Iscala Norte | 17 | 47% | 7.558293 N 7°33’29.85527” | -72° 34’28.15951” | 1,678 |
| M5CH | Manzanares | 18 | 51% | 7.609255 N 7°36´33.31822´´ | -72.592361 W 72°35´32.49893´´ | 1,319 |
| Pamplona | ||||||
| M1PAM | Rio Negro | 27.8 | 61% | 7.485300 N7°29´7.07894 | -72.634210 W 72°38´3.15442´´ | 2,318 |
| M2PAM | Curva | 26 | 46% | 7.468161 N 7°28´5.37805´´ | -72.634497 W 72°38´4.18743´´ | 2,170 |
| M3PAM | Entrada de Pamplona | 27 | 44% | 7.433168 N 7°25´59.40585´´ | -72.629223 W 72°37´45.20129 | 2,295 |
| M4PAM | Parque Central | 18 | 37% | 7.376120 N 7°22´34.03044’’ | -72.648203 W 72°38´53.53178´´ | 2,298 |
| M5PAM | Barrio Cariongo | 24 | 42% | 7.358025 N 7°21´28.89022’’ | -72.659286 W 72°39´33.43027 | 2,383 |
| M6PAM | Rio | 22 | 40% | 7.364537 N 7°21´52.33292 | -72.664358 W 72°39´51.68978´´ | 2,121 |
| M7PAM | Tanques | 19 | 44% | 7.380099 N 7°22´48.35619´´ | -72.629460 W 72°37´46.05524´´ | 2,278 |
| M8PAM | Km 6 | 18 | 46% | 7.398185 N 7°23´53.46643´´ | -72.619401 W 72°37´9.84331´´ | 2,288 |
| M9PAM | Escuela Chichira | 18.5 | 45% | 7.388406 N 7°23´18.26284´´ | -72.626124 W 72°37´34.04495´´ | 2,338 |
| El Zulia | ||||||
| M1ZUL | Alejandra | 29 | 69% | 7.961406 N7°57´41.06286´´ | -72.606063 W 72°36´21.82788´´ | 204 |
| M2ZUL | Cachamay | 29 | 65% | 7.984361 N 7°59´3.69850´´ | -72.605519 W 72°36´19.86983´´ | 178 |
| M3ZUL | Rancho Grande | 29.5 | 67% | 8.149730 N 8°8´59.02825´´ | -72.586857 W 72°35´12.68401´´ | 126 |
| M4ZUL | Quesera | 30 | 66% | 8.157913 N 8°9´28.48718´´ | -72.609057 W 72°36´32.60444´´ | 158 |
| M5ZUL | Salida de la Y | 28.7 | 66% | 8.147484 N 8°8´50.94411’’ | -72.580326 W 72°34´49.17358´´ | 85 |
| M6 ZUL | Angelita | 30 | 70% | 8.160695 N 8°9´38.50375´´ | -72.639477 W 72°38´22.11660´´ | 147 |
| M7ZUL | Finca la Esperanza | 32 | 69% | 8.138900 N 8°8´20.03999´´ | -72.641307 W 72°38´28.70409´´ | 203 |
T°, temperature (°C); RH, relative humidity.
PCR amplification
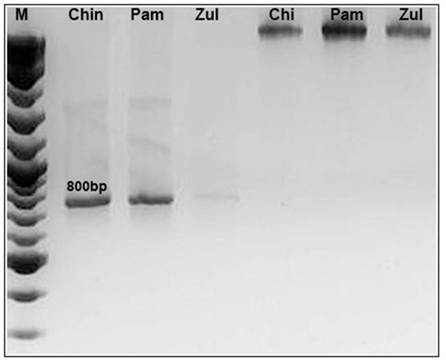
The PCR amplification with the oligonucleotides ITS1 and ITS4 (White et al., 1990) produced an expected band of approximately 800 bp, figure 2 shows the expected amplification product of Croton samples from three locations, suggesting the efficiency of the oligonucleotides selected to amplify ITS from plant samples, which may be used for future studies on other species.
Nuclear ribosomal DNA (nrDNA) sequences
Internal transcribed spacers (ITS) of nuclear ribosomal DNA (nrDNA) contain ITS1, 5.8s rDNA, and ITS2. In recent years, nrDNA ITS sequences have been used to evaluate and analyze phylogenetic relationships between individuals of a species with PCR amplifications and sequencing. They are 18s-26s regions of the nrDNA encompassing spacer sequences with informational sites that have been widely used to investigate intra-specific differences and interspecies association in plants (Forough et al., 2018; Yang et al., 2018). This approach was used to determine the sequences of Croton individuals in three locations in Norte de Santander and establish their phylogenetic relationships. The sequences were analyzed, cured and submitted to the GenBank database, where the corresponding accession numbers were assigned (Tab. 2).
Table 2. Accession numbers assigned to each of the new sequences generated with Croton from Norte de Santander.
| Sample Id | GenBank accession number | Sample Id | GenBank accession number | Sample Id | GenBank accession number |
|---|---|---|---|---|---|
| M1CH | MZ820403 | M3ZUL | MZ820411 | M6ZUL | MZ820419 |
| M1PAM | MZ820404 | M4CH | MZ820412 | M7CH | MZ820420 |
| M1ZUL | MZ820405 | M4PAM | MZ820413 | M7PAM | MZ820421 |
| M2CH | MZ820406 | M4ZUL | MZ820414 | M7ZUL | MZ820422 |
| M2PAM | MZ820407 | M5CH | MZ820415 | M8CH | MZ820423 |
| M2ZUL | MZ820408 | M5PAM | MZ820416 | M8PAM | MZ820424 |
| M3CH | MZ820409 | M5ZUL | MZ820417 | M9PAM | MZ820425 |
| M3PAM | MZ820410 | M6PAM | MZ820418 |
Phylogenetic analysis
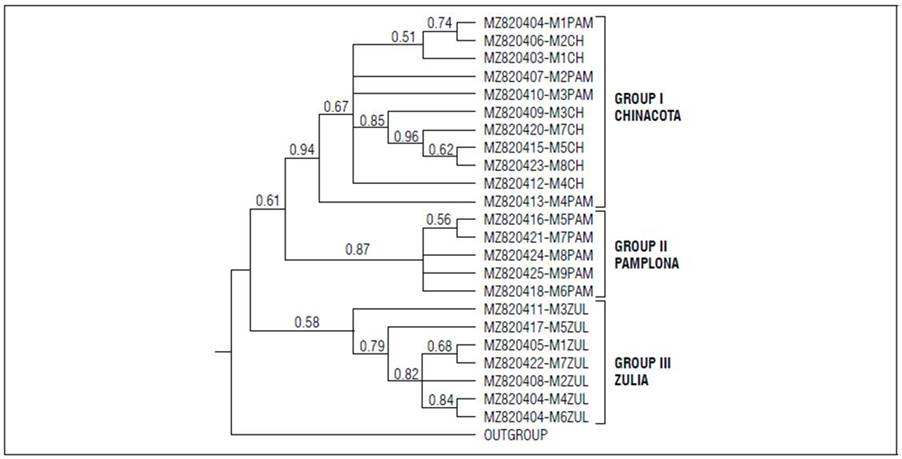
The new Croton ITS sequences from Norte de Santander (Tab. 2) were used to construct the phylogenetic tree and determine the evolutionary relationships between them (Fig. 3). The Z. caribeaum ITS sequence of was used as an outgroup.
As shown in figure 3, two groups are formed in the phylogenetic tree. The first contained the subgroups formed by the individuals from Chinacota and Pamplona, and the second group had the individuals from El Zulia, suggesting different origins in these populations and a greater relationship between Chinacota and Pamplona. The geographical temperature and altitude conditions of the collection areas in Chinacota and Pamplona were more similar to each other than with the conditions in El Zulia. At the anatomical level, differences in the cortex have been described, along with genetic variability in Croton individuals from different environments (Farias et al., 2009), as seen in this study.
In Croton, the ITS region has been used for taxonomic and phylogenetic studies, some of which include sequences originating in Colombia (Berry et al., 2005; Riina et al., 2009; Van Ee and Berry, 2010, 2011; Caruzo et al., 2011; Masa-Iranzo et al., 2021). The search criteria Croton+transcribed spacer+Colombia in the Genbank at the time of writing this manuscript yielded 10 results that are shown in table 3.
Table 3. Croton ITS sequences from Croton species from Colombia reported in the GenBank.
| Species | Location | Reference |
|---|---|---|
| Croton peltoideus Kunth | Colombia - Valle del Cauca | Van Ee and Berry (2011) |
| Croton malambo H.Karst. | Colombia-Bolivar | Berry et al. (2005) |
| Croton spruceanus Benth. | Colombia-N/A | Caruzo et al. (2011) |
| Croton ater Croizat | Colombia-N/A | Riina et al. (2009) |
| Croton purdiei Müll.Arg. | Colombia-N/A | Riina et al. (2009) |
| Croton magdalenensis Müll.Arg. | Colombia-N/A | Riina et al. (2009) |
| Croton pedicellatus Kunth | Colombia-Cundinamarca | Van Ee and Berry (2010) |
| Croton pachypodus G.L.Webster | Colombia-Nariño | Masa-Iranzo et al. (2021) |
| Croton rufolepidotus Caruzo & Riina | Colombia-Antioquia | Masa-Iranzo et al. (2021) |
| Croton amazonicus Müll.Arg. | Colombia-Caqueta | Masa-Iranzo et al. (2021) |
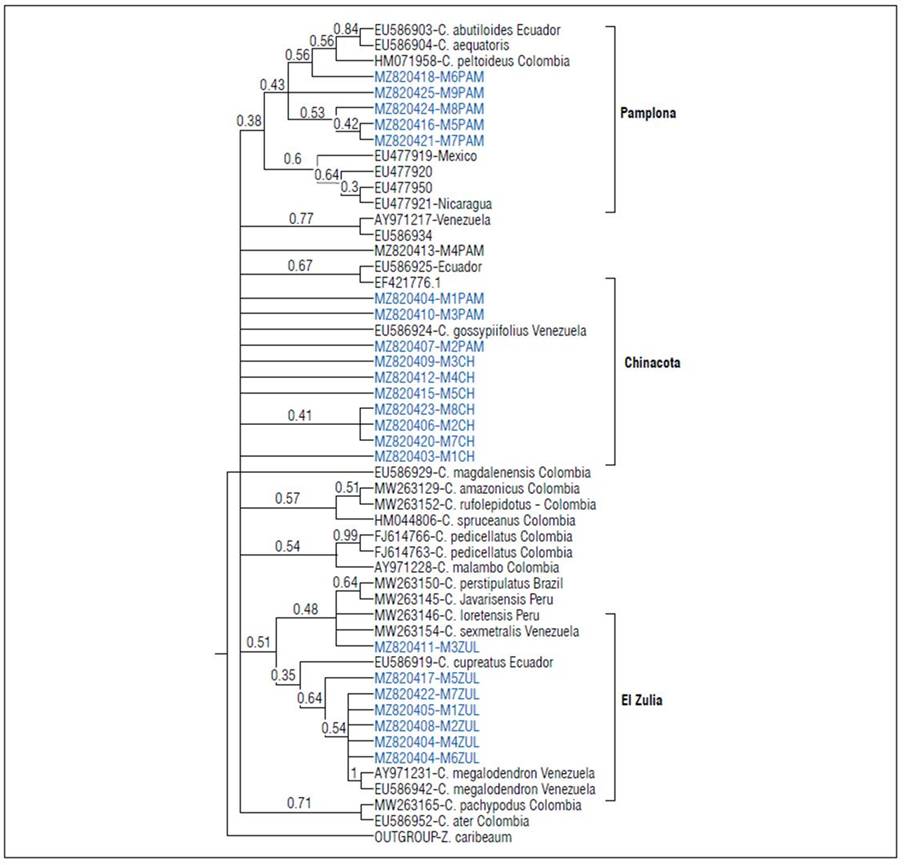
The phylogenetic relationship of the new ITS sequences in Croton from Norte de Santander with ITS reported in Colombia for the departments Nariño, Antioquia, Cundinamarca, Bolivar, Valle del Cauca and Caqueta, and 87 sequences originating in other countries in the Americas were established. However, because of the high similarity between many of them and the scarce phylogenetic relationship with sequences from countries outside the Americas (data not shown), the analysis was limited to using 22 sequences from another country whose origin and corresponding species are indicated in figure 4.

Figure 4. Phylogenetic relations of Croton from Norte de Santander with other sequences of Colombia and other countries in the Americas.
Samples from Norte de Santander consistently grouped according to place of origin in three clusters. The groups from El Zulia and Pamplona were exclusively formed by individuals from those localities. The group from Chinacota had three samples that were collected in Pamplona, suggesting the same origin or a possible transfer of seeds or plant material between these two localities (Fig. 4). The grouping of the sequences of the three populations of Norte de Santander suggested high genetic variability. This hypothesis was reinforced by the distance matrix with a nucleotide similarity from 54 to 99% (data not shown).
The absence of a detailed botanical analysis and the limited availability of sequences meant it could not be conclusively stated to which Croton species the Norte de Santander samples belong. However, according to the results of the phylogenetic grouping indicated in figure 4, the samples collected in the municipality of Pamplona were more related to Croton abutiloides Kunth (EU586903) and Croton aequatoris Croizat (EU583904) from Ecuador and C. peltoideus (HC071958) from the Department of Valle del Cauca-Colombia. On the other hand, the data showed that the samples from Chinacota did not clearly group with other samples, including the other ones from Colombia, suggesting a different evolutionary origin. Finally, the samples from El Zulia were in two subgroups. The first one had more individuals with a higher phylogenetic relationship with Croton megalodendron Müll.Arg. from Venezuela and Croton cupreatus Croizat from Ecuador. The other subgroup only contained the individual M3ZUL (MZ820411) with a higher phylogenetic relationship with Croton sexmetralis Croizat from Venezuela and with Croton loretensis Riina & Caruzo and Croton javarisensis Secco from Peru.
CONCLUSION
The phylogenetic analysis and the distance matrix with the internal transcribed spacer region (ITS) of the ribosomal DNA (rDNA) for Croton individuals from three localities in Norte de Santander revealed high genetic variability. The Chinacota samples had the greatest nucleotide dissimilarity and the lowest phylogenetic relationship with the other samples. Because of the large number of species belonging to the Croton genus, botanical studies and a greater number of sequences are needed to conclude to which species the samples from Norte de Santander belong or whether they can constitute a new species in this genus. The results of this study represent an important contribution for future systematic studies, for establishing plant breeding programs, and for identifying Croton germplasms and the relationships between them.


