


 English (pdf)
 Article in xml format
 Article references
 Send this article by e-mail
 Cited by SciELO
  Cited by Google
  Similars in
SciELO
Similars in
SciELO  Similars in Google
 Permalink
INTRODUCTION
Blueberries have become one of the most consumed fruits in the world, because they contain high amounts of phenolic compounds, including anthocyanins, flavonols, chlorogenic acid, and proanthocyanidins (Undurraga and Vargas, 2013), which inhibit oxygen free radicals (Granato et al., 2016) and make them beneficial for health (Herrera-Balandrano et al., 2021), therefore, production has increased in recent years and has become the second most important soft fruit species after strawberry (Giongo et al., 2013).
Its cultivation has occurred mainly in the northern hemisphere, specifically North America, Central Europe and Eurasia, also being found in South America and some species in Africa (Jaime-Guerrero et al., 2022). Cultivation has spread in recent years in countries such as China, Japan, Chile, New Zealand, Argentina and Mexico, which has increased the planted area worldwide by 15,000 ha in just 4 years (Intagri, 2017). In addition to this, in recent years these plants have been introduced into Colombia with great success due to the environmental conditions that facilitate their production, especially in the highlands of the country, from 2,200 to 2,800 m a.s.l. (Jaime-Guerrero et al., 2022; Fischer et al., 2022), in such a way that the planted area has gone from 120 to 400 ha, which has increased the export potential of this fruit (Lorduy, 2019).
Blueberries are highly perishable and susceptible to rapid deterioration due to loss of firmness, microbial breakdown, tissue oxidation, mechanical damage, and moisture loss (Paniagua et al., 2013). According to Jaime-Guerrero et al. (2022), the quality of postharvest blueberry fruits is preserved between 10 and 15 d, after which time their commercial value is significantly reduced (Chen et al., 2015), that generates losses that reach 30% during conservation and storage, therefore, it is difficult to maintain considerable volumes of commercialization to guarantee export markets.
In recent years, in order to maintain quality for longer and reduce oxidation of fruit tissues, ethylene antagonists that are more effective than 1-methylcyclopropene and that are edible have been used, among which appears the application of cyclodextrins (CyDs), that have generated significant ripening delays during cherry storage (Jinwei et al., 2019).
In this regard, cyclodextrins are cyclic oligosaccharides with solubilizing functions, which have shown great potential to retard the natural browning of fruits, since they form complexes with polyphenol oxidase (PPO) substrates that could cause their inhibition (Jian and Penner, 2019). Likewise, the CyDs have multiple properties within which the reduction of tissue oxidation stands out, they retard the decomposition of color induced by light, and heat, they also work as solution stabilizers, in the same way, they sequester components selectively reducing and attenuating bad odors and flavors in such a way that the CyDs have a promising future in postharvest storage due to consumer demand for healthy, functional and less perishable fruits (Pereira et al., 2021).
Therefore, this work aimed to determine the effect of different doses of cyclodextrin on the postharvest quality of blueberry cv. Biloxi export type, to provide producers with the necessary tools to minimize losses during the storage of the fruit and increase the profitability of the crop.
MATERIALS AND METHODS
Localization
The research was carried out in the Plant Physiology laboratory of the Universidad Pedagógica y Tecnológica de Colombia (Boyaca, Colombia), Tunja campus. The fruits used were harvested from a commercial crop located on the La Nutria farm in the ‘El Carmen’ village of the municipality of Combita located at an altitude of 2,697 m, 5°41'54'' N and 73°16'11'' W, with an average annual temperature of 16°C and relative humidity that oscillates between 70 and 80%.
Plant material
Freshly harvested Biloxi variety blueberry fruits free of mechanical damage were used, which were of good commercial quality characterized by a uniform size, good color, firmness and flavor. Fruits were stored in 10 kg baskets and kept at room temperature until they arrived at the laboratory (1 h), where they were washed and disinfected with 1% sodium hypochlorite.
Experiment design
A completely randomized design (DCA) was used with six treatments and four repetitions, for a total of 24 experimental units (EU). The treatments corresponded to the CyDs doses (0, 200, 400, 600, 800 and 1,000 µg L-1), for which β-cyclodextrin (Zibo Qianhui Biological Technology Co., China) was used, with a purity of 98%. The fruits were submerged in the CyDs solutions for 10 min and storage in environmental conditions. These doses were chosen taking into account the maximum non-toxic tolerated levels reported by Hedges (2009).
Response variables
The variables were evaluated daily until fruits loss commercial quality: mass loss (ML), using a 0.001 g precision electronic balance (VIBRA AJ220E serie, Shinko Denshi Co., Japan), taking 140 g of fruits as initial state. Fruit firmness, using a GY-4 penetrometer (Yueqing Handpi Instruments Co., China) with a 3.5 mm diameter tip, a 10 mm depth pressure and a precision of 0.01 N, six fruits of uniform size were taken per each EU. Total soluble solids (TSS), using a Hanna HI-96803 refractometer with a scale of 0 to 85% (Hanna Instruments, Woonsocket, RI) through the measurement of Brix degrees in the juice extracted from 12 blueberries. Total titratable acidity (TTA) was quantified with the methodology used by Jaime-Guerrero et al., 2022 by means of calculations with data of the volume of sodium hydroxide (NaOH) incorporated in 5 mL of cranberry fruit juice brought to 50 mL with distilled water to which three drops of phenolphthalein were added as an indicator of color change.
The pH was measured in 50 mL of juice with a Hanna HI-8424 portable digital potentiometer (Hanna Instruments, Woonsocket, RI). The color was measured with a CHN Spec CS-200 Minolta digital colorimeter (Hangzhou CHNSpec Technology Co., China) in 8 fruits per EU. a*: chromaticity from green to red, b*: chromaticity from blue to yellow, and L*: luminosity sere determined. The hue angle and chroma were calculated according to the equations (1) and (2).
Respiratory rate (RR) was measured using 2L SEE BC-2000 hermetic breathing chambers (Vernier Software & Technology, OR, USA) connected to a VER CO2-BTA infrared sensor (Vernier Software & Technology, OR, USA) and a Labquest2 interface (Vernier Software & Technology, OR, USA) for 10 min, expressed in mg kg-1 h-1 of CO2following the method of Jaime-Guerrero et al. (2022). Total anthocyanins (AnT), by means of a sample of 0.25 g of blueberry fruit, homogenized in 1 mL of 0.1% citric acid solution and 10 mL of 80% ethanol, 4 mL of sample was taken, which was then passed to a centrifuge universal Unico C858 Model PowerSpin LX (Unico Scientific, Hong Kong) at 4,000 rpm for 20 min, absorbances were measured at 532 nm by a HumanCorp UV/Visible X-ma 1200V spectrophotometer (Human Corporation, Seoul, Korea). AnT content was calculated and reported as cyanidin-3 glucoside (Cy-3-Glucoside) equivalents using equation (3).
Where, abs: absorbance measured in the spectrophotometer, MM: molecular mass of cyanidin-3-glucoside (449.2 g mol-1), DF: dilution factor (10), e: molar extraction coefficient for cyanidin-3-glucoside (26900), 1000: conversion factor from g to mg.
Analysis of the data
The data obtained were subjected to normality tests to eliminate erroneous and atypical data. Once the assumptions of normality were verified, a cross-sectional and longitudinal analysis of variance (ANOVA) was performed to establish the significant differences between treatments and measurement periods, respectively. The measured variables were subjected to Tukey's mean comparison tests (P≤0.05); statistical analyzes were performed using the SAS v.9.2e program (SAS Institute Inc., Cary, NC).
RESULTS AND DISCUSSION
Accumulated mass loss (ML)
The accumulated ML in the fruits that received the application of CyDs presented a continuous increase depending on the storage time with a value of 16.42% at 15 days after harvest (dah), although without significant statistical differences between treatments (Fig. 1). However, the treatments with 400, 600 and 800 µg L-1, presented lower averages compared to the others and maintained the quality 2 d longer than the control.
In this regard, Paniagua et al. (2014) found that ML values observed at the end of the experiment (1 to 15%) are not different from the magnitudes commonly observed by the blueberry export industry, and highlight those low temperatures keep the mass fresh and delay wilting of the fruit for 16 d. According to the results, Jinwei et al. (2019) mention that, in cherries, the application of CyDs maintained quality for a longer time, and that alpha and beta CyDs have similar effects.
Firmness
There were no significant differences in any of the measurements carried out over time (P≤0.05) despite varying the doses of CyDs, however, the treatment that had the best average was 400 µg L-1 (6.26 N) compared to the treatment of 1,000 µg L-1 (5.94 N), it was even lower than the control that had an average of 6.11 N. This could be due to a greater loss of humidity and a greater wrinkling during storage; however, the treatment 400 µg L-1 maintained that greater firmness, which indicates less acid degradation and slower mass loss.
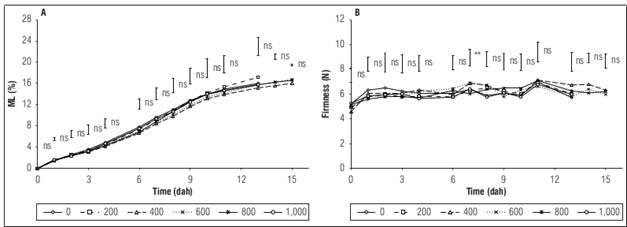
Figure 1. Effect of CyDs on A) mass loss and B) firmness during postharvest of blueberry fruits. dah: days after harvest, ns: no significant, * and ** indicate a significant effect according to the ANOVA (P≤0.05 and P≤0.01, respectively). The vertical bars indicate the minimal significant difference between Tukey's treatments (P≤0.05).
The firmness of the fruits increased but there were no statistically significant differences between treatments, which is accordance with results obtained by Chiabrando and Giacalone (2011), who found that during storage, the firmness values showed an increase after 15 d. Likewise, Saito et al. (2020) obtained a numerical increase in firmness after the first week of storage for treatments with gaseous application of 1-MCP of 15 and 30 mL min-1, although these differences were not statistically significant with respect to the initial firmness.
pH
pH presented highly significant statistical differences between treatments at 6 and 7 dah, where values obtained in the fruits with application of 600, 800 and 1,000 µg L-1 are lower than the control and the treatments with 200 and 400 µg L-1. On the other hand, between 9 and 11 dah, significant differences were found, similarly obtaining the lowest pH values in the 600, 800 and 1,000 µg L-1 treatments, indicating that they were maintained in a better way the organic acids present in the fruits, while in the rest of the days there were no differences, which contrasts with reported by Jinwei et al. (2019) in cherries, where with applying different types of CyD they did not find variations in the pH. A decrease in the pH value was evidenced, with values of 2.78 as maximums and minimums of 2.42. This decrease shows that the application of CyDs does not greatly affect the pH of the fruits compared to the control. In this sense, Abugoch et al. (2015) found in blueberries that the pH values for the control fruits increased slightly from 3.5 to 3.9 during storage and affirm that the application of emulsions and coatings can generate good protection, maintaining pH values between 3.4 and 3.6 until 32 d.
Total soluble solids (TSS)
There were significant differences between treatments at 2, 6, 7, 10 and 11 dah for the TSS. When analyzing the behavior over time, a slight increase in TSS is recorded, although not significant, during postharvest storage. However, the application of 400 µg L-1 of CyDs obtained an average of 11.68 °Brix, and the treatment of 1,000 µg L-1 of CyDs showed an average value of 12.42 °Brix, this indicates that they are maintained for much longer the characteristics of the fruits in the treatment of 400 µg L-1 of CyDs than in the other treatments even though variation is not very significant.
In this regard, Chiabrando and Giacalone (2011) found that the TSS content of blueberry fruits did not show strong changes during storage or between treatments and that the values increased slightly during the 14 d of the storage period and then decreased progressively, which agrees with the present study, since an increase in the value of TSS could be related to the loss of water during storage or the solubilization of polysaccharides in the cell wall of ripe fruits (Jaime-Guerrero et al., 2022). Likewise, Jinwei et al. (2019) mention that the application of different combinations of CyDs with 1-MCP did not affect the concentration of TSS in cherries.
Total titratable acidity (TTA)
During the total time of the study there were no differences between treatments, but at 8 dah highly significant statistical differences were found, with the 200 and 800 µg L-1 treatments obtaining the highest values, 0.77 and 0.74, respectively, while that the control had a value of 0.64. In general, the TTA averages for the treatments were higher than 0.70, while the control showed an average of 0.67 during the entire postharvest period, indicating that the CyDs maintained the organic acids present in the fruits, which is important because these influence the flavor of the fruit, and their concentration can affect the perceived sweetness and nutritional quality.
In contrast, Jinwei et al. (2019) found that the application of CyDs in cherries delayed the loss of TTA and increased the activity of super oxide dismutases. On the other hand, Abugoch et al. (2015) found significant differences between uncoated and coated blueberries, with the coated blueberries having the highest TTA averages, indicating that the fruits with coated applications were more stable during storage.
Maturity index (MI)
The flavor of blueberries depends on the balance between TSS and TTA. Among the CyDs treatments in blueberry (Tab. 1), there were significant differences at days seven and eleven dah compared to the other days where there were no differences, except for day six of the study, which had highly significant differences. The fruits with CyDs application showed lower MI values (16.47) than those of the control treatment (18.30). This indicates that the application of CyDs helps to maintain the quality of the fruits for a longer time and favors better conservation during postharvest. Similarly, Jinwei et al. (2019) also found the application of CyDs increased the MI of cherry fruits and mention that the CyDs affect the MI, because they have a greater influence on the TTA than on the TSS.
Table 1. Physicochemical parameters evaluated in blueberry fruits, subjected to different doses of cyclodextrins during the postharvest period.
| Parameter | dah | Cyclodextrin doses (µg L-1) | |||||
|---|---|---|---|---|---|---|---|
| 0 | 200 | 400 | 600 | 800 | 1,000 | ||
| pH | 0 | 2.79±0.03 a | 2.75±0.01 a | 2.76±0.05 a | 2.71±0.02 a | 2.67±0.02 a | 2.74±0.04 a |
| 1 | 2.79±0.02 a | 2.80±0.03 a | 2.75±0.04 a | 2.78±0.03 a | 2.76±0.03 a | 2.76±0.07 a | |
| 2 | 2.6±0.040 a | 2.54±0.13 a | 2.66±0.06 a | 2.67±0.02 a | 2.64±0.02 a | 2.47±0.09 a | |
| 3 | 2.37±0.02 a | 2.47±0.09 a | 2.36±0.05 a | 2.42±0.06 a | 2.42±0.04 a | 2.47±0.02 a | |
| 4 | 2.73±0.03 a | 2.71±0.07 a | 2.73±0.05 a | 2.71±0.04 a | 2.69±0.00 a | 2.72±0.01 a | |
| 6 | 2.64±0.03 a | 2.63±0.04 ab | 2.51±0.02 ab | 2.47±0.02 b | 2.45±0.02 b | 2.47±0.04 b | |
| 7 | 2.69±0.00 a | 2.55±0.03 ab | 2.50±0.05 b | 2.49±0.02 b | 2.53±0.02 b | 2.54±0.04 b | |
| 8 | 2.52±0.04 a | 2.39±0.05 a | 2.44±0.04 a | 2.35±0.05 a | 2.37±0.08 a | 2.46±0.02 a | |
| 9 | 2.71±0.07 a | 2.58±0.04 ab | 2.53±0.07 ab | 2.46±0.03 b | 2.42±0.01 b | 2.51±0.04 ab | |
| 10 | 2.64±0.04 a | 2.51±0.07 ab | 2.46±0.02 ab | 2.36±0.01 b | 2.36±0.06 b | 2.53±0.07 ba | |
| 11 | 2.75±0.03 a | 2.50±0.02 b | 2.46±0.08 b | 2.49±0.04 b | 2.61±0.07 b | 2.64±0.08 b | |
| 13 | 2.57±0.02 a | 2.46±0.02 ab | 2.40±0.06 b | 2.48±0 ab | 2.42±0.05 b | 2.43±0.03 ab | |
| 14 | ---- | ---- | 2.58±0.06 a | 2.57±0.04 a | 2.49±0.02 a | ---- | |
| 15 | ---- | ---- | 2.52±0.05 a | 2.51±0.01 a | 2.54±0.02 a | ---- | |
| TSS | 0 | 13.17±0.31 a | 12.75±0.30 a | 12.22±0.14 a | 12.77±0.19 a | 12.72±0.19 a | 13.12±0.42 a |
| 1 | 12.37±0.28 ab | 11.3±0.43 b | 12.70±0.38 ab | 12.2±0.29 ab | 12.05±0.49 ab | 13.42±0.37 a | |
| 2 | 12.02±0.39 a | 11.55±0.40 a | 12.00±0.20 a | 11.42±0.61 a | 11.35±0.23 a | 12.10±0.34 a | |
| 3 | 10.90±0.09 a | 11.65±0.32 a | 11.00±0.33 a | 11.60±0.12 a | 11.05±0.04 a | 11.42±0.23 a | |
| 4 | 12.07±0.33 a | 11.57±0.42 a | 11.57±0.28 a | 11.85±0.34 a | 12.15±0.66 a | 12.40±0.31 a | |
| 6 | 13.20±0.60 a | 11.72±0.61 a | 11.22±0.57 a | 11.10±0.52 a | 12.80±0.35 a | 13.42±0.49 a | |
| 7 | 10.27±0.42 a | 11.72±0.49 a | 9.85±0.35 a | 10.00±0.19 a | 10.25±0.27 a | 10.42±0.47 a | |
| 8 | 11.70±0.43 a | 12.72±0.38 a | 11.37±0.96 a | 10.6±0.31 a | 11.35±0.22 a | 11.72±0.25 a | |
| 9 | 12.17±0.06 ab | 11.95±0.26 ab | 11.00±0.53 b | 11.97±0.75 ab | 11.00±0.26 b | 12.70±0.07 a | |
| 10 | 13.35±0.42 a | 11.12±0.22 b | 11.07±0.31 b | 11.32±0.34 b | 11.45±0.35 b | 13.37±0.31 a | |
| 11 | 11.80±0.38 ab | 11.17±0.35 ab | 10.52±0.26 b | 11.47±0.31 ab | 10.40±0.31 b | 12.17±0.40 a | |
| 13 | 13.10±0.48 a | 13.27±0.97 a | 11.62±0.23 a | 12.87±0.65 a | 13.42±0.2 a | 12.70±0.60 a | |
| 14 | ---- | ---- | 13.50±0.9 a | 13.82±0.3 a | 13.07±0.86 a | ---- | |
| 15 | ---- | ---- | 13.82±0.55 a | 13.72±0.41 a | 14.37±0.37 a | ---- | |
| TTA | 0 | 0.81±0.03 a | 0.76±0.03 a | 0.72±0.03 a | 0.81±0.07 a | 0.86±0.03 a | 0.80±0.02 a |
| 1 | 0.77±0.01 a | 0.68±0.02 a | 0.76±0.06 a | 0.70±0.04 a | 0.78±0.04 a | 0.74±0.06 a | |
| 2 | 0.67±0.07 a | 0.68±0.05 a | 0.65±0.06 a | 0.68±0.05 a | 0.81±0.03 a | 0.73±0.02 a | |
| 3 | 0.64±0.04 a | 0.73±0.07 a | 0.77±0.02 a | 0.66±0.03 a | 0.79±0.06 a | 0.60±0.04 a | |
| 4 | 0.67±0.04 a | 0.79±0.05 a | 0.72±0.07 a | 0.72±0.05 a | 0.65±0.03 a | 0.67±0.04 a | |
| 6 | 0.65±0.01 b | 0.65±0.03 b | 0.68±0.03 b | 0.79±0.02 a | 0.74±0.04 ab | 0.71±0.04 ab | |
| 7 | 0.58±0.02 a | 0.64±0.01 a | 0.67±0.05 a | 0.65±0.03 a | 0.68±0.02 a | 0.72±0.03 a | |
| 8 | 0.63±0.03 b | 0.77±0.01 a | 0.70±0.04 ab | 0.60±0.03 b | 0.74±0.03 ab | 0.57±0.02 b | |
| 9 | 0.63±0.08 a | 0.67±0.03 a | 0.64±0.03 a | 0.71±0.06 a | 0.73±0.02 a | 0.65±0.00 a | |
| 10 | 0.64±0.05 a | 0.78±0.07 a | 0.82±0.01 a | 0.88±0.01 a | 0.83±0.13 a | 0.88±0.12 a | |
| 11 | 0.66±0.05 a | 0.87±0.04 a | 0.78±0.03 a | 0.81±0.02 a | 0.73±0.02 a | 0.77±0.06 a | |
| 13 | 0.64±0.02 a | 0.72±0.03 a | 0.69±0.03 a | 0.63±0.02 a | 0.73±0.03 a | 0.68±0.04 a | |
| 14 | ---- | ---- | 0.66±0.05 a | 0.65±0.03 a | 0.73±0.01 a | ---- | |
| 15 | ---- | ---- | 0.70±0.01 a | 0.70±0.01 a | 0.70±0.01 a | ---- | |
| MI | 0 | 16.32±1.00 a | 16.66±0.75 a | 17.17±0.74 a | 16.03±1.41 a | 14.84±0.66 a | 16.42±0.76 a |
| 1 | 15.94±0.76 a | 16.56±0.42 a | 17.11±1.85 a | 17.57±1.42 a | 15.40±1.09 a | 18.60±1.98 a | |
| 2 | 18.19±1.20 a | 17.37±1.82 a | 18.78±1.78 a | 17.28±2.54 a | 14.00±0.85 a | 16.50±0.70 a | |
| 3 | 17.01±1.13 a | 16.33±1.99 a | 14.22±0.59 a | 17.54±0.82 a | 14.17±1.15 a | 19.28±1.56 a | |
| 4 | 18.16±1.52 a | 14.34±1.67 a | 16.55±1.65 a | 16.81±1.58 a | 18.83±1.70 a | 18.70±1.61 a | |
| 6 | 20.07±1.17 a | 17.84±0.66 abc | 16.44±0.24 bc | 13.95±0.90 c | 17.40±0.96 abc | 19.08±1.26 ab | |
| 7 | 17.51±0.93 a | 18.09±1.06 a | 14.86±0.89 a | 15.26±0.73 a | 15.14±0.76 a | 14.46±0.78 a | |
| 8 | 18.41±0.97 ab | 16.48±0.61 b | 16.53±1.92 ab | 17.80±1.38 ab | 15.34±0.81 ab | 20.47±0.65 a | |
| 9 | 20.08±2.53 a | 17.73±0.94 a | 17.20±1.25 a | 16.84±0.60 a | 14.96±0.80 a | 19.29±0.29 a | |
| 10 | 19.32±1.29 a | 14.69±1.88 a | 13.38±0.44 a | 12.82±0.47 a | 15.13±3.09 a | 16.22±2.75 a | |
| 11 | 18.29±1.92 a | 12.97±0.99 b | 13.47±0.41 b | 14.09±0.59 ab | 14.21±0.79 ab | 16.2±1.65 ab | |
| 13 | 20.26±0.49 ab | 18.51±1.61 a | 16.77±0.45 b | 20.36±0.38 ab | 18.51±1.23 ab | 18.64±1.25 ab | |
| 14 | ---- | ---- | 20.74±2.22 a | 21.33±0.97 a | 17.69±1.24 a | ---- | |
| 15 | ---- | ---- | 19.50±0.78 a | 19.48±0.32 a | 20.3±0.44 a | ---- | |
dah: days after harvest. TSS: total soluble solids, TTA: total titratable acidity. MI: maturity index. Values followed by a different letter in the same row indicate significant statistical differences between treatments according to Tukey (P<0.05). (---) Loss of consumption quality. Means of four replicates ± standard error.
Respiratory rate (RR)
RR of the blueberry fruits subjected to different doses of CyDs showed significant differences at 10 and 13 dah, and highly significant differences for the first day, so there was a strong initial effect of the variability in the classification of the fruits at the beginning of storage. When analyzing the behavior over time of the RR, it had a decreasing trend, although not significant in all treatments (Fig. 2A). The fruits with application of 400 µg L-1 (24.27) of CyDs showed the lowest RR values with respect to the control (26.24).
In similar studies, its mentioned that the higher RR, the faster biochemical changes involved in ripening occur, including the decrease in TSS and the loss of quality, which is related to the decrease in acidity, since organic acids are used as a substrate in respiration processes according to Saltveit (2019). On the other hand, Concha-Meyer et al. (2015) indicate that an atmosphere low in O2 and rich in CO2 can potentially reduce not only the RR but also the sensitivity and production of ethylene, oxidation and decomposition of the fruits, likewise, it is likely that when storing the fruits without refrigeration, similar results have been obtained between treatments, so the different doses of CyDs did not generate major changes in respiration, nor did they prolong the postharvest life of the fruits for longer.
Total anthocyanins (AnT)
The CyDs treatments had significant differences only in the first and thirteenth measurements for the AnT. The lowest values were obtained in the treatments with application of 200, 600 and 800 µg L-1 (81.16, 87.44 and 86.08 mg/100 g, respectively), compared to the control whose value was 99.48 mg/100 g. The average of the study in general was much higher in the control treatment (82.53 mg/100 g) in comparison with the values presented by the fruits that received the CyDs. When finding higher values of AnT in the control fruits, these contents could be related to the greater loss of water suffered by these, and therefore an increase in the concentration of anthocyanins a little more notorious than with the application of CyDs, due to the dilution effect.
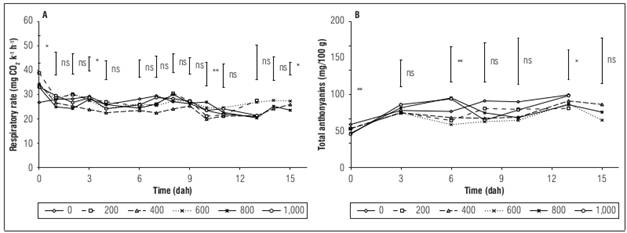
Figure 2. Effect of CyDs on A) respiratory rate and B) total anthocyanins during postharvest of blueberry fruits. dah: days after harvest. ns: no significant, * and ** indicate a significant effect according to the ANOVA (P≤0.05 and P≤0.01, respectively). The vertical bars indicate the minimal significant difference between Tukey's treatments (P≤0.05).
In this regard, Gibson et al. (2013) found that as blueberries mature (from green to blue), quantified total phenolic acids and flavonols decreased significantly while AnT increased significantly, which is consistent with Chiabrando and Giacalone (2017), who observed an increase in the AnT and mention that this is due to a higher concentration in the fruits that have suffered water losses during storage. Furthermore, Xu and Liu (2017) determined that the AnT content in blueberries increased at a high rate throughout the storage period, probably due to the decomposition of procyanidins at the beginning of storage. This agrees with this study where, when higher values were found in the control samples, said contents could be related to the loss of water and therefore an increase in the concentration of anthocyanins a little more notorious than the treatments with the application of CyDs.
Luminosity (L*)
In all treatments, L* did not have significant differences, in addition, the tendency was to decrease and can be seen in the opaqueness of the fruits at the end of storage, consistent with their natural maturation (Tab. 2). On average, the treatment with the highest value was 600 µg L-1 of CyDs with an L* value of 34.01 and the lowest values were in the control with 32.59. The tendency of blueberry fruits is to lose luminosity during postharvest.
In this regard, Chiabrando and Giacalone (2017) found that the changes in the color of the berry skin in terms of lightness during storage showed a general decreasing trend, more evident in all the coated samples compared to the control, however, López-Nicolás et al. (2007), found that the application of CyDs decreased the loss of L* in the juice of peach fruits, and prevented darkening and preserved quality for longer.
Chromaticity from green to red (a*)
a* value of blueberry fruits showed significant differences at 2 and 6 dah (Tab. 2). The means did not have significant differences between treatments either, with the control being the most positive value with -6.16 and the most negative was the 1,000 µg L-1 treatment with -6.65. In general, a* value during postharvest tended to increase, which implies a slight loss of green intensity during storage. This contrasts with López-Nicolás et al. (2007), who mention that with the increase in the applied concentration of CyDs, the a* values decreased in the juice of peach fruits, so that the green color is maintained for a longer time, however, it is important to clarify that blueberry coloring has a different nature.
Table 2 Color parameters evaluated in blueberry fruits, subjected to different cyclodextrins doses during the postharvest period.
| Variable | dah | Cyclodextrin doses (µg L-1) | |||||
|---|---|---|---|---|---|---|---|
| 0 | 200 | 400 | 600 | 800 | 1,000 | ||
| L* | 0 | 34.56±0.73 a | 33.86±0.52 a | 33.27±0.38 a | 32.91±0.06 a | 34.82±0.92 a | 35.13±0.55 a |
| 1 | 34.22±0.72 a | 34.80±0.73 a | 34.29±0.55 a | 36.26±0.40 a | 34.51±0.94 a | 35.83±0.46 a | |
| 2 | 33.34±0.81 a | 33.83±0.70 a | 32.87±0.34 a | 35.35±0.34 a | 34.55±0.65 a | 34.47±1.00 a | |
| 3 | 32.59±0.97 a | 32.99±1.17 a | 32.72±0.50 a | 34.94±0.69 a | 32.96±0.46 a | 33.64±0.75 a | |
| 4 | 32.51±0.56 a | 33.72±0.75 a | 33.02±0.59 a | 35.10±0.38 a | 33.91±0.84 a | 33.47±0.61 a | |
| 6 | 32.80±0.90 a | 33.63±0.76 a | 33.17±0.52 a | 35.53±0.44 a | 33.41±0.97 a | 34.30±0.72 a | |
| 7 | 32.27±0.73 a | 33.22±0.64 a | 32.70±0.61 a | 34.21±0.61 a | 32.81±0.48 a | 32.98±0.36 a | |
| 8 | 31.35±1.12 b | 32.32±0.53 ab | 32.28±0.53 ab | 34.61±0.18 a | 33.00±0.90 ab | 32.81±0.13 ab | |
| 9 | 31.80±0.42 a | 32.13±0.65 a | 33.40±0.42 a | 33.64±0.49 a | 32.83±0.73 a | 33.64±0.32 a | |
| 10 | 32.11±0.74 a | 32.15±0.57 a | 31.87±0.64 a | 33.39±0.64 a | 32.48±0.26 a | 33.30±0.32 a | |
| 11 | 31.94±0.82 a | 31.44±0.49 a | 31.54±0.53 a | 33.44±0.33 a | 32.58±0.70 a | 32.83±0.64 a | |
| 13 | 31.59±0.57 a | 31.16±0.62 a | 31.77±0.40 a | 32.27±0.21 a | 32.34±0.52 a | 31.86±0.56 a | |
| 14 | ---- | ---- | 30.84±0.61 a | 31.65±0.91 a | 31.04±0.61 a | ---- | |
| 15 | ---- | ---- | 31.08±0.69 a | 32.84±0.54 a | 31.68±0.93 a | ---- | |
| a* | 0 | -6.61±0.12 ab | -6.44±0.17 ab | -6.23±0.15 a | -6.03±0.16 a | -6.62±0.12 ab | -6.90±0.11 b |
| 1 | -6.73±0.22 a | -6.99±0.17 a | -6.85±0.14 a | -7.12±0.07 a | -6.75±0.32 a | -6.99±0.14 a | |
| 2 | -6.52±0.23 a | -6.52±0.12 a | -6.53±0.08 a | -7.08±0.06 a | -6.89±0.12 a | -6.85±0.23 a | |
| 3 | -6.36±0.23 a | -6.65±0.29 a | -6.66±0.17 a | -7.13±0.15 a | -6.57±0.11 a | -6.63±0.17 a | |
| 4 | -6.18±0.28 a | -6.77±0.20 ab | -6.64±0.23 ab | -7.20±0.10 b | -6.98±0.2 ab | -6.85±0.15 ab | |
| 6 | -6.22±0.20 a | -6.92±0.19 ab | -6.59±0.21 ab | -7.24±0.22 b | -6.76±0.24 ab | -7.04±0.22 ab | |
| 7 | -6.07±0.18 a | -6.62±0.14 a | -6.35±0.27 a | -6.79±0.18 a | -6.61±0.14 a | -6.65±0.21 a | |
| 8 | -5.67±0.43 a | -6.32±0.14 a | -5.98±0.35 a | -6.59±0.24 a | -6.60±0.24 a | -6.33±0.23 a | |
| 9 | -6.04±0.21 a | -6.32±0.14 a | -6.19±0.30 a | -6.40±0.20 a | -6.51±0.20 a | -6.59±0.27 a | |
| 10 | -5.87±0.23 a | -6.17±0.20 a | -5.94±0.23 a | -6.13±0.14 a | -6.35±0.18 a | -6.48±0.34 a | |
| 11 | -5.81±0.23 a | -6.05±0.12 a | -5.92±0.24 a | -6.11±0.24 a | -6.20±0.27 a | -6.28±0.48 a | |
| 13 | -5.73±0.11 a | -5.85±0.16 a | -5.97±0.15 a | -5.73±0.25 a | -5.93±0.23 a | -6.15±0.19 a | |
| 14 | ---- | ---- | -5.64±0.25 a | -5.88±0.13 a | -5.75±0.16 a | ---- | |
| 15 | ---- | ---- | -5.76±0.20 a | -6±0.05 a | -5.75±0.28 a | ---- | |
| b* | 0 | -1.88±0.14 a | -1.64±0.21 a | -1.72±0.17 a | -1.29±0.29 a | -1.95±0.32 a | -2.00±0.24 a |
| 1 | -2.03±0.16 a | -2.22±0.18 a | -2.16±0.24 a | -2.41±0.15 a | -2.14±0.34a | -2.28±0.16 a | |
| 2 | -1.48±0.25 a | -1.89±0.21 a | -1.51±0.14 a | -2.25±0.20 a | -2.02±0.19 a | -1.98±0.30 a | |
| 3 | -1.65±0.29 a | -2.03±0.34 a | -1.79±0.16 a | -2.36±0.16 a | -1.91±0.24 a | -2.08±0.21 a | |
| 4 | -1.35±0.28 a | -1.84±0.22 ab | -1.66±0.24 ab | -2.45±0.11 b | -2.03±0.3 ab | -1.88±0.18 ab | |
| 6 | -1.53±0.25 a | -1.94±0.19 a | -1.77±0.25 a | -2.36±0.11 a | -1.8±0.34 a | -2.06±0.23 a | |
| 7 | -1.61±0.28 a | -2.03±0.16 a | -1.75±0.21 a | -2.22±0.21 a | -1.95±0.17 a | -1.94±0.19 a | |
| 8 | -1.19±0.30 a | -1.44±0.13 a | -1.44±0.22 a | -2.06±0.11 a | -1.68±0.40 a | -1.64±0.06 a | |
| 9 | -1.18±0.05 a | -1.40±0.23 a | -1.56±0.09 a | -1.77±0.16 a | -1.63±0.25 a | -1.67±0.16 a | |
| 10 | -1.49±0.19 a | -1.76±0.14 a | -1.59±0.16 a | -2.10±0.210 a | -1.77±0.19 a | -1.99±0.19 a | |
| 11 | -1.32±0.21 a | -1.45±0.20 a | -1.47±0.09 a | -2.04±0.16 a | -1.75±0.28 a | -1.91±0.21 a | |
| 13 | -1.31±0.37 a | -1.57±0.29 a | -1.48±0.17 a | -1.88±0.14 a | -1.96±0.14 a | -1.85±0.21 a | |
| 14 | ---- | ---- | -1.52±0.11 a | -1.62±0.43 a | -1.68±0.37 a | ---- | |
| 15 | ---- | ---- | -1.54±0.30 a | -1.75±0.02 a | -1.67±0.19 a | ---- | |
dah: days after harvest. L* Luminosity, a*: chromaticity from green to red, b*: chromaticity from blue to yellow. Values followed by a different letter in the same row indicate significant statistical differences between treatments according to Tukey (P<0.05). (---) Loss of consumption quality. Means of four replicates ± standard error.
Chromaticity from blue to yellow (b*)
There were no significant differences between treatments for the value b* (Tab. 2). The highest b* was obtained in the control treatment with -1.51 on average, while the CyDs treatment with 600 µg L-1 was the most negative with -2.04, which implies that the CyDs generated a slight tendency to present higher intensity of the blue color than the control. This contrasts with López-Nicolás et al. (2007) who found that b* values increased slightly as the applied dose of CyDs increased, which implied that without CyDs peach juices lose yellow tones and oxidize more quickly, gaining a red color, which differs from what happened in blueberries where the b*, had a slight tendency to decrease.
Table 3. Chroma and hue of blueberry fruits, subjected to different doses of cyclodextrins during the postharvest period.
| Parameter | dah | Cyclodextrin doses (µg L-1) | |||||
|---|---|---|---|---|---|---|---|
| 0 | 200 | 400 | 600 | 800 | 1,000 | ||
| Chroma | 0 | 6.87±0.14 ab | 6.65±0.22 ab | 6.46±0.17 ab | 6.19±0.21 b | 6.92±0.18 ab | 7.19±0.16 ab |
| 1 | 7.03±0.25 a | 7.34±0.22 a | 7.19±0.21 a | 7.52±0.11 a | 7.1±0.39 a | 7.35±0.19 a | |
| 2 | 6.69±0.28 a | 6.80±0.15 a | 6.70±0.11 a | 7.44±0.07 a | 7.19±0.17 a | 7.15±0.29 a | |
| 3 | 6.58±0.29 a | 6.97±0.38 a | 6.90±0.2 a | 7.51±0.19 a | 6.86±0.17 a | 6.95±0.21 a | |
| 4 | 6.34±0.33 b | 7.03±0.25 ab | 6.85±0.28 ab | 7.6±0.13 a | 7.28±0.27 ab | 7.11±0.2 ab | |
| 6 | 6.42±0.23 a | 7.19±0.23 a | 6.84±0.25 a | 7.61±0.22 a | 7.01±0.32 a | 7.34±0.27 a | |
| 7 | 6.30±0.22 a | 6.93±0.18 a | 6.59±0.30 a | 7.15±0.20 a | 6.9±0.18 a | 6.94±0.25 a | |
| 8 | 5.81±0.49 a | 6.48±0.15 a | 6.16±0.39 a | 6.91±0.22 a | 6.84±0.32 a | 6.54±0.22 a | |
| 9 | 6.16±0.21 a | 6.48±0.18 a | 6.39±0.30 a | 6.65±0.17 a | 6.72±0.26 a | 6.80±0.29 a | |
| 10 | 6.06±0.26 a | 6.42±0.19 a | 6.16±0.26 a | 6.50±0.08 a | 6.60±0.22 a | 6.78±0.38 a | |
| 11 | 5.97±0.26 a | 6.23±0.15 a | 6.11±0.25 a | 6.46±0.21 a | 6.46±0.32 a | 6.57±0.52 a | |
| 13 | 5.91±0.16 a | 6.08±0.19 a | 6.16±0.16 a | 6.04±0.26 a | 6.25±0.25 a | 6.42±0.24 a | |
| 14 | ---- | ---- | 5.85±0.21 a | 6.15±0.07 a | 6.04±0.08 a | ---- | |
| 15 | ---- | ---- | 5.98±0.25 a | 6.25±0.05 a | 5.99±0.31 a | ---- | |
| Hue | 0 | 285.83±1.04 a | 284.18±1.35 a | 285.42±1.36 a | 281.83±2.38 a | 286.24±2.45 a | 286.06±1.77 a |
| 1 | 286.77±0.9 a | 287.58±0.92 a | 287.41±1.55 a | 288.67±0.97 a | 287.36±2.02 a | 288.03±0.85 a | |
| 2 | 282.61±1.7 a | 286.14±1.65 a | 282.99±1.08 a | 287.63±1.53 a | 286.26±1.18 a | 285.86±2.00 a | |
| 3 | 284.31±2.01 a | 286.65±1.9 a | 284.95±1.04 a | 288.27±0.9 a | 286.10±1.73 a | 287.3±1.43 a | |
| 4 | 282.08±2.06 a | 285.11±1.28 a | 283.91±1.57 a | 288.79±0.52 a | 286.04±1.89 a | 285.25±1.14 a | |
| 6 | 283.70±2.01 a | 285.61±1.09 a | 284.95±1.81 a | 288.08±0.91 a | 284.61±2.16 a | 286.22±1.34 a | |
| 7 | 284.72±2.34 a | 286.98±0.91 a | 285.33±1.56 a | 288.12±1.63 a | 286.42±1.10 a | 286.16±1.17 a | |
| 8 | 281.46±1.92 a | 282.87±1.02 a | 283.29±1.37 a | 287.46±1.32 a | 283.93±2.87 a | 284.61±0.87 a | |
| 9 | 281.05±0.42 a | 282.44±1.88 a | 284.22±0.77 a | 285.58±1.77 a | 283.92±1.61 a | 284.2±1.00 a | |
| 10 | 284.14±1.33 a | 286.03±1.52 a | 284.97±1.19 a | 288.96±2.10 a | 285.52±1.25 a | 286.98±0.86 a | |
| 11 | 282.66±1.74 a | 283.37±1.7 a | 283.92±0.42 a | 288.60±1.76 a | 285.61±1.98 a | 286.77±0.65 a | |
| 13 | 282.67±3.48 a | 284.89±2.64 a | 283.91±1.57 a | 288.18±1.26 a | 288.27±0.82 a | 286.60±1.47 a | |
| 14 | ---- | ---- | 285.3±1.71 a | 285.38±4.25 a | 286.39±3.81 a | ---- | |
| 15 | ---- | ---- | 284.72±2.58 a | 286.29±0.33 a | 286.06±1.16 a | ---- | |
dah: days after harvest.Values followed by a different letter in the same row indicate significant statistical differences between treatments according to Tukey (P<0.05). (---) Loss of consumption quality. Means of four replicates ± standard error.
Chroma
There were significant differences for days 1 and 7 dah, where the treatment of 600 µg L-1 of CyDs was the one that obtained the highest values during most of the study, while the control treatment maintained low values (Tab. 3). In this regard, Eum et al. (2013) found that the changes in the value of L*, hue and chroma were variable during storage for both cultivars and storage temperatures, similar to found in the present study, where variations in the chroma were not notorious and had a tendency to decrease throughout the postharvest period. Also López-Nicolás et al. (2007) found that the application of CyDs decreased the loss of chroma in peach juice.
Hue
Hue did not have significant differences between treatments or between the measurements carried out over time (Tab. 3). Hue presented the lowest value in the fruits of the control treatment with average values of 283.51, while the treatment with the application of 600 µg L-1 of CyDs had the highest value (287.28). In this regard, Eum et al. (2013) found in 'Bluetta' blueberries that when comparing the value of the skin hue it was more blue-purple than those of the Duke cultivar, they also determined that the values depend on the cultivar and the storage temperatures applied. Due to the above, it is considered that when handling controlled conditions and room temperature, the fruits in the study did not make an estimable difference in hue, in addition to this, the state of maturity does not allow for marked changes in hue either. Likewise, López-Nicolás et al. (2007) mention that as the CyDs concentration increased the hue values decreased in peach juice.
CONCLUSIONS
The treatment of 400 µg L-1 of CyDs had the best behavior in parameters such as ML, firmness, TSS, MI and RR with respect to the control, while the application of 600 µg L-1 had the highest values of pH, AnT, L*, b*, chromaticity and hue. AnT increased up to 13 dah in the blueberry fruits, and thereafter, they decreased, which indicates the beginning of senescence and the loss of quality and nutritional value. During the storage of blueberry fruits, the values of L* and chromaticity decreased, while a* increased and b* and hue remained constant. The application of CyDs did not affect the organoleptic properties of the treated fruits in relation to the control, therefore, probably the CyDs do not affect the quality of consumption, however, more research should be done to be able to elucidate the action of the CyDs in postharvest of blueberry fruits.

