1. Introduction
The generation, transmission and distribution systems of energy are designed to supply a quantity of electric energy based on a previous design. This capacity represents a certain number of houses, small, medium or large industries, businesses and consumers. The problem is that over the years the electric demand has been increasing due to the modification of houses in small businesses. This in turn leads to the modification of the areas that were previously residential to become commercial areas of greater consumption, due to new technologies used by industries and businesses (Serna-Montoya et al., 2023). Thus, the increase in the electric demand requires increasing the capacity of generation, transmission and electric distribution at a structural level (Pérez-García et al., 2019). This leads to a significant increase in economic investments by companies in order to cover the demand (Chang & Yeh, 2003; Lopatkin, 2017).
Another problem caused by the rapid increase in electrical demand is the increase in the maintenance effort. For example, if a system was initially designed to have a durability of 15 years, the increase in reactive loads decreases the initially designed capacity with a reduction to 8 years, wich implies a reduction of 40% of the initial life-time system (Durán-Chinchilla & Rosado-Gómez, 2020). This generates different negative factors in the distribution systems that require corrective intervention, increasing the cost of maintenance and replacement of affected devices, generating possible blackouts and collateral effects on businesses and industries that depend on this network (Chang & Yeh, 2003; Hannan et al., 2018).
To reduce the harmful effect of increased reactive loads that decrease the capacity of the distribution system, capacitors are mainly used. These devices help to counteract and return a quantity of the lost capacity, but it has the limitation that it only improves a certain amount. In this article we address Flexible AC Transmission Systems (FACTS) devices, especially the design and implementation of a D-STATCOM prototype, making a comparison between the theoretical behavior and the aforementioned prototype.
2. Methodology
2.1 Advanced Static VAR Compensator
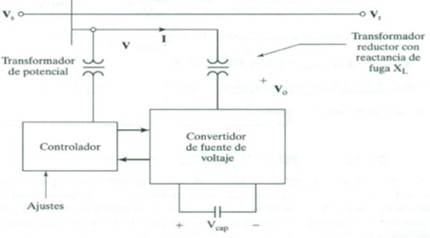
The Static Advanced VAR Compensator (STATCOM), is essentially a voltage source converter (Figure 1), and it can also be replaced by a current source inverter. The function of this device is to synchronize with the power grid so that
2.2 Design and synchronization of the inverter stage with the electrical grid
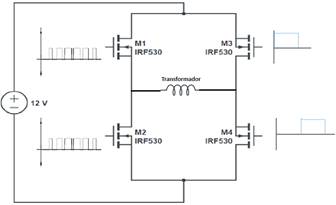
The inverter stage is composed of an H bridge (Figure 2), and is responsible for alternating the polarity of the DC source in such a way that we can generate an alternating current on the low side of the transformer. With the necessary control we can maintain these alternations at 60Hz, which is the working frequency of the electrical network.
The Sinusoidal Pulse Width Modulation (SPWM), control strategy was used for the inverter. This technique consists of comparing a sinusoidal reference signal with a triangular carrier signal. By comparing these two signals, we obtain pulses with different pulse widths, which would be the MOSFETs signal activation. These pulses generated by the comparison of both signals allow us to partially charge and discharge a capacitor connected to the high side, in such a way that a sinusoidal wave like that of the electrical network is generated, which is very useful for subsequent synchronization (Yuditya et al., 2020).
To create the SPWM pulses, the Arduino nano interrupts were used, since this microcontroller operates up to 16 Mhz (). For the calculation, a carrier signal of 10Khz was established and with the switching speed of the Arduino interrupts we obtain a maximum pulse of 800 steps (eq.2), which will be the maximum width of one of the pulses. To calculate the number of pulses that each phase sequence must have, we can calculate it analytically, knowing that the sinusoidal signal to which we are going to synchronize is 60Hz, it gives us a calculation of 83.3 (eq.1) that we can approximate to 84 pulses. Now if we divide the 180° that each sequence has in the 84 pulses it gives us 2.16° (eq.3) which would be the start of each pulse, from this we take the sine (eq.4) and multiply it by the maximum value previously calculated which would be 800 (eq.5) giving us the width of each pulse (Al-Adwan & Al Shiboul, 2020; Yuditya et al., 2020).
By making this calculation for the 84 pulses, a table was established with the different values that each pulse must have. These pulses would be equivalent if we used a reference sinusoidal signal compared to a triangular carrier signal
In the Arduino implementation, pulses with a peak voltage of 12V DC are generated, with a total of 84 pulses with different duty cycles. These pulses are on the low side. On the other hand, the signal on the high side forms a sine wave similar to the electrical grid, thanks to a capacitor on the high side that allows controlled charging from the pulses on the low side.
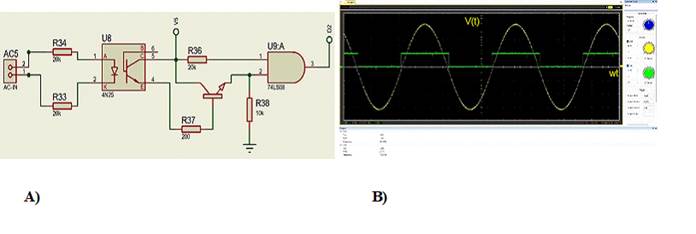
In order to synchronize the D-STATCOM prototype inverter with the electrical grid, we need a way to track zero crossings and the phase sequence in which the grid is located, in order to make a correct connection and not have undesired behavior. For this, a circuit was designed that allows us to monitor in real time the positive sequence of the electrical grid (Figure 3) generating a square pulse.
Using the positive sequence signal (Figure 3A) that reaches the Arduino on pin 2, a function called verify is activated. This function is only valid on pins 2 and 3 of the Arduino nano and is activated when it detects a changing signal, in this case a rising edge called RISING.
When the green rising edge is detected (Figure 3B) on pin 2 of the Arduino, the verify function is activated. This function verifies the value of the path of a variable called num. This variable stores the path of the list of values that the previously established pulse table generates. Therefore, it is possible to know how out of phase the inverter stage is with the electrical network.
In Figure 4a, we observe that the yellow electrical network is delayed to the green inverter signal, but almost immediately upon detecting the green rising edge (Figure 3b), the signals are synchronized, being a speed of 60Hz. This adjustment occurs every 16 milliseconds which is very fast in synchronization (Figure 4b).
2.3 Voltage control
Voltage control can be achieved by controlling the voltage of the H bridge (Figure 2). In this case, a DC-DC boost converter connected to a pulse generator circuit based on the TL494 integrated circuit was implemented. The pulses generated through the circuit are directly connected to a second Arduino called CONTROL-MASTER, through a MCP4725 DAC connected to pin 3 of the TL494. It allows to control the percentage of activation duty of the DC-DC converter: if the voltage applied to pin 3 is greater than 3.3 V, the activation duty of the DC-DC converter is zero. However, if that voltaje is gradually decreased it begins to generate pulses with an increasingly higher duty, obtaining an increase in the H bridge increasing the voltage on the high side of the inverter.
A fuzzy logic-based strategy was used for voltage control, with the Matlab Fuzzy Logic Designer tool. A simulation of the voltage control was performed, with this simulation the input and output membership functions were defined. For the implementation in Arduino, the library Embedded Fuzzy Logic Library (eFLL), was used. This open-source library allows us to apply the input and output conditions previously analyzed in the Fuzzy Logic Designer Matlab program.
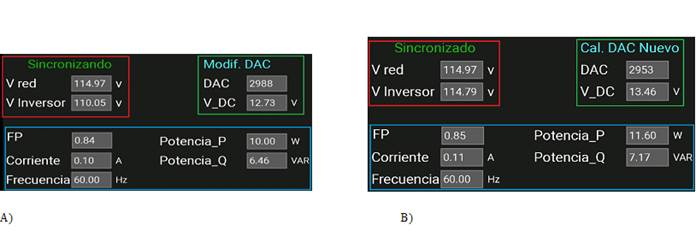
Once the frequency of the inverter stage of the D-STATCOM prototype is synchronized with the electrical grid, the fuzzy control starts working. We can observe that initially the inverter voltage is below the voltage of the electrical grid (Figure 5a). At that moment the DAC starts to modify its value by modifying the pulse width of the DC-DC converter, increasing its voltage, equalizing both voltages (Figure 5b).

Figure 5 Synchronizing the inverter voltage with the mains voltage. A) Before synchronization. B) After synchronization.
The voltage measurement is done through a circuit that allows a small current circulation, which in the case of the electrical network assuming a peak voltage of 170V, the maximum current would be only 0.84mA, where by obtaining the potential difference in the 2.2KΩ resistance referring to ground we would obtain a voltage of 1.84V maximum in DC, which is a tolerable value for the Arduino since in one of its analog inputs it would not exceed the 5V that it can support.
In order to monitor the RMS voltage of both the inverter stage and the reference AC power grid, the Arduino analog inputs A0 and A3, both 10 bits, were used. Because the Arduino detects an instantaneous voltage, several measurements were made and the formula in eq. 6 was applied to calculate the RMS voltage.
One of the problems with inverters is that when the load is connected, a decrease in the amplitude of the inverter is generated. If the prototype were to work simply as an inverter, this effect would be corrected only by increasing the lost voltaje, using any control method. However, the function of a D-STATCOM is to synchronize with the electrical network just at the moment when the load is connected. Therefore, to prevent unwanted effects at the time of synchronization, records will be taken of different types of loads and see how much should be corrected for each variation. The idea is that by monitoring the voltage, current and power that the electrical network is supplying to the load, an estimated amount of the voltage of the inverter stage is increased above the electrical network, in order not to put the prototype at risk and to compensate for possible drops that the inverter stage would have in a direct synchronization with the load.
In order to record the behavior of the inverter stage under different load types, a card was designed in which resistive power loads, inductive and capacitive loads can be connected.
The strategy consists of connecting as many load configurations as possible and taking a record of the effect that occurs in the inverter stage. Then using the grid voltage as a reference and correcting the inverter voltage drop by equaling it to that of the electrical grid. At that time a record of the grid voltage, the inverter voltage, the current, the active power P, the reactive power Q, the power factor FP and the recorded DAC value is taken.
The control strategy to be applied consists of using neural networks. The fundamental principle of the neural network consists of training it with the recorded data, for this the values of the network voltage, the voltage of the inverter stage, the current, the active power P, the reactive power Q, the power factor FP are used as inputs, and as output data the value of the DAC that was recorded when the network voltages were equalized with the inverter stage, this is repeated with all load combinations.
Once the neural network is trained, all the neurons, weights and activation types are taken to calculate the output value, which in our case would be the value of the digital-analog converter (DAC). With these values, we can estimate a compensation voltage of the inverter stage before synchronization and avoid unwanted behavior of the prototype.
At the time of matching the inverter voltage with the voltage of the electrical network, the previously established neural network is entered by entering the input values, these values generate a new inverter voltage as compensation for the possible drops that would occur if it were connected only to the load.
3. Results and discussion
3.1. Connecting the prototype to the power grid at full load
For synchronization, a solid-state relay was used. This relay is activated just at the moment of zero crossing in order to reduce the possibility of unwanted behavior. However, the prototype has code-level protection where the current is monitored to make a disconnection in a controlled manner, in turn it has fuses to strengthen any human error or if the speed of the controller is not fast enough.
As it can be seen in Figure 6a, before connecting to the grid, the inverter maintains synchronization with the grid and a compensation voltaje, previously calculated with the neural networks mentioned in the previous section. When the connection is made, we observe that both signals are perfectly synchronized (Figure 6b), but because the coupling transformer is approximately 1 KVA, the grid voltage predominates in the synchronization regardless of the fact that the prototype maintained a higher voltage before synchronization.

Figure 6 Connecting the prototype to the power grid. A) Monitoring the synchronization and zero crossing of the inverter with the electrical grid. B) Monitoring the inverter's connection to the power grid.
At the time of synchronization, the P&O control comes into operation. It is responsible for monitoring and modifying the DC voltage in the H bridge. The objective is to increase the voltage of the inverter stage above the grid voltage so that the device behaves as a variable capacitor, adjusting the power factor to the desired value, which in this case is above 0.9.
Initially, the load power factor is 0.62 (Figure 7a). The operation of the control allows the prototype voltage to be increased above the grid voltage, but as mentioned before, this increase is reflected in the forward current, modifying the power factor to a value of 0.91 (Figure 7b), while maintaining the same voltage.

Figure 7 Power Factor Variation. A) Before connection to the power grid. B) Modification by connecting to the grid.
As it can be observed, the prototype is working correctly in all aspects related to a D-STATCOM since the frequency synchronization with the electrical network works efficiently. Furthermore, an extremely important parameter to avoid an undesired effect on the connection, the voltage synchronization also works correctly, and last but not least, the power factor correction at the moment the prototype is connected to the network, allowing its modification to the desired value in full synchronization.
However, and although the desired objective was met, it is observed that by modifying the power factor the supply of active, reactive and current power increases, which would be counterproductive to its purpose. This is because it is only a prototype designed for the implementation of the control and its design and implementation was only based on the theoretical operation being subject to constant improvements, some of these could be achieved with the following cases.
The inverter stage is connected to the mains through a coupling transformer. Initially, a 500 VA toroidal transformer was used. With this transformer, it was observed that at the time of synchronization, the modification of the power factor was corrected, but with an increase in current consumption above 1 A. Later, the toroidal transformer was changed for two 1 KVA transformers, connecting the low side in parallel and the high side in series. This combination demonstrated that the same result was achieved in the modification of the power factor, but with less current consumption, which was around 0.8 A.
Finally, a third 1 KVA transformer was added by connecting the 3 on the low side in parallel and on the high side in series, obtaining a notable improvement in the power factor correction, where it is observed that the power factor is corrected but with less current consumption of around 0.25 A and less consumption in active and reactive power. That shows that if we increase the power of the coupling transformer possibly to values of the distribution transformer we would obtain optimal values in its operation.
4. Conclusions
The control of the different stages works correctly, but the behavior of the D-STATCOM is not working as expected since theoretically. When improving the power factor there should be a decrease in the total current supplied by the electrical network, but the opposite is happening, not only the current increases, but also the consumption of active and reactive power increases, although in practice these values are related to the limitation of the coupling transformer since when increasing its power the values improve.
The synchronization strategy used works efficiently since it is not only synchronized with the compensation voltage to prevent unwanted behavior, but also maintains synchronization in time, and it is very important since if not, it could have harmful effects due to phase shift.
The design of the phase sequence detection allows the creation of different control strategies apart from the proportional one. Because its simplicity allows the use of other control strategies such as fuzzy logic or neural networks in frequency synchronization.


