Introduction
Cardiovascular diseases (CVD) have become one of the major health concerns today, alongside cancer, diabetes, and respiratory diseases, as they have experienced a marked increase in recent years, exerting a significant impact on people's health. In fact, CVD tops the list as the leading cause of global mortality 1. In this context, the healthcare sector generates a significant volume of data related to human health daily 1.
The Pan American Health Organization, in its most recent reports, notes that cardiovascular diseases (CVD) cause more deaths annually than any other disease in the world 2. In Colombia, in 2021, 51,988 deaths were recorded due to this disease, representing a 12% increase compared to the previous year 3. These figures are influenced by various causes that vary across regions nationally. Particularly in the department of Sucre, deficiencies in certain medical specialties necessary for optimal care of patients with cardiovascular problems are highlighted. Additionally, the diagnosis of cardiovascular diseases can be complicated due to the variety of symptoms that can manifest, and they are often underdiagnosed 4.
Symptoms of cardiovascular diseases can vary between men and women and include chest pain, difficulty breathing, numbness, weakness in the legs, and other variables 2. Furthermore, there are associated risk factors such as age, gender, family history, smoking, poor diet, among others, that directly influence the development of this disease 2. All these factors pose a challenge for health institutions and researchers in their efforts to more effectively address the control of this disease.
Faced with this challenge, emerging technologies that make use of Artificial Intelligence (AI) to support medical decisions are presented as a highly relevant resource. Several researchers have begun to explore the potential of machine learning as a promising solution to improve informed and timely decision-making in this context. An illustrative example of this trend is found in the study in 5, where the impact of machine learning on the prediction of cardiovascular risk was evaluated. In addition, research has been carried out that focuses on evaluating models based on Artificial Intelligence (AI), as observed in the work of 6 related to the prediction of psychosocial risks in public school teachers. In this study, the performance of three different models was analyzed: Naïve Bayes, decision trees and artificial neural networks.
This approach of applying Artificial Intelligence (AI) has extended to the prediction of other non-communicable diseases (NCDs), as evidenced in the model developed by 7-8 for predicting breast cancer. It is important to note that breast cancer is among the most common and deadly cancers in women. Various AI techniques were employed for this study, including linear discriminant analysis, Naïve Bayes, K-nearest neighbors, and support vector machine methods.
Undoubtedly, artificial intelligence and Big Data have witnessed a notable growth in the field of scientific research. This phenomenon has been further accelerated by the COVID-19 pandemic, as reflected in an analysis of the Scopus database. Using the search equation "Big data" OR "artificial intelligence," a total of 358,751 documents related to these keywords were generated between the years 1957 and 2018, a period spanning six decades. However, in just five years, from 2019 to October 2023, 283,580 documents have been published, constituting 44% of the total documents related to these same keywords.
The data obtained in the field of health due to the COVID-19 pandemic have led to a series of significant research studies that have enriched our knowledge 9. Despite this, to date, there are few studies that have addressed a detailed comparison of performance in the diagnosis of cardiovascular diseases among three specific techniques: neural networks, random forest, and decision tree. Therefore, the central purpose of this article is to conduct an experimental investigation with the aim of evaluating and comparing the performance of these three Artificial Intelligence (AI) techniques as support tools in the diagnosis of cardiovascular diseases. The structure of the article is divided as follows: Section 2 is dedicated to the methodology, Section 3 presents the results and discussion, and finally, Section 4 provides the study's conclusions.
Methodology
This project focuses on the construction and performance evaluation of three artificial intelligence models: Artificial Neural Networks, Random Forest, and Decision Tree. To carry out this evaluation, we will use common evaluation metrics in classification algorithms, ensuring the consistent application of the same metrics to assess all three models. The methodology is based on an experimental and retrospective learning approach, involving controlled experiments to train and evaluate machine learning models on current datasets. In contrast, the retrospective approach on historical data focuses on using past data to analyze and learn patterns, trends, and lessons from previous experiences with the goal of improving the performance of machine learning models. Both approaches are essential for the development and continuous improvement of machine learning algorithms.
At the core of this approach are the datasets used to train the models and the artificial intelligence techniques employed. In general terms, the methodology involves constructing and evaluating each model using a dataset that is divided into significant predictor variables for the diagnosis of cardiovascular diseases and a target variable. Additionally, a uniform evaluation metric will be applied to compare the performance of the three models in diagnosing these diseases.
The study is divided into four main stages. In the first stage, a literature review will be conducted to identify the most relevant variables for the diagnosis of cardiovascular diseases. In the second stage, we will choose the most suitable dataset that aligns consistently and cohesively with the identified variables. For this, we will utilize freely available data sources. In the subsequent stages, we will proceed to construct the three models according to the previously selected techniques. Finally, in the last stage, we will assess the performance of the models using standard metrics for classification algorithms.
Relevant Variables in the Diagnosis of Cardiovascular Diseases (CVD)
The identification of the most relevant variables in the diagnosis of cardiovascular diseases (CVD) requires a comprehensive analysis of scientific literature, where various authors have addressed these variables in their research.
In a study conducted by 8 on patients from a hospital in Cali, Colombia, critical variables for cardiovascular risk estimation are highlighted. These variables include age, gender, Body Mass Index (BMI), measurements of systolic and diastolic blood pressure, cholesterol levels, as well as high-density lipoprotein (HDL) and low-density lipoprotein (LDL) cholesterol, in addition to glucose levels. Similarly, in 10, crucial variables are identified in their study population, such as age, gender, physical activity, smoking, BMI, and diabetes. Additionally, the lack of knowledge in the study population about factors that can increase cardiovascular risk is emphasized.
Electrocardiographic results are another set of relevant variables for the diagnosis of CVD. In fact, 11 Sánchez consider them in their study, as the quality of left ventricular function directly impacts the prognosis of patients with cardiovascular diseases. Furthermore, the measurement of myocardial deformation (strain) has become an early and sensitive indicator of heart failure, and for this study, previous electrocardiograms are necessary. Therefore, including the electrocardiogram as a variable in the cardiac diagnosis assessment can be crucial.
In a study carried out on patients from an outpatient unit in Ecuador, in 10, they conclude that maintaining a normal BMI, systolic blood pressure below 120 mmHg, and serum levels of total cholesterol and HDL within normal ranges are factors that contribute to preventing the onset of CVD. On the other hand, elevated levels of total cholesterol and HDL are associated with a higher overall cardiovascular risk."
Data Selection and Programming Language
Searches were conducted in publicly accessible database sources, including Datos Abiertos Colombia, Google Dataset Search, and Kaggle, with the aim of selecting the most appropriate dataset. Among these sources, Kaggle proved to be the most relevant due to its dataset that significantly aligned with the variables of interest for our study, in addition to providing valuable additional information for the diagnosis of cardiovascular diseases. On Kaggle, different data sources containing variables like those required to develop our models were examined. Among these sources, a dataset named 'Heart Disease Classification Dataset' 12 was located, describing the behavior of a group of individuals, and providing a set of specific features that were crucial in determining whether a person had cardiovascular disease. Table 1 shows the variables identified in this dataset.
Table 1 Description of Dataset Variables
| Variable | Descripción |
|---|---|
| Edad | This variable provides the age of the person under study. |
| Sexo | Indicates the gender of the individual, coded as 1 for male and 0 for female. |
| CP | Explains the type of chest pain the individual has experienced, using codes: 0 for stable angina, 1 for unstable angina, 2 for non-anginal pain and 3 for asymptomatic. |
| Trestbps | It shows a person's resting blood pressure value in millimeters of mercury (mmHg). Values above 130-140 are considered worrisome. |
| Chol | Indicates the serum cholesterol level in milligrams per deciliter (mg/dl) or total cholesterol. |
| Fbs | A subject's fasting blood sugar level is assessed by comparing it to a threshold of 120 mg/dl. If the fasting blood sugar level is greater than 120 mg/dl, it is recorded as 1 (true); otherwise, it is recorded as 0 (false). If the value exceeds 126 mg/dl, this may indicate the presence of diabetes. |
| Restecg | Presents the results of the electrocardiogram performed in the resting state, where codes are used: 0 for a normal result, 1 for the detection of ST-T wave abnormalities and 2 to identify left ventricular hypertrophy. |
| Thalach | Refers to the maximum heart rate achieved by the individual. |
| Exang | Angina triggered by physical exertion: It is represented by the number 1 if present and by the number 0 if absent. |
| Oldpeak | Displays a numerical value reflecting the ST-segment decrease caused by exercise compared to the resting state. |
| Pendiente | ST segment slope during maximal exercise: Coded as 0 for upward slope (rare), 1 for flat (typical of a healthy heart) and 2 for downward slope (indicative of cardiac problems). |
| Ca | Indicates the number of major vessels showing color in images obtained by fluoroscopy, ranging from 0 to 3. |
| Thal | Coded as 1 and 3 for normal, 6 for fixed defect and 7 for reversible defect, indicating blood circulation during exercise. |
| Objetivo | Indicates whether or not the person suffers from heart disease, with coding 1 to indicate the presence of the disease and 0 to indicate its absence. |
The dataset obtained from Kaggle underwent a comprehensive cleaning and refinement process in an Excel spreadsheet. The method of removing rows or columns was applied to address incorrect or non-significant records, such as the ID. Additionally, empty or null values were identified in various records, and a careful elimination process was carried out to ensure data integrity.
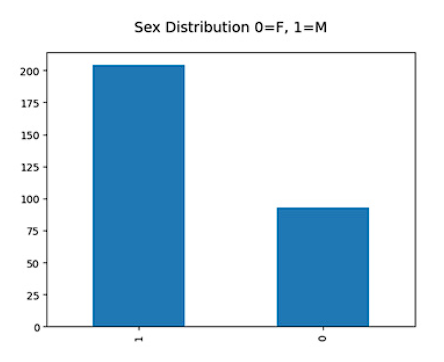
As a result of this meticulous work, the original dataset, initially consisting of 303 records and 14 columns, was reduced to 297 records while maintaining the same 14 columns. Furthermore, a translation of column names into Spanish was performed to make the content of each column more easily interpretable for all users. Additionally, a transformation of the values in the gender column into a boolean format was carried out, assigning the value 1 for male and 0 for female, enabling a more efficient and consistent representation of this variable in the dataset. Thus, the final dataset consisted of 204 entries corresponding to the male gender and 93 entries corresponding to the female gender.
It is important to note that Python, as an open-source language, does not entail costs for its usage and offers extensive flexibility, allowing programmers to adapt it to their specific needs. Within the field of artificial intelligence, Python has emerged as a widely preferred tool due to its ability to be used in a variety of contexts and combinations, from web application systems to integration with electronic devices. This enables the supply of information and data to algorithms efficiently, allowing the computer to perform analytical, deductive, predictive, and procedural tasks autonomously, without depending on human intervention 13.
Next, the data exploration phase is presented, which is fundamental for understanding the structure and characteristics of the dataset. This process is crucial as it allows us to highlight the importance of each variable and its potential impact on the diagnosis of cardiovascular diseases.
Data Exploration
To begin with, a descriptive analysis of each variable present in the dataset was conducted. Graphical visualizations were generated to help identify trends, distributions, and relationships between variables. Here are some of the key observations:
The dataset consists of 200 records corresponding to the male gender and 97 records corresponding to the female gender (Figure 1), indicating an imbalance in gender representation. This asymmetry in the number of records between genders may influence the analysis and the constructed models, and it is important to consider this imbalance when interpreting results and conclusions related to gender in the diagnosis of cardiovascular diseases.
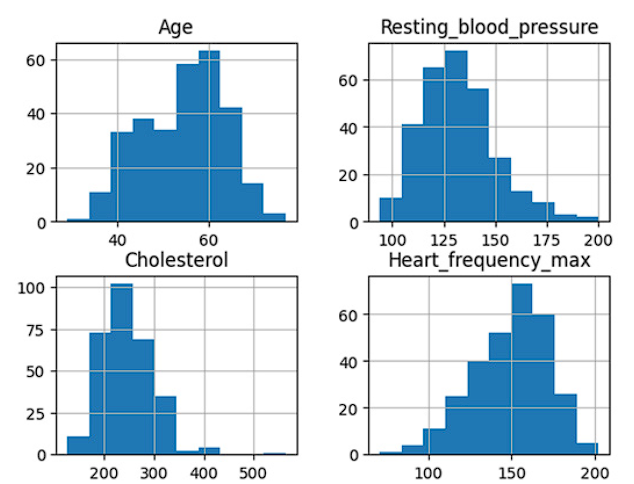
The statistics presented in Figure 2 summarize key characteristics of four variables in the dataset. The average age of individuals is approximately 54 years, with a moderate dispersion (standard deviation of 9.15). Resting blood pressure has a mean of 131.73 mmHg, with moderate variability. The average cholesterol level is 246.45 mg/dL, with a dispersion of around 51.50 mg/dL. The average maximum heart rate is 149.55 beats per minute, with relatively low variation. These statistics provide an overview of the characteristics of the studied population and are crucial for understanding the distribution and variability of the variables.
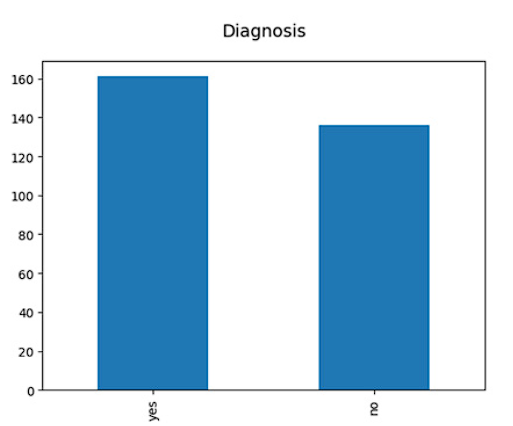
In addition to the exploratory analysis mentioned earlier, a specific count was conducted in the dataset to determine the number of records reflecting the presence or absence of cardiovascular disease in the diagnosis column (target variable). The results of this count revealed that, in the target variable, a total of 161 cases indicating "yes" for cardiovascular disease and 136 cases indicating "no" were recorded (Figure 3). Since the disparity in the number of cases between the two classes is not significantly large, there was no need to apply data balancing techniques, as this would not generate serious bias issues in the models.
The diagnosis column, which labels whether a patient has cardiovascular disease or not, is a critical variable in this study as it serves as the main objective for the construction and evaluation of predictive models. Balance between positive and negative cases is essential to ensure the accuracy and effectiveness of the models.
This information allows us to proceed with the modeling and evaluation process in an informed manner, with the goal of developing a diagnostic system that is highly accurate and beneficial for healthcare and patient well-being.
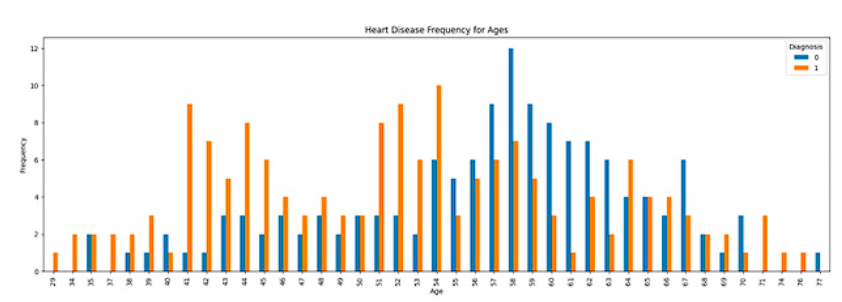
Next, as part of the data exploration process, a chart was created that provides a visual representation of the behavior or frequency of cardiovascular disease diagnoses based on the ages of the patients (Figure 4). This chart offers a clear and insightful view of how age relates to the presence or absence of these diseases, which can be highly valuable for identifying relevant patterns and trends in cardiovascular diagnosis.
In the analysis of Figure 4, a higher number of cases of cardiovascular diseases has been identified in the age range from 41 to 54 years. The concentration of cases in this range suggests that age plays a significant role in predisposition to these diseases, supporting the need to carefully consider this variable when developing detection and prevention strategies. This observation underscores the importance of 'age' in the process of cardiovascular disease diagnosis and should be considered when developing a predictive model in the clinical setting, aiming to timely detect potential cardiovascular risks in patients of various ages.
Finally, we identified 6 out of the initial 14 variables as categorical, meaning their values were not numerical but rather categories. To incorporate these variables into our analysis, we converted them into dummy (fictional) variables, generating new columns to represent each category with binary values (0 or 1). This allowed the models to operate effectively by translating categories into numerical format, avoiding potential biases or incorrect interpretations when treating categories as direct numerical values.
Selection of Artificial Intelligence Techniques
In this phase of the work, we begin by selecting the three most suitable techniques for our cardiovascular disease diagnostic study, based on a review of scientific literature. Firstly, decision trees stand out as a fundamental technique in data analysis. Their importance in supervised classification and relevance in data science are highlighted in 14, supporting their inclusion in our study.
Additionally, the Random Forest (RF) algorithm is chosen due to its demonstrated effectiveness in diagnosing non-communicable diseases. As described in 15, Random Forest (RF) comprises a set of untrained decision trees that employ random selections of samples from the feature space, enabling them to excel in predicting mild cognitive impairment in an international challenge. 16 also emphasizes its performance in clinical data classification, surpassing logistic regression in terms of accuracy.
Lastly, artificial neural networks with a multilayer perceptron structure are considered an essential technique in this study. According to 17, their multi-layered structure allows for a more complex modeling of the data. Furthermore, in medical and climatological studies, as demonstrated by 18-19, their ability to achieve higher prediction accuracy, surpassing other models, has been proven.
Development of AI Models
In the process of developing artificial intelligence models, the decision was made to use an 80/20 data split. This was because the dataset was relatively small, and the maximum amount of data was needed for training to allow the models to learn from a greater number of examples. Initially, the model was developed using the Decision Tree algorithm, which was the initial choice among the three techniques mentioned earlier. Subsequently, progress continued in the same direction, and the model based on Random Forest was created. However, the final model developed is based on artificial neural networks, a somewhat more complex technology compared to the previous ones.
To address this last model, a new working notebook was created, using the same dataset that had been used for the first Decision Tree-based model. Once again, the dataset was split into training and validation sets, allocating 80% of the data for training and reserving the remaining 20% for testing. This approach allowed for thorough exploration and a detailed evaluation of the artificial neural network's performance 20-22.
Evaluation of the Models
Regarding this topic, references 23-25 provide an essential framework by highlighting key evaluation metrics for assessing the effectiveness of a machine learning model, both in regression and classification contexts. In the realm of classification, key metrics are defined, such as "Accuracy," which represents the overall rate of correct predictions. "Recall" focuses on minimizing false negatives, implying that the model strives to detect all positive cases, even at the risk of generating a higher number of false positives. In contrast, "Precision" aims to reduce false positives, prioritizing labeling as positive only when the model has high confidence in its decision, even if this may result in the omission of some true positives. These two metrics play a critical role in the evaluation and optimization of classification algorithms, significantly influencing the quality and reliability of the obtained results. Finally, the "F1 score" is calculated as the geometric mean of precision and recall, providing a balanced measure of the model's performance in terms of accuracy and the ability to identify positive cases.
These metrics play a fundamental role in understanding and evaluating the effectiveness of predictions made by a classification model. To calculate such metrics in algorithms like decision trees and random forests, it is imperative to implement the confusion matrix. In this regard, 26-27 argue that the confusion matrix is an essential tool that allows for a graphical visualization of the results of predictions generated by a supervised learning algorithm. This matrix consists of columns representing predictions made for each class and rows containing each instance of the actual class. Consequently, the matrix provides a clear view of the model's hits and errors once it has been trained with the data.
For the purpose of this study, we will opt for the use of a binary confusion matrix, as it aligns with the nature of the target variable in question. The next stage will involve displaying the confusion matrices generated by each of the models. These matrices will play a crucial role in calculating the metrics, enabling a precise evaluation of the performance of the three models conceived throughout this research.
Results and Discussion
Table 2 summarizes and compares the results of three models used: Decision Tree, Random Forest, and Neural Networks. These models represent different approaches in the field of classification and prediction, and this table will provide an overview of their performance across a set of key metrics.
Table 2 Comparison of Model Results
| Técnica ML | accuracy | precision | recall | F1- Score |
|---|---|---|---|---|
| Decision tree | 82% | 82% | 81% | 81% |
| Random Forest | 85% | 85% | 85% | 85% |
| Neural Networks | 89% | 89% | 89% | 89% |
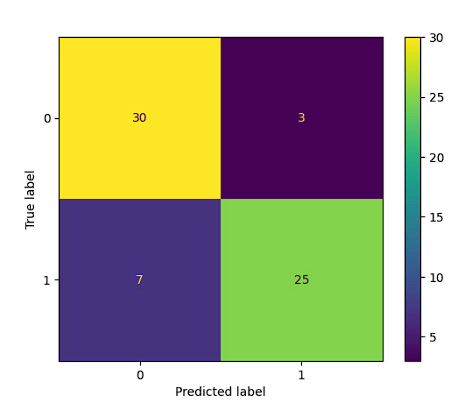
Next, the analysis of these results will be carried out through the confusion matrix. Figure 5 presents the confusion matrix corresponding to the decision tree, from which the necessary quality metrics are extracted to evaluate the performance of this model.
The result of the decision tree model shows a solid performance in the classification of two classes ("no" and "yes"). The overall accuracy of the model is 82%, indicating that approximately 82% of predictions are correct (Figure 6). The "recall" (sensitivity) value is acceptable, with 85% for the "no" class and 78% for the "yes" class, meaning that the model correctly identifies the majority of relevant cases in both classes. The F1-score, which combines precision and recall, is 82%, indicating a reasonable balance between both metrics. Overall, the model appears to be reliable in identifying the two categories, supported by good data support.
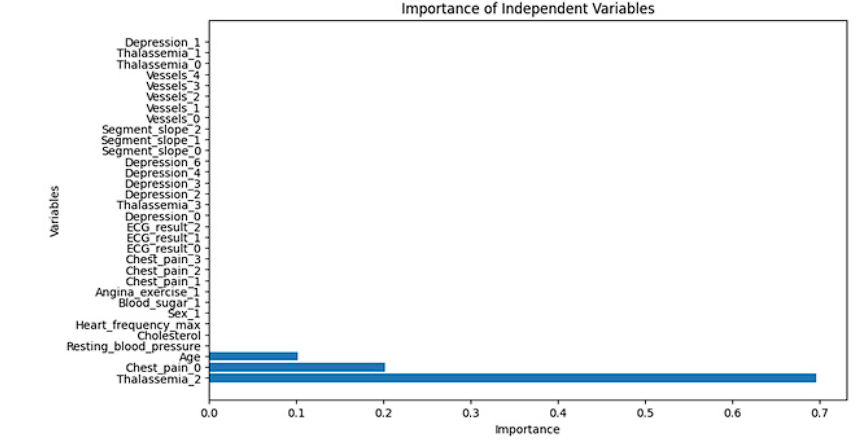
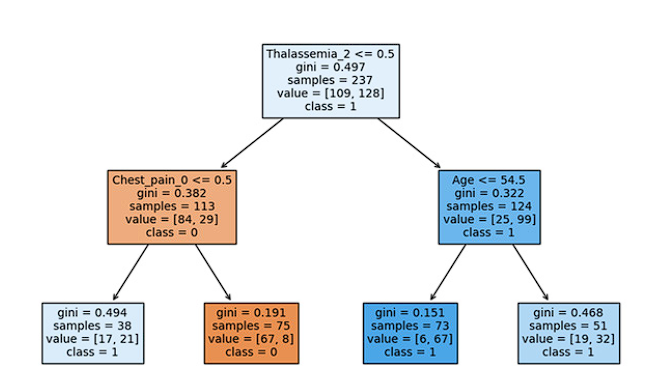
Figure 7 displays the importance assigned by the model to the descriptor variables present in the dataset. On the Y-axis, the variables are presented according to their order in the dataset, and it is observed that the variable "Talasemia_2" has the highest relevance in the decision tree-based model. This highlights the significant influence of this variable on the model's predictions, and it is supported by Figure 8 in the generated tree.
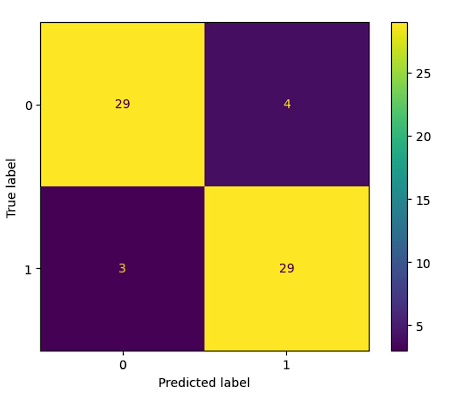
Similarly, we proceed to generate the confusion matrix corresponding to the Random Forest technique. This matrix is detailed in Figure 9, providing a clear visualization of the results of predictions made by this supervised learning algorithm. Similar to the confusion matrix of the Decision Tree model, this matrix allows for identifying the hits and errors of the model when evaluated with test data.
The Random Forest model shows good performance in the classification of two classes, "no" and "yes". The overall accuracy of the model is 85%, indicating that approximately 85% of predictions are accurate (Figure 10). The "recall" (sensitivity) is particularly notable, with 91% for the "no" class and 78% for the "yes" class, meaning that the model effectively identifies most relevant cases in both categories. The F1 score, which balances precision and recall, reaches 85%, indicating a solid balance between these metrics. These results suggest that the Random Forest model is reliable in identifying the two categories, supported by good data support.
The performance of the neural network model involves the classification of the two categories, "no" and "yes." Its overall accuracy reaches 89%, demonstrating that approximately 89% of predictions are accurate (Figure 11). Additionally, both recall and the F1 score also reach 89%, indicating that the model is effective in identifying most relevant cases in both categories and maintains a solid balance between precision and recall. These results underscore the reliability of the neural network model in classification, supported by robust data support, surpassing the previous models.
The confusion matrix of the neural network model provides a visual representation of its performance in classification (Figure 12). This matrix details the number of correctly and incorrectly classified cases for the two categories, "no" and "yes." It is an essential tool for evaluating the model's ability to predict accurately and detecting potential errors in its predictions. Through this matrix, we can identify the number of true positives, true negatives, false positives, and false negatives, allowing us to better understand the effectiveness and reliability of the model in the classification task.
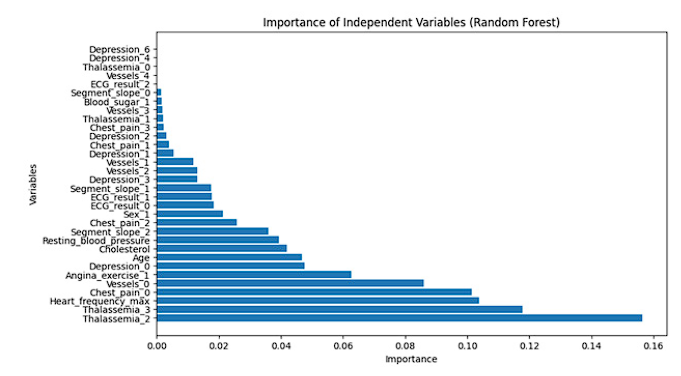
In Figure 13, predictions, and the prevalence of independent variables in the Random Forest model are presented. The importance of features in this model is assessed by analyzing the relative contribution of each variable in decision-making. Variables such as maximum heart rate (0.144) and thalassemia type 2 (0.144) stand out, indicating a significant influence on predictions. Additionally, age (0.076) and chest pain type 2 (0.076) also play a relevant role. In contrast, variables like exercise-induced depression (0.0) and electrocardiogram result type 2 (0.0) have negligible importance in the model's decision-making. This feature importance analysis is crucial for understanding which variables have a greater impact on the model's predictions.
Once the creation of the three artificial intelligence models was completed, an evaluation of their performance was conducted to identify which of them could provide greater support in the cardiovascular disease (CVD) diagnostic process. Throughout this research, the variability in CVD diagnoses has been emphasized, depending on factors such as the analyzed population and the variables included in the study. To develop models that effectively support healthcare professionals in this context, the choice of variables representative of a general population is fundamental, along with the application of widely recognized artificial intelligence techniques in the field of medicine.
In general terms, all three models show good performance in the classification of the two classes ("no" and "yes") to support the diagnosis of cardiovascular diseases. However, the neural network and Random Forest achieve superior results in terms of precision and recall compared to the decision tree. The neural network stands out for its high precision (89%) and recall (91%), indicating a better ability to identify relevant cases in both classes and a solid balance between precision and recall. Consequently, the neural network seems to be the preferable option for this classification problem.
This study contributes significantly to the development of artificial intelligence models for the diagnosis of cardiovascular diseases. By evaluating and comparing the performance of three AI techniques-namely, artificial neural networks, Random Forest, and decision trees-it provides a solid foundation for future research in predictive model creation. It also highlights the importance of considering appropriate evaluation metrics and understanding the fundamental characteristics of each AI technique. The results of this study offer essential insights into building effective artificial intelligence models, allowing readers to better comprehend the role each technique plays in disease diagnosis and encouraging further research in this fiel.
Conclusions
This study highlights the potential of artificial intelligence, particularly through models such as artificial neural networks, Random Forest, and decision trees, to improve support in the diagnosis of cardiovascular diseases (CVD) in environments with limited technological resources, such as the department of Sucre in Colombia. Despite challenges in data collection, crucial variables were identified, including age, gender, Body Mass Index (BMI), measurements of systolic and diastolic blood pressure, cholesterol levels (including good cholesterol - HDL and bad cholesterol - LDL), and the quality of left ventricular function, specifically myocardial strain. These findings have proven to be early and sensitive indicators of heart failure. Maintaining a BMI within a normal range, keeping systolic blood pressure below 120 mmHg, and maintaining serum levels of total cholesterol and HDL within normal ranges are contributing factors to prevent the onset of CVD. Despite obstacles, a suitable dataset was successfully compiled from public sources, emphasizing the feasibility of applying these techniques in resource-limited contexts.
The results underscore the effectiveness of Random Forest and neural network models, with particularly outstanding performance in the case of the latter, achieving an accuracy of 89%, surpassing the other two evaluated models. This finding suggests that the application of these artificial intelligence techniques has the potential to have a significant impact on improving the diagnosis of cardiovascular diseases, especially in regions with limited resources.
The results also highlight the robustness of decision tree and Random Forest models in the task of diagnosing cardiovascular diseases. Although their performance is lower than that of the neural network, with accuracies of 82% and 85% respectively, these models remain viable and effective. This suggests that, depending on available resources and specific needs, the choice between these models can be a crucial strategic decision in the medical context.
The high precision and recall achieved by the neural network model highlight the transformative potential of artificial intelligence in the field of health. These promising results suggest that the implementation of neural network models could significantly contribute to improving the diagnosis of cardiovascular diseases, enabling earlier and more accurate diagnosis, leading to more effective healthcare and better outcomes for patients.
This work provides a valuable starting point for future research in the field of health and artificial intelligence, while emphasizing the importance of careful variable selection and the availability of accurate data in the successful creation of medical diagnostic models. Ultimately, these models have the potential to save lives by efficiently supporting healthcare professionals in early and accurate diagnosis of cardiovascular diseases.
As future work, an expansion of this study could be considered towards a broader range of diseases and medical conditions, leveraging artificial intelligence techniques to enhance diagnoses in other fields of medicine. Additionally, it is essential to delve into the optimization of specific artificial intelligence models, such as neural networks, to achieve even more robust performance tailored to diverse medical environments. Moreover, acquiring datasets with a larger volume of records, including the variables used in this study, is crucial. This will allow for a more robust and accurate evaluation of artificial intelligence models and a more solid generalization of results to a broader population.


