Introduction
The analysis of the Atmospheric Boundary Layer (ABL) has gained increasing interest due to the growth of the world population and the evolution of infrastructure. The ABL is the layer of air situated between 1 to 2 km in altitude where human activities take place. Examples of such activities include wind effects on structures, pedestrian comfort, pollutant dispersion, and wind energy generation. The airflow characteristics in this layer are dependent on several factors, primarily the interaction of air with terrain features, such as roughness 1.
Established techniques exist for physically modelling the Atmospheric Boundary Layer (ABL) in a wind tunnel. Two of these techniques involve the long growth of the boundary layer in the tunnel, which must be significantly greater than the cross-sectional dimension, along with the arrangement and size of roughness on the tunnel floor. Although this technique has traditionally been used for ABL studies, numerical modelling has emerged as a complementary approach in recent decades. The development of modern parallel computers and computational fluid dynamics (CFD) numerical methods has enabled the numerical simulation of turbulent flows using several approaches, ranging from Reynolds-averaged Navier-Stokes (RANS) methods to large eddy simulation (LES) and direct numerical simulation (DNS) 1-3. The main objective of this methodology is to accurately replicate the characteristics of the boundary layer, which primarily depend on the terrain roughness features. Various approaches have been proposed to achieve this purpose. These include incorporating roughness, such as cubic blocks on the ground, and representing vegetation based on drag with the potential velocity law 4,5.
In order to accurately simulate the Atmospheric Boundary Layer (ABL), it is necessary to replicate the exponential behaviour of natural wind flow within it. This requires an appropriate reproduction of the distribution of mean velocity with respect to height and certain turbulent parameters 6. This research proposes an analysis of mean velocity profiles in the Wind Tunnel at the University of Valle to characterize the boundary layer. The content is organized as follows: Section 2 contains the materials and methods; Section 3 presents results and discussion, and Section 4 provides the conclusions.
Material y methods
Wind profiles
The physics of the atmospheric boundary layer is highly complex due to the interaction between the air flow and the Earth's surface, mainly through mechanical and thermal mechanisms. The mechanical interaction results from the friction of the wind against the surface, causing turbulence. In the absence of thermal processes, the ABL remains neutral with an expected exponential velocity profile characterised by frictional velocity and terrain roughness height 6,7. This study initially performed simulations of boundary layer generation inside the tunnel without passive devices to analyze cross-flow field in the test section, subsequently, following Colombian Seismic Resistant Construction Regulation NSR-10 guidelines 8, the wind profile power law was used to explain mean velocity characteristic variations with respect to height within the wind tunnel's test section as presented in Equation (1).
where 𝑈(𝑧) is the mean wind speed at a height z above the ground. 𝑈𝑟𝑒𝑓 is the mean wind speed at a reference height 𝑧𝑟𝑒𝑓 above the ground. And 𝛼 is the terrain roughness index, which depends on the exposure described in the design code 8. Table 1 contains parameters for standard terrains, as specified in the same regulation for Atmospheric Boundary Layer.
Simulation Strategy
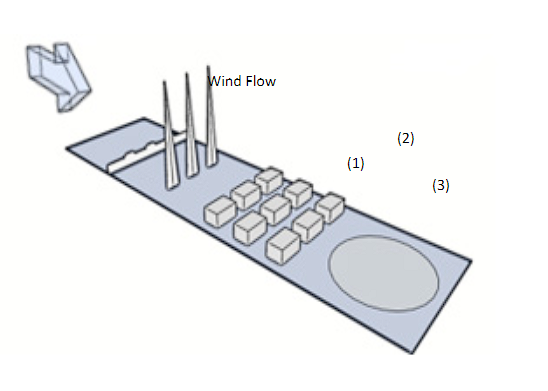
Passive devices, such as spires, castelled barriers, and roughness elements, were used to model the growth of the boundary layer as it happens in the atmosphere (ABL). The experimental work was conducted in the wind tunnel at the Universidad del Valle. This metodology is consistent with previous studies 1,9,10. The wind tunnel operates in an open circuit and includes a 2 m by 2 m test section, along with a 22 m of growth section. The maximum speed achieved in the test section is 30 m/s. In order to comply with the conditions of the ABL as set out in the NSR-10 Regulation, calculations were carried out to determine the dimensions of the turbulent devices. These control devices include metal meshes or grilles to homogenize the wind flow at the inlet and contraction, followed by a castelled-shaped barrier, turbulence-generating spires, and roughness elements spread on the tunnel floor. The design and manufacturing process was divided into several stages: initially, preliminary simulations were carried out using Computational Fluid Dynamics (CFD) to optimize the spacing and sizes of the devices. Subsequently, the fabrication, installation, and testing of these devices in the wind tunnel were conducted. Finally, the dimensions of the devices were defined to adapt the University del Valle Wind Tunnel to the three exposures specified by NSR-10 code. The roughness elements, spires and barrier were arranged on the wind tunnel floor in a configuration and distribution that enabled the acquisition of wind profiles in accordance with the design code (Figure 1). Additionally, a route was programmed for the velocity scanner to accurately capture and measure profiles 11,12.
Boundary Layer Wind Tunnel Experiments
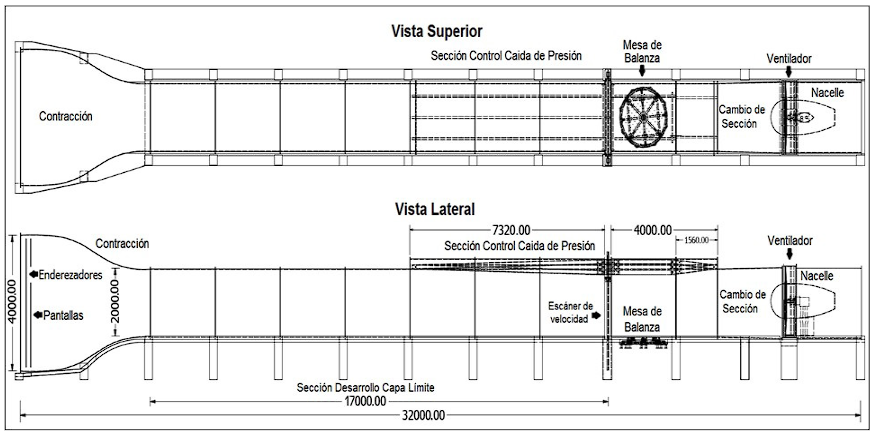
The testing facility at Del Valle University has the capability of producing flow with the parameters of Atmospheric Boundary Layer, the physics of the wind tunnel is in Figure 2.
Before simulating the Atmospheric Boundary Layer (ABL), the basic behavior of the wind tunnel without turbulence-generating elements is assessed. Measurements of the mean velocity are taken in the cross-sectional area of the test section. The development of flow in a wind tunnel is governed by fundamental principles of fluid mechanics; air is induced to flow along the test section through a system featuring a high hydraulic potential fan. The tunnel walls play an essential role in shaping the flow and achieving a uniform velocity field. The geometry of the tunnel walls, together with their aerodynamic profile and surface finish, is carefully designed to minimise the generation of turbulence and flow disturbances. This includes the use of carefully designed cross-sectional profiles to avoid the formation of unwanted vortices and velocity gradients (see Figure 1). Deflectors and correction devices are also incorporated to eliminate vortices and ensure flow uniformity, such as honeycombs and angeo meshes.
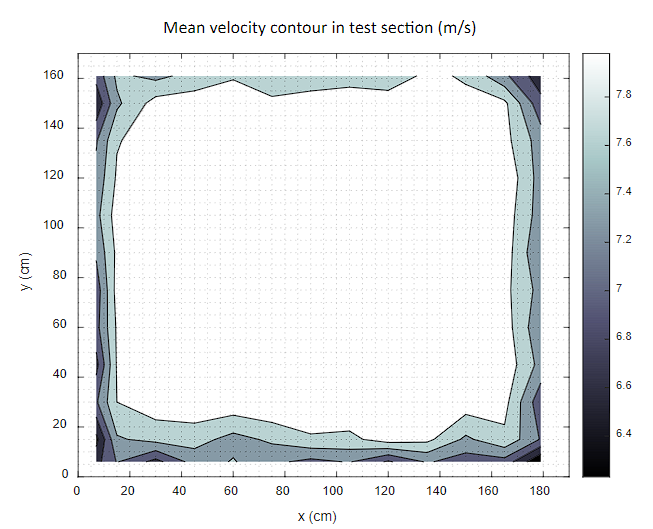
The achievement of a uniform flow in the test region is of utmost importance as it ensures accurate and replicable measurements in aerodynamic tests, allowing a detailed analysis of the flow behaviours and aerodynamic characteristics of the objects or models under examination, Figure 3 shows the uniform mean velocity contour in the test section.
To simulate the ABL in the wind tunnel of the Universidad del Valle, for each category of terrain exposure, there are several definitions with small differences in the ground surface roughness to model the atmospheric boundary layer in wind engineering studies, according to the NSR-10 regulation, the categories of land surface are divided into three categories of exposure: B, C and D.
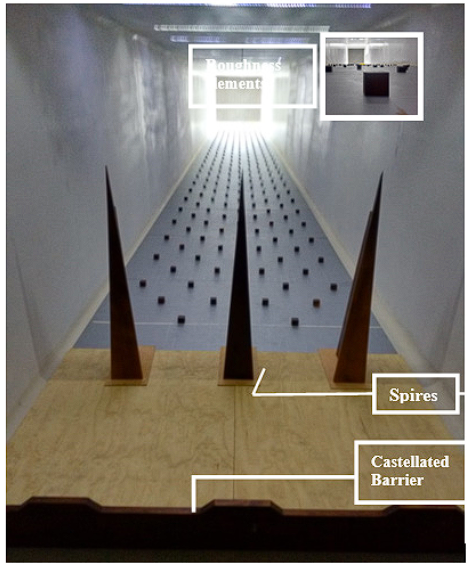
The methodologies that allow the simulation of the ABL are those proposed by Counihan 13, Irwin 14), (3) and Gartshore 15. The procedure starts by obtaining the dimensions with semi-empirical expressions based on average parameters of the type of wind to be generated in the tunnel, after defining the geometric parameters in each model and establishing the aerodynamic parameters with which the evaluation domain and the boundary conditions are carried out 8. The geometrical conditions of the numerical models were established from the measurements of the wind tunnel at the Universidad del Valle. The dimensions of the simulation elements are obtained according to the thickness of the boundary layer to be obtained and the simulation method being used. Additionally, the exponent for the potential law must be taken into account, which is determined according to the terrain to be simulated in the wind tunnel 16,17. Figure 4.
Table 2 presents a summary of the implemented roughness element configurations, which enabled the desired velocity profiles for the three exposure categories to be obtained.
Table 2 Dimensions of the roughness d-elements for the simulation of exposures B, C, D.
| Terrain | Device Configuration | Patron |
|---|---|---|
| B | Spires + Castellated Barrier + cubes 4x4x4 cm (Separation = 35 cm) | Type “Chess” |
| C | Spires + Castellated Barrier + cubes 2.5 x 2.5 x 2.5 cm (Separation = 1 m) | Type “Line” |
| D | Spires + cubes 2.5 x 2.5 x 2.5 cm (Separation = 40 cm) | Type “Chess” |
The material of the roughness elements is wood, and their geometry is cubic. They are fixed to the tunnel by means of 430 steel sheets with neodymium magnets, distributed along the length and width of the tunnel's boundary layer development section, with a grid-like pattern. These elements or obstacles represent the natural surface roughness of the ground, which minimises the amount of movement in the near ground flow to produce turbulence. Additionally, a 21.5 cm high castellated barrier was employed to establish an initial thickness of the boundary layer. This was followed by the introduction of three triangular needles, each measuring 1.11 m in height and 15 cm in width at their base. These needles serve to generate turbulence within the flow and redistribute the deficit in the amount of movement 4.
The scanner is equipped with a Dwyer 160E pitot tube and an OMEGA FMA-900 hot wire anemometer, as illustrated in Figure 5. The average velocities were measured in the central cross section, situated in front of the wind tunnel test area, with the anemometer positioned in the aforementioned location. z inicial = 6 cm above the tunnel floor, to a position z final =156 cm, with dz=10 cm. A total of 16 points were taken in the z-direction at a constant x-position. (x= 91 cm). The test velocity ( U ref =10 m/s) was obtained by setting the fan at 350 rpm and 28° angle of attack. Each measurement point was recorded for one minute, with a waiting period of 50 seconds to allow the fluctuating velocity signal to stabilise. The acquisition time for each point was 10 seconds at a sampling frequency of 100 Hz. The results of the velocity profile for each exposure category and its fit to the potential law are presented in the results section 18.
Results and Discussion
The results of the analysis were evaluated by comparing the data obtained in the wind tunnel with the NSR-10 wind profiles for the three exposure scenarios (urban, suburban, and rural) previously mentioned. Comparative graphs were created to assess the experimental outcomes.
Figures 6-8 illustrate the dimensionless approach flow profiles in the cross section upstream of the wind tunnel test platform, as measured with the hot-wire anemometer of the velocity scanner. The wind characteristics in the test section were described by the potential law model, and accordingly, the experimental data for Exposure B (Figure 6), Exposure C (Figure 7) and Exposure D (Figure 8) were fitted. It was determined that the variation of mean wind speed with height was generated with a power law index 𝛼 of 0.213 in the Urban category, 0.146 in the Suburban category and 0.11 in the Rural category. As can be observed, the addition of any mixing element or device resulted in an increase in the motion deficit in the boundary layer development section of the wind tunnel. In the experimental setup, it was found that the location of the castellated barrier was the device that generated the greatest growth of the boundary layer thickness upon reaching the test section. This resulted in the generation of much more uniform experimental profiles, especially in the lower zone of the velocity profile.
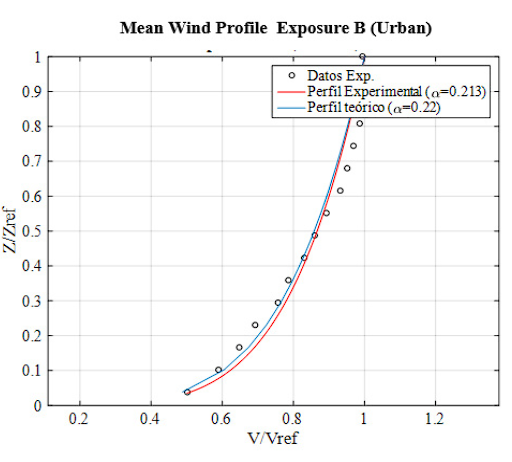
Figure 6 Fitting of the experimental mean velocity profile to the Potential Law for Exposure category B (Table B.6.5-2, NSR-10).
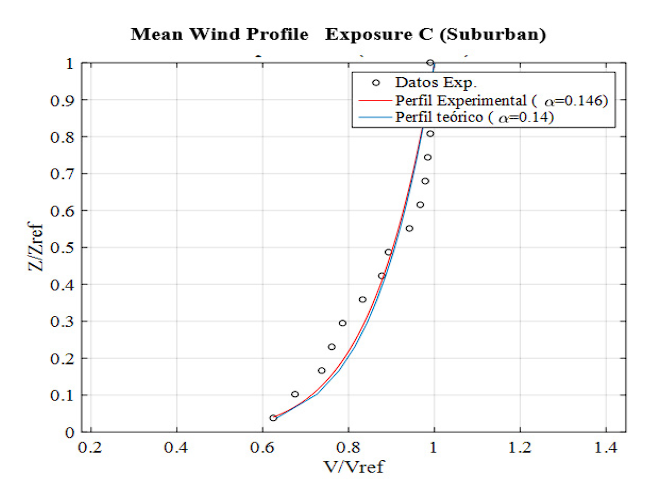
Figure 7 Fitting of the experimental mean velocity profile to the Potential Law for Exposure category C (Table B.6.5-2, NSR-10).
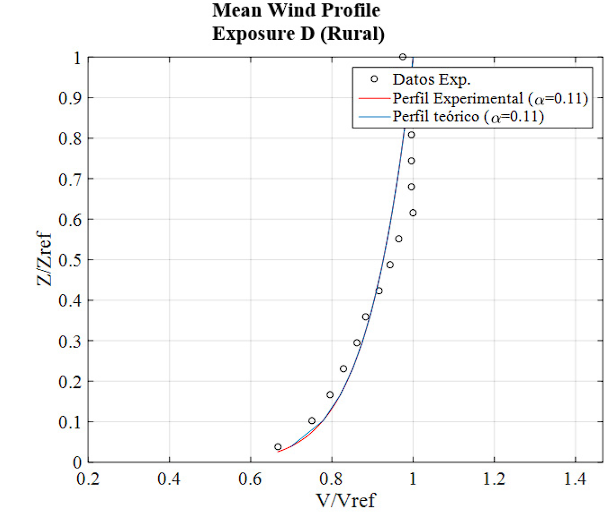
Figure 8 Fitting of the experimental mean velocity profile to the Potential Law for Exposure category D (Table B.6.5-2, NSR-10).
Similarly, it can be observed that the three profiles exhibit considerable homogeneity in a transverse direction. The profile of exposure B, in particular, demonstrated a high degree of alignment between the theoretical and experimental profiles, with a fit of nearly 94.3%. In comparison, the profiles of exposure C and D exhibited slightly lower fits of 88.7% and 71.3%, respectively. With regard to the value of the exponent 𝛼 , these values exhibit a satisfactory correspondence with the reference values specified in the design code 8. The fit of the potential function is high throughout its height, particularly in the lower part of the velocity profile for the three types of exposure. With regard to the values of the exponents obtained, the one with the highest correspondence with the theoretical exponent is that of Exposure D, followed by Exposure B with a difference of 3.8% with respect to the theoretical value, and the one with the least correspondence is that of Exposure C with a difference of 4.3%.
The configurations of the mixing devices employed for the three exposure categories exhibited a direct proportionality in their qualitative characteristics to the type of terrain to be simulated. For instance, the largest number of elements and the highest spatial density were observed in the test section with exposure B, which is typical of urban terrain. This terrain is characterised by a large number of obstacles, such as buildings, topography of the terrain or other friction-generating elements, which allow velocities to be reduced due to the effects of turbulence. In contrast, exposure D employs a smaller number of elements for its reproduction, which is characteristic of rural or flat terrain. The elements are distributed more diffusely across the test section, where the source of turbulence is comparatively less pronounced than in the preceding exposures.
Conclusions
The contour plot in Figure 3, which depicts the empty tunnel, illustrates the uniformity of the wind flow in the center of the test section. This corroborates the laminar flow that is required for the boundary layer simulation inside the wind tunnel.
The development and growth of the wind speed profile along the wind tunnel demonstrate the dependence on the size and configuration of the turbulence-generating devices, specifically the castellated barrier. During the tests, the location of the barrier was of crucial importance in achieving the fit to the theoretical profiles of the NSR-10 design code. The tests carried out in the Boundary Layer Wind Tunnel of the Universidad del Valle successfully simulated the mean velocity profiles described in the design code, using different passive turbulence-generating devices inside the tunnel, demonstrating a good correspondence between the theoretical and experimental profiles.


