Cereal cultivation is an ancient activity in the Algerian agricultural environment, practiced in all regions, including the Saharan zone, with a predominance of durum wheat cultivation (Chourghal et al. 2023). Durum wheat (Triticum durum Desf.) is an important cereal species and is cultivated worldwide over almost 17 million hectares (Xynias et al. 2020). It is a central crop grown in Algeria, and its production is based on the adoption of modern varieties derived from plant material from CIMMYT (the International Center for the Improvement of Maize and Wheat), ICARDA (the International Center for Agricultural Research in the Dry Areas), and traditional cultivars derived from local heritage varieties. Though durum wheat production covers only 24 to 55% of the country's annual consumption (ITGC 2022; Djoudi et al. 2024), it is insufficient to meet the country's needs, estimated at 8.5 million metric tons per year (Hannachi and Fellahi 2023). This low production is often explained by unpredictable weather, long dry seasons, inconsistent rainfall, and soils that are poor in nutrients, which especially characterize the semi-arid regions (Krishnamurthy et al. 2011). Thus, Hussain et al. (2019) stated that several abiotic stresses, such as drought, chilling, high temperature, and salinity, are strongly affecting plant growth, development, and yield. Indeed, drought is one of the most important abiotic factors that reduces yield under rainfed conditions. Durum wheat varieties grown in a dry area must be able to tolerate water and thermal stress to improve their grain yield potential (Mekaoussi et al. 2021). According to Bendjama and Ramdani (2021), water stress is the main constraint, reducing yield and potential production. Mamrutha et al. (2022) mentioned drought as one of the critical factors that reduce wheat yield at the worldwide level. It can occur at each stage of plant growth and induce a series of morphological, physiological, biochemical, and molecular changes in plants (Bendada 2021). Drought also negatively affects relative water content, gas exchange, and chlorophyll content (Othmani et al. 2021). They also observed that drought stress reduced stomatal conductance, which results in increased leaf temperature by limiting transpiration (Melandri et al. 2020). Further, Bali and Sidhu (2019) cited that relative leaf water content is the primary factor that decreased the growth of wheat in response to drought stress. Drought not only reduced water content but also chlorophyll content (Keyvan 2010). The stress effect depends on its degree, duration, and stage of development. During the early stages of growth, stress involves multiple morphological and physiological alterations during germination (Jian et al. 2016). While, during flowering and grain-filling periods, drought can decrease the number of fertile tillers, ear fertility, grain weight, and aboveground biomass (Pour-Aboughadareh et al. 2020). Improving grain yield has been a primary goal of most breeding programs. Then, developing drought-tolerant cultivars with high grain yields has been the principal goal of wheat breeders (Mohammadi et al. 2014; Mao et al. 2022). Various physiological traits, such as relative water content, electrolyte leakage, chlorophyll content, and canopy temperature, have been used to select desirable genotypes with high yield and stress tolerance. Likewise, the selection of genotypes using yield is assisted by morphological and physiological characteristics related to yield under drought conditions (González-Ribot et al. 2017). This research was conducted to assess the variability of 10 durum wheat genotypes in response to drought conditions based on agro-physiological traits and to select desirable genotypes under these conditions.
MATERIALS AND METHODS
Site, Plant materials and Experiment design
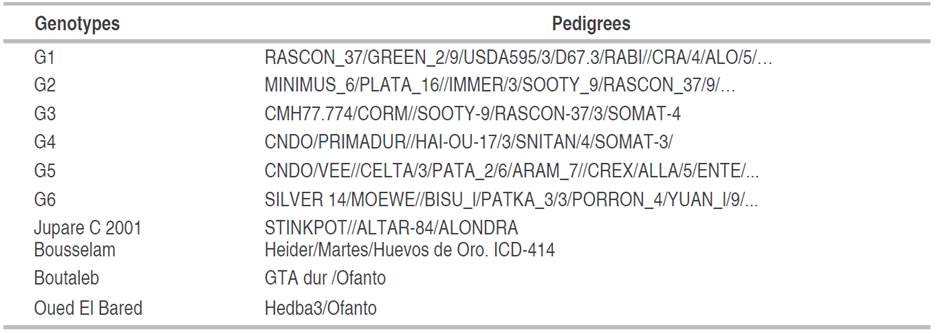
The experiment was carried out at the experimental site of the Technical Institute of Field Crops (ITGC) of Setif 36°09" N; 05°22" E; 981 meters above sea level (masl) during the 2021 to 2022 agricultural season. The experiment was set up on 14th December 2022, in a randomized complete block design (RCBD) with three replications. Each plot consisted of six lines 5 m long, spaced 0.2 m apart, which made up 6 m2 of plot dimension. The plant materials used consisted of ten durum wheat genotypes shown in (Table 1).
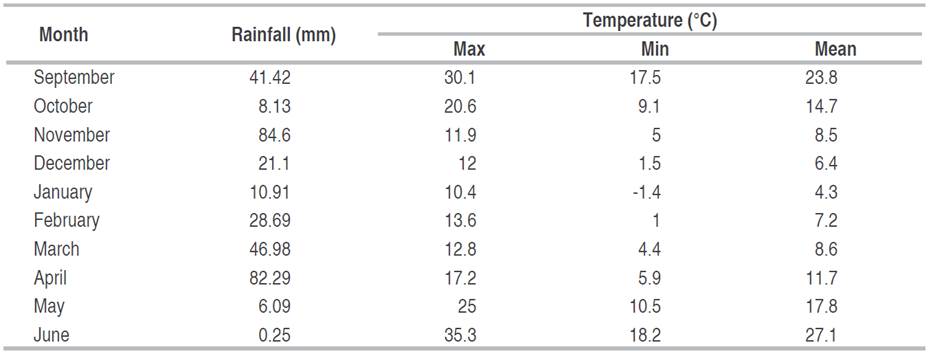
The soil is calcareous (Calcisol) with a silty clay texture, and organic matter content is 1.4% on the surface. The amount of monthly rainfall, temperature (min, max, mean) are presented in (Table 2).
Physiological traits
The chlorophyll content index (CCI) of each flag leaf was measured using a digital Chlorophyll Content Meter Model CCM-200 Plus. The relative water content (RWC) was determined at the heading stage according to Pask et al. (2012) method, five fresh leaves were weighted to record fresh mass (FM). The leaves were placed in distilled water for 24 h and weighed to get a turgid mass (TM). Samples were oven-dried at 65 °C for 24 h to record dry mass (DM). Relative water content was calculated as follows the equation 1.
The relative electrolyte leakage (REL%) of leaf tissues was measured using the method developed by Bajji et al. (2001), two leaves were collected, washed with tap water then with distilled water, and cut into 1 cm length segments. The samples were placed in tubes with 10 mL of distilled water and incubated for 24 h at room temperature in the laboratory. Subsequently, the first reading (EC1) was carried out. The final conductivity (EC2) was measured after placing tubes in a boiling water bath at 100 °C for 1 h.
The relative electrolyte leakage (REL%) was calculated as follows the equation 2.
The Canopy temperature (CT) measurements were taken on a sunny day using a portable infrared thermometer (Fluke Corporation. Everett.WA. USA). Readings were taken on sunny days between 11:00 to 14:00 hours.
Flag leaf area (FLA) was determined according to Spagnoletti-Zeuli and Qualset (1990). Five fresh leaves were collected, Leaf length (L) and wide (l) were measured and the area was calculated as follows the equation 3.
Agronomic traits
At maturity, data were collected on grain yield (GY) (t ha-1), thousand kernel weight (TKW, g), number of spikes per m2 (NSm-2, spike), and number of grains per spike (NGS, grain).
Statistical analysis
An analysis of variance was performed for a measured trait at the 5% probability level to test the differences among genotypes, and the linear correlations were done to study the different associations among variables using Costat software (6.400, 1998). A principal component analysis (PCA) was done using the R Core Team.
RESULTS AND DISCUSSION
Physiological variation among genotypes
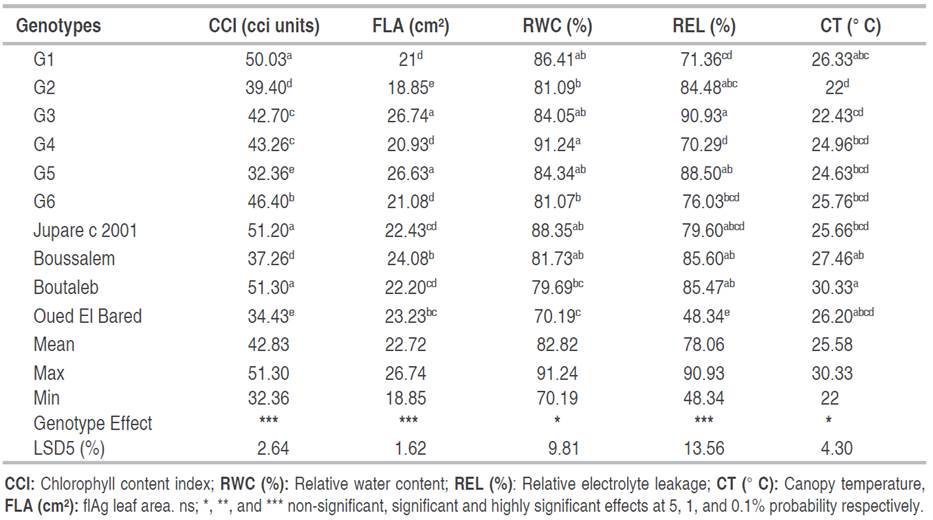
Crop yield is mainly dependent on the different biochemical and physiological traits of genotypes, as well as the impact of environmental conditions. The results of the variance analysis showed significant differences among genotypes tested for all physiological parameters (Table 3).
Table 3 Means values, maximum and minimum and statistical significance of physiological traits measured.
The differences between the physiological traits of genotypes depend on the distribution of genetics and environmental conditions.
The mean chlorophyll content index was significantly higher in variety Boutaleb (51.3 cci), while it was significantly the lowest in genotype G5 (32.6 cci) with an overall mean of 42.83 cci. Leaf chlorophyll content is a major indicator of the photosynthetic ability of plant tissues. It can directly regulate the photosynthetic rate and reflect photosynthetic potential and primary production (Liu et al. 2015). The change in chlorophyll contents is a useful indicator to evaluate the influence of environmental stress on plant growth and yield (Kohila and Gomathi 2018). Thus, several studies reported that the amount of chlorophyll in flag leaves was significantly affected by many environmental factors (Kaya et al. 2015; Atar et al. 2020). According to Yang et al. (2022), genotypes tolerant to various stresses display higher chlorophyll content and thus maintain stronger photosynthetic efficiency. It was also reported that stay-green bread genotypes have also shown higher grain yield and total biomass in field conditions (Del Pozo et al. 2016). Also, the study of Mansouri et al. (2018) proved that drought conditions accelerate chlorophyll degradation, reducing leaf area and photosynthesis; thus, genotypes that stay green with delayed senescence can improve their performance under drought conditions. Naveed et al. (2014) mentioned that wheat genotypes were negatively influenced by severe drought stress at several growth stages, which reduced CO2 assimilation, stomatal conductance, transpiration rate, and chlorophyll content and later inhibited grain yield at both tillering and flowering stages. Besides, the flag leaf area played an important role in improving the grain yield of wheat. The mean values were changed from 18.85 (G2) to 26.74 (G5), with an average of 22.74 cm². The flag leaf area is a very important metric for assessing crop growth and is closely related to above-ground biomass and yield (Singh et al. 2023). Larger flag leaf sizes tend to produce more grain per spike in wheat (Tshikunde et al. 2019) and barley (Alqudah and Thorsten 2015).Guendouz et al. (2016) stated that water stress greatly reduces leaf area; it may also decrease turgor pressure and cell expansion, which result in approximately the same dry mass being contained within a smaller leaf area thus raising density.
The minimum, maximum, and average values for relative water content were 70.19% (Oued El Bared), 91.24% (G4), and 82.82%, respectively. The relative water content of flag leaves is often used to assess the response of a plant to stress; it is a reliable index of leaf water deficit status at the time of sampling (Kohila and Gomathi 2018). Optimal plant water status is important for maintaining normal cell activity under water stress conditions (Mamrutha et al. 2022); thus, genotypes that maintain a higher relative water content, ensuring better hydration and more favorable internal water, showed better drought tolerance capacity (Kardile et al. 2018). In addition, the finding of Bayoumi et al. (2015) stated that wheat genotypes that maintained higher relative water content under stress conditions were supposed to be drought-tolerant and show high grain yield. Thus, Bali and Sidhu (2019) mentioned that reduced leaf water potential and relative water content about increased drought stress. Recently, Chaouachi et al. (2023) mentioned that under water stress, plant species lose water mostly through transpiration, and then they tend to control their stomatal closure. Indeed, plants that can maintain relative water content under water stress are the most resistant.
The main relative electrolyte leakage was significantly higher in G3 (90.93%), which was the sensitive one, though genotype variety Oued El Bared was the most susceptible one with the lowest value (48.34%). The measurement of electrolyte leakage was considered a typical criterion to assess membrane integrity in response to environmental stresses (Slama et al. 2018). According to Chowdhury et al. (2017), maintaining the integrity and stability of membranes under water stress is a major element of drought resistance in plants. Indeed, membrane protection ensures cellular structures remain intact, enabling plants to ensure their survival and productivity in various environmental conditions. Ramadan et al. (2022) stated that relative electrolyte leakage increased with increasing levels of water deficit. Cell membrane stability is considered a possible selection criterion for grain yield since it has a reasonable relationship with plant performance under stressed environments (Anzer et al. 2017). Similarly, the finding of Rehman et al. (2016) described that wheat genotypes with high cell membrane stability produced a high grain yield. According to the results of Slama et al. (2018), increased electrolyte leakage under stress conditions is attributed to the disturbance of cell membranes, which probably induces protein degradation.
The mean canopy temperature was significantly higher in both genotypes G2 and G3 with 22 and 22.43 °C, respectively while it was significantly the lowest in the variety Boutaleb (30.33 °C). Canopy temperature is an indirect measure of transpiration rate and stomatal conductance that may be useful in determining genotypic differences in drought response (Guendouz et al. 2021). This indicator is associated with plant water stress since the evaporative cooling involved in transpiration may cool leaves under ambient air temperature (Bazzaz et al. 2015). Wheat genotypes that have a cooler canopy during the heading stage and grain filling in the same environment can be an important indication of drought stress tolerance (Thapa et al. 2018). Canopy temperature was used by Singh et al. (2022) as an important screening criterion to identify potential heat-tolerant genotypes along with a heat susceptibility index based on grain below optimum and stress environments. Sohail et al. (2020) revealed that genotypes maintain a low canopy temperature under rainfall conditions due to their ability to extract water through a better root system and greater stomatal conductance. According to the results of Bazzaz et al. (2015), in water stress conditions, the foliar temperature of wheat genotypes increased due to an increase in breathing and a decrease in transpiration. Also, it was noticed that plants with a suitable supply of water maintained their canopy temperature below the air temperature, while plants with an insufficient supply of water showed a canopy temperature above the air temperature.
Agronomic traits for the assessed durum wheat genotypes
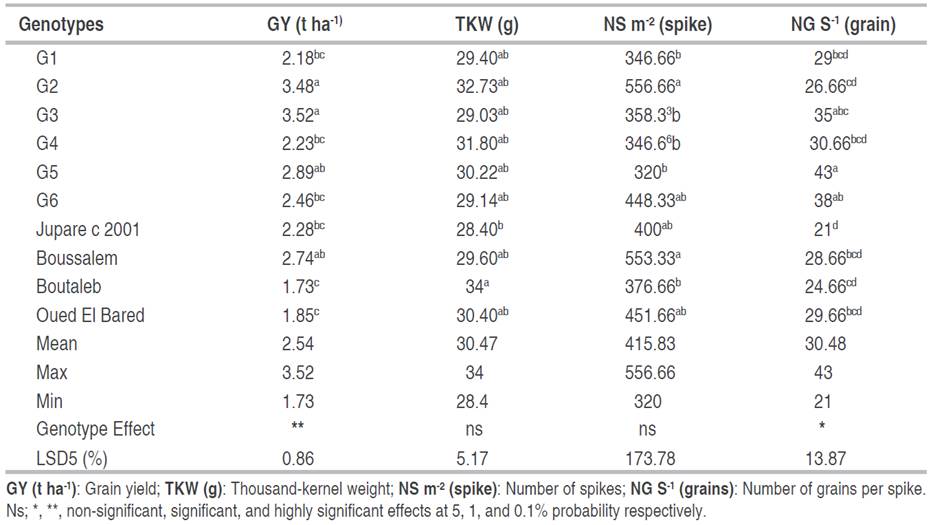
Numerous agronomic characters that have been widely explored in wheat improvement programs influence grain yield. The data presented in Table 4 shows the genotype effect was significant for grain yield and the number of spikes per m². The highest-yielding genotypes were G3, G2, and G5 (3.52, 3.48, and 2.89 t ha-1, respectively), with an overall mean of 2.54 t ha-1. For thousand kernel weight was significantly higher in Boutaleb, G2, and G4 (34, 32.72, and 31.8 g, respectively) though it was significantly lowest in genotype Jupare C 2001 (28.4 g). The number of spikes for the genotypes evaluated was recorded from 320 to 556.66 spikes per m²; the genotype G2 recorded the highest value, while the genotypes G1, G3, G4, and G5 exhibited the lowest values with 346. 66, 358.33, 346.66, and 320 spikes. The mean values for NG/S varied from 21 grains for the introduced genotype Jupare C 2001 to 43 grains for genotype G5, with a mean of 30.48 grains overall for all genotypes. Grain yield is a complex characteristic determined by three components: the number of spikes per area, grain number per spike, and grain weight. MajidiMehr et al. (2024) stated that water stress is a crucial environmental factor that decreases grain yield in bread wheat. Liu et al. (2015) proved that durum wheat genotypes were better adapted to water deficits and were able to maintain their grain numbers in unfavorable environments, which contributed to a smaller decrease in grain yield. Under stressful conditions in arid and semi-arid regions, the major purpose of wheat breeding programs is to develop durum wheat cultivars with high grain yields. It has been reported that wheat yield improvements are principally due to increases in grain weight and grain number per spike (Feng et al. 2018; Hu et al. 2022). Nouri et al. (2011) mentioned that the relative yield performance of genotypes in drought-stressed and favorable conditions helps to select the desirable genotypes. Hence, the development of high-yielding genotypes with acceptable stability and adaptability is a suitable method for improving durum wheat yield in drought conditions (Pour-Aboughadareh et al. 2020).
Correlation among assessed traits
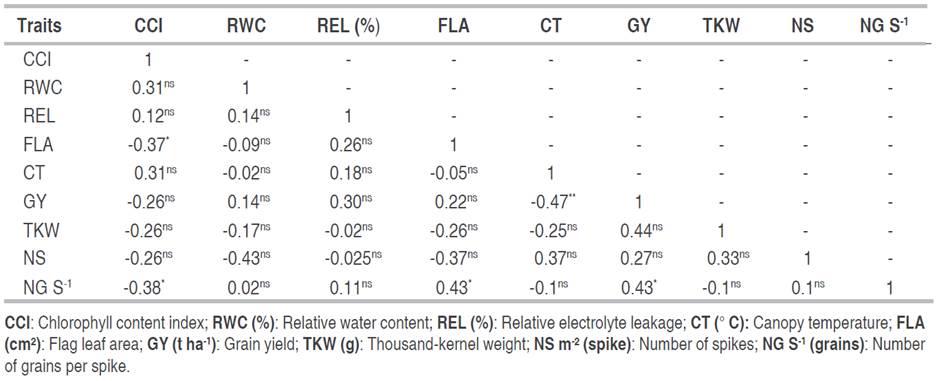
Table 5 shows the correlations between different traits and grain yield. Grain yield had positive and significant correlation with number of grains per spike (0.43*) and a non-significant association with number of spikes NS (0.27ns). Fellahi et al. (2019) supports this finding, and several researchers agree, suggesting that higher numbers of grains per spike and number of spikelets increase grain yield (Würschum et al. 2018; Wolde et al. 2019). The number of kernels per spike has been suggested as a useful trait for improving wheat grain yield, especially under drought conditions (Bogale and Tesfaye 2016). By contrast, the findings of Iqbal et al. (2017) revealed a non-significant relationship with these traits. Grain yield also had a significant positive correlation with thousand kernel weights (r=0.44 ns), while the study of Ullah et al. (2021) suggested a significant association between grain yield and thousand kernel weights. On the other hand, Boudersa et al. (2021) suggested that all yield components, such as grain weight, number of grains per spike, and biomass, have a considerable contribution to grain yield and that any direct or indirect disturbance affecting any of the yield components inevitably affects the grain yield. Hence, grain yield improvement has been significantly associated with increased thousand-kernel weight; it expresses the grain size and considerably enhances the final yield of wheat (Iqbal et al. 2015). Ullah et al. (2021) conclude that for bread wheat, increased grain weight directly contributed to improved grain yield. Canopy temperature showed significant negative relationships with grain yield; Singh et al. (2022) stated similar findings. Low canopy temperatures in durum wheat lines were associated with higher grain yields (Sohail et al. 2020). Furthermore, Oulmi et al. (2020) noticed that a high canopy temperature causes a decrease in grain yield. Chlorophyll content did not correlate significantly with grain yield while showing a negative correlation with the number of grains per spike (r=-0.38). Similar findings were reported by Mohammadi et al. (2018). The flag leaf area exhibited a significant relationship with the number of grains per spike (r=0.43*) and chlorophyll content (r=-0.37*). This result agrees with the findings of Nor et al. (2015), who found that leaf area showed a significant positive correlation with the number of grains per spike. Wang et al. (2022) also stated similar results and observed that wheat genotypes with a larger flag leaf tend to produce more kernels per spike.
Principal component analysis
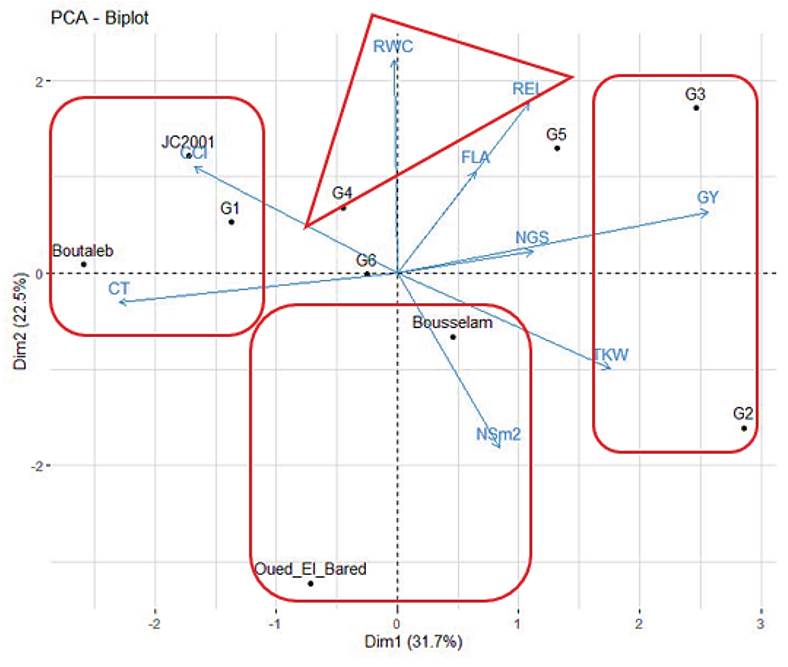
The principal component analysis (PCA), one of the methods of multivariate analysis, elucidates among a set of traits which ones are decisive in genotypic differentiation and selection (Ara et al. 2018). The data shown in Table 6 revealed that three components exhibited an eigenvalue near or higher than one. These three PCs accounted for 72.36% of the total variation. Furthermore, an increase in the number of PCs was correlated with a decrease in Eigenvalues. Based on the results shown in Figure 1, PC1 was highly correlated with grain yield and thousand kernel weights. genotypes G2 and G3 were positively correlated with PC1, suggesting that they had high productivity. While genotypes Jupare C 2001, Bouatleb, and G1 were negatively correlated with PC1, which was described as a low-yielding genotype, this result is in accordance with the previous results of Frih et al. (2021) and Guendouz et al. (2021), who stated that grain yield and thousand kernel weights were associated with the two first components. The second component was a physiological axis, with relative electrolyte leakage and relative water content as the major contributors. The genotype G4 was positively connected with this axis and consequently was classified as a drought-tolerant line. By contract varieties, Oued El Bared and Boussallem were negatively correlated with this axis, suggesting that they were the most susceptible to drought conditions. PC3 was negatively connected with flag leaf area; both genotypes G5 and G6 were negatively associated with this axis, which was characterized by a large flag leaf area.
CONCLUSION
Drought is one of the most important abiotic stresses that reduce grain yield in rainfed regions. This study allowed the evaluation of the different durum wheat genotypes based on their agro-physiological characteristics. The results obtained provide insights to facilitate the selection and cultivation of these genotypes under semi-arid conditions. An analysis of variance demonstrated a significant difference among genotypes for the majority of traits studied. The genotypes G2, G3, and G5 recorded the highest yield (3.52, 3.48, and 2.89 t ha-1, respectively) with a moderate water content and low values of temperature with G (22 °C), G3 (22.43 °C), and G3 (24.63 °C). Correlation among assed characters revealed that grain yield showed a positive and significant association with the number of grins per spike and a non-significant relationship with the number of spikes per m² and the thousand kernel weights. However, a non-significant association was found between all physiological traits. Moreover, the principal component analysis displayed three components. The first component related to GY and TKW genotypes associated with this axis exhibited high values of these traits. The second was the physiological axis; their genotypes were the most tolerant to semi-arid conditions. The results of the mean performance revealed that the genotypes Bousselam, G2, and G5 were the appropriate genotypes for growing under semi-arid conditions.


