


 English (pdf)
 Article in xml format
 Article references
 Send this article by e-mail
 Cited by SciELO
  Cited by Google
  Similars in
SciELO
Similars in
SciELO  Similars in Google
 Permalink
Introduction
Within the alcohol industry, beer is the most consumed drink globally 1,2. Over time, the brewing process has undergone various transformations until it reaches the industrial production process that we generally know today 1,3,4. The process of obtaining the beer consists of the malting stage of the fermentable source (barley grain, rice grain, among others), grinding and maceration, obtaining the wort, refrigeration, and fermentation 5. A solid and wet by-product is obtained during maceration, known as Brewer´s spent grain (BSG). BSG represents 85% of all solid by-products generated by beer production 4,6.
World beer production for 2018 reached ~1940x106 hectolitres (194x106 m3) 6, of which ~582x106 hectolitres (~30% of world production) were produced in the Americas 7. The countries with the highest beer production for 2020 were China (~341x106 hectolitres), the USA (~212x106 hectolitres), and Brazil (~152x106 hectolitres) 8. In Colombia, it is estimated that the annual production of beer is approximately 22x106 hectolitres 8, considering that for every 100 liters of beer obtained, 20 kg of BSG are produced 6, the amount of bagasse generated is a little over 440x103 Ton per year. These large volumes of by-products are becoming a growing environmental problem due to their unwillingness to discard them 4,6,7,9-11.
In recent years there has been growing scientific and political interest in the exploitation and valorization of residual biomass 12, such as BSG. It is partly due to the concept of circular bioeconomy has gained in the global economy 13,14. The circular bioeconomy consists of an environmentally and socially sustainable economy through biological resources production, use and reuse 15,16. Therefore, finding different alternatives for using residual biomass, such as BSG, is considered a current challenge for scientific research.
Searching for technological alternatives for the use of BSG has brought with it the development and application of different technologies, for example, a food supplement for farm animals based on BSG due to its rich protein content 17. Other studies have found that it can be used for energy production 18, obtaining biodiesel 19, and bioethanol 20. Other authors have investigated the use of BSG for various purposes, such as obtaining coenzymes, graphene for electrode production 21, activated carbons 22, and obtaining food products for human consumption 23, among others.
The BSG has a high moisture content (~70-73%) 19,24,25; this makes it challenging to handle and store. In addition, higher moisture favors the presence of microorganisms that degrade biomass making it difficult to reuse and practical application for the options mentioned above. In line with reusing the BSG, it must be made a pre-drying treatment to improve its handling and storage conditions. Various drying techniques have been employed, including infrared, freeze drying, convective hot air drying, and solar drying. Among these methods, convective drying is the widely utilized approach in industrial settings for mass production 26-30. During the development of a laboratory-scale production process, it is crucial to consider upscaling it for industrial applications. Therefore, gaining a comprehensive understanding of drying kinetics becomes paramount, with theoretical and semi-theoretical models playing a pivotal role in this regard.
Semi-theoretical models are typically derived by simplifying the general series of Fick's second law or modifying existing simplified models 31. Empirical and semi-theoretical models have the advantage of requiring less computational time and do not necessitate complex assumptions about the geometry, mass diffusivity, and conductivity of the specific food product 31. These models have been widely used for modeling the drying kinetics of agri-food products such as watermelon seeds, turnips, and coffee beans 26,29,32,33. In the literature, few kinetic studies of BSG drying are directed to find the best drying temperature and its influence on some characteristics such as water activity, intrinsic moisture of BSG drying, and the content of antioxidant compounds present in the extract obtained.
This work aimed to study a temperature range for the drying process of the BSG, favoring the operation time. For this purpose, drying kinetics were studied, and different kinetic models were applied to the experimental data to predict drying behavior. Fick’s second law of mass transfer was used to determine effective diffusivity and activation energy. The change in moisture ratio, water activity, and color of the BSG after drying at different temperatures was also evaluated. Finally, the influence of the drying temperature on the content of phenolic compounds and the antioxidant activity present in the extract obtained from BSG was evaluated.
2. Materials and Methods
2.1. Materials
Brewer´s spent grain (BSG) was supplied by a brewing company in the tatacoa desert (Huila, Colombia). The bagasse was frozen for storage and later use. Ethanol (70% v/v) and analytical grade sodium carbonate (Na2CO3) (LOBA Chemie, India) were used. Folin-Ciocalteu reagent, gallic acid, and the 1,1-diphenyl-2-picrylhydrazil (DPPH) free radical were purchased from PanReac ApliChem (Spain).
2.2. Drying assays
The drying process of the BSG was carried out on a convection oven (Memert UF 110, Memmert Universal, Schwabach, Germany) equipped with a temperature controller. The evaluated temperatures (50°C, 60°C, 70°C, 80°C, 90°C, and 105°C) were selected based on previous studies and practical considerations, aiming to cover a wide range of drying conditions commonly encountered in industrial and laboratory settings 26,29,33. The process consisted of weighing approximately 10 g of BSG in a Petri box, putting it into the oven, and drying it at the defined temperature. The variation in the sample weight was recorded at intervals; this procedure was repeated until constant weight, indicating that the equilibrium had been reached. The weight recorded up to equilibrium also allowed the sample to obtain moisture. Under the established conditions, it was assumed that the resistance to heat transfer within the particle and in the outer gaseous phase was negligible 33. The reported results corresponded to average values obtained from tests performed in triplicate at each temperature.
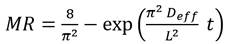
The moisture ratio was (MR) obtained by applying the following equation (Eq 1) 34:
 ()1
()1
where m t is the moisture content at time t, present in the BSG; m i is the initial moisture content of the sample, and m e is the moisture at the equilibrium over a long enough time to ensure constant weight. Four commonly used mathematical models were used to adjust the drying curve under isothermal conditions 31: Newton, Page, Logarithmic, and Midilli-Kucuk. The differences between the experimental and theoretical values given by each model were evaluated using the statistics of the adjusted coefficient of determination (R2 a), the standard deviation (SD), and the coefficient of variance (CV).
 ()2
()2
 ()3
()3
 ()4
()4
where N is the number of experimental data; p is the number of model parameters; R 2 is the coefficient of determination; MR exp is the experimental moisture data; MR mod is the theoretical moisture, and MR exp is the average of the experimental moisture data.
2.3. Determination of the effective diffusivity
The equation of the second law of Fick Eq (5) was used for effective diffusivity ( 𝐷 𝑒𝑓𝑓 ) determination. This equation describes the diffusion of water during the drying process, where the resistance to mass transfer that limits the drying speed is given by internal resistance, that is, the transfer of water from inside the BSG to the surface 35,36.
 ()5
()5
One of the analytical solutions of the second law of Fick for flat geometries, long drying periods and values of MR<0.6 is presented in Eq (6) 37.
 ()6
()6
where D eff is the effective diffusivity (m2/s), L is the characteristic length (m), and t is the drying time (s). Characteristic length L was determined using Eq. (7), considering the mass of the sample W, the density ρ, and the cross-sectional area of the sample A t .
 ()7
()7
It is known that effective diffusivity can commonly be determined by graphing the experimental data linearizing Eq. (6) as shown in Eq (8).
 ()8
()8
After plotting ln(MR) vs. t, the D eff value was obtained from the slope of equation Ec (8). For calculating the activation energy E o an expression of Arrhenius was used 19,34 Eq. (9), which relates effective diffusivity, temperature, and activation energy. Where D o is the pre-exponential factor; T is the absolute temperature; and R is the general constant of the gases.
 ()9
()9
2.4. Moisture and water activity.
For intrinsic moisture determination, approximately 0.5g of dry and ground BSG was weighed in a moisture balance ( Citizen MB-50 Moisture Analyser Balance, Japón). The water activity was determined in a water activity analyzer equipment (AquaLab PRE, USA), the sample was entered, and the value determined by the equipment was recorded. All measurements were made in triplicate for each BSG sample dried at the studied temperatures. The recorded value corresponds to the average value of the measurements.
2.5. Color
The color of the dry samples was measured using a tristimulus Minolta colorimeter (Konica-Minolta CR-10, Osaka, Japan) and reported in CIELab parameters (L*, a* and b* values), where L* was used to denote lightness, a* redness and greenness, and b* yellowness and blueness 38. The equipment was calibrated using a white plate as standard. BSG samples were placed on this white plate, and the values of the parameter’s "L", "a" and "b" were recorded. The total color difference (ΔE) was calculated using equation Eq (10).
 ()10
()10
2.6. Determination of the content of bioactive compounds
Samples (1 g) of BSG were placed in 15 mL test tubes and mixed with 6 mL of 70 %v/v ethanol. Then, the tubes were immersed in an ultrasound bath (BRANSON model 1800, Germany) with a rectangular chamber (longe:10 cm, hight:12 cm, depth: 12cm) equipped with an industrial transducer operating at 40 kHz. A flow system (in/out) controlled the water temperature from a heating bath (Memmert WNB14, Germany), maintaining a constant temperature of 60 °C for 10 minutes. The extracts obtained were filtered (Double ring qualitative filter paper, grade: EXP DRQLM) and centrifuged at 5300 m/s2 (4000 rpm) for 10 min. The extracts were suspended in water for all determinations at a dilution factor of 9. This test was carried out in triplicate for each dried BSG sample at the studied temperatures.
2.6.1. Estimation of total polyphenols content
The total polyphenols content (TPC) of BSG was determined by the Folin-Ciocalteu method 39. Briefly, 400 μL of each extract were mixed with 2 mL of 1:10 diluted Folin-Ciocalteu reagent. The mixtures were stirred for 30 s using a vortex mixer (Benchmark, USA), and then 160 μL of sodium carbonate (7% w/v) were added. After 30 min, the absorbance of the samples was measured at 760 nm using a spectrophotometer (X-ma 1200 Human Corporation, Loughborough, UK). Gallic acid was used as standard. The total polyphenols content was expressed as gallic acid equivalents (GAE) per gram of BSG.
2.6.2 Estimation of the DPPH•-scavenging activity
DPPH radical scavenging activity was tested as described Brand-Williams et al. (1995) 40. A volume of 100 μL of each obtained extract was mixed with 3,9 mL of an ethanolic solution of DPPH• (25 ppm). It was then vortexed for 30 s and kept in the dark for 30 min. Finally, the absorbance was measured at 517 nm using the spectrophotometer. Gallic acid was also used as standard, and the results were expressed as mg gallic acid per gram BSG (mg GAE/g BSG).
3.Results and discussions
3.1. Drying kinetics analysis
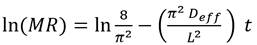
Figure 1 shows the drying curves of Brewer´s spent grain (BSG) obtained at the different studied temperatures (50°C, 60°C, 70°C, 80°C, 90°C, and 105°C). It was observed that when the temperature increases, the curve's slope becomes greater, indicating that the humidity of the BSG reaches equilibrium or reaches a specific moisture ratio in shorter times. The equilibrium time is defined as the moment when sample mass does not vary in time; according to this, for the dried sample at 105°C, the equilibrium time was reached at 60 min, while at 50 °C, the equilibrium time took 260 min, four times more than observed at 105 °C. Recent studies on the drying kinetics of biomass corroborate the influence of temperature on the drying process. For instance, Ghanem et. al. found that increasing the drying temperature from 50 to 70 °C reduced the drying time by 30 % 41. Similarly, another study reported that temperature is a critical factor for the drying kinetics of sawdust, affecting the drying process 42. Additionally, the literature suggests that the drying kinetics of biomass are affected by various parameters, including the type and size of biomass, airflow rate, and moisture ratio. For example, a study by 43 examined the drying kinetics of palm kernel shells and determined that airflow rate and particle size significantly affect the drying process. From these curves presented in Figure 1, it was also determined that the initial humidity of BSG was 71.7 % (±0.012). This moisture ratio aligns with others reported in the literature (37,44.
Figure 1. Drying curves of Brewer´s spent grain (BSG) using the different temperatures studied (experimental points)
The drying speed curves of BSG obtained at the different studied temperatures are shown in Figure 2. It was observed that as the temperature increased, the slope of the curve was higher, indicating an increase in the drying speed. Besides, at the beginning of the curve, the positive slope indicated a short period where the drying speed increased. This increase corresponded to the period when the temperature inside the oven raised, promoting the evaporation process of the water from the particles’ surface. It should be noted that this period became shorter as the temperature studied increased. Similar observation has been reported in previous studies on the effect of temperature on the drying rate of biomass 45. A progressive decay of the drying rate was observed because the moisture on the surface of the particles was completely evaporated, while the remaining water within the BSG matrix evaporated slower. This behavior indicated that the internal resistance limits the drying speed to mass transfer, that is the diffusion of moisture from inside the BSG to its surface. Similar drying mechanism have been observed in other studies (19, 31, 33, 37, 46). These findings were consistent whit other studies on the drying kinetics of bamboo sawdust reported, the drying rate augmented with increasing temperature, and the drying process can be divided into three stages: the initial increasing rate period, the constant rate period, and the falling rate period, which was consistent with the observations made in this (47, 48).
Figures 1 and 2 show that the drying speed was not constant in any of the conditions studied, probably because the thickness of the moisture layer, the "thin layer" on the surface, was not constant, preventing a continuous supply of moisture during the drying process. This behavior has also been observed in other studies (31, 46, 48).
The BSG drying curve was also evaluated using different masses; for this purpose, 105°C was used as the drying temperature because the process was performed faster. Figure S1 describes the drying curves at 105°C using different masses of BSG; it can be seen that the slope of the curve increased as the mass of BSG to be dried decreased. Also, the humidity to reach balance took 50, 60, and 80 min for 5g, 10g, and 15g, respectively. Therefore, the drying process took longer when there was more bagasse mass. This result corroborated that the internal resistance to mass transfer by the diffusion of moisture from the inside BSG particle to its surface was the limiting drying speed, as mentioned above, which is a common limiting factor in the drying kinetics of biomass. However, it is important to note that the drying kinetics of diverse types of biomasses may be influenced by various factors such as temperature, relative humidity, and particle size (30, 47, 48). Therefore, a comprehensive understanding of the drying behavior of each type of biomass is necessary to optimize the drying process for industrial applications.
3.2. Analysis of the effective diffusivity and of the activation energy of the drying process.
Assuming that the sample throughout the drying process presented a negligible shrinkage, uniform distribution, and a constant content of initial moisture throughout the BSG particle, one of Fick’s second law solutions was used to determine effective diffusivity. Figure S2 shows the graphs of Ln (moisture ratio (MR)) vs. t (min), using equation Eq (8) and using the slope of each line was determined the effective diffusivity in each temperature studied.
Table 1 shows the values of effective diffusivity at different temperatures. Since D eff was influenced by temperature, pressure, and molecular weight, the pressure, and molecular weight was assigned a constant value for this drying study. The increasing temperature and the effective diffusivity were greater because the higher the temperature increased the energy necessary for the water particles to begin the diffusion through the internal structure of the BSG (Table 1). D eff values in this analysis were in the order of magnitude found for other biomasses studies using BSG (33, 37). However, other recent studies have reported different results. For example, a study on the drying kinetics of corn stover reported that the effective diffusivity decreased with increasing temperature due to the formation of a crust layer on the biomass surface, which hindered moisture transfer (49, 50). These discrepancies highlight the importance of studying the specific characteristics of each type of biomass and the potential formation of crust layers during the drying process, as well as the need for further research to optimize drying conditions and reduce energy consumption in biomass drying processes.
Table 1 Effective diffusivity at different temperatures and constant pressure (101.325 kPa)
| Temperature (°C) | 50 | 60 | 70 | 80 | 90 | 105 |
| Effective diffusivity (m2/s) | 5.23x10⁻¹⁰ | 8.22x10⁻¹⁰ | 1.29x10-09 | 1.39x10-09 | 1.91x10-09 | 2.49x10-09 |
For the biomass drying process, such as BSG, the activation energy can be defined as the energy necessary for water particles to begin to diffuse through the solid structure of the BSG to the surface, and the drying process occurs (32, 51). For Activation Energy determination Eo (kJ/mol), the Deff values recorded at the different temperatures were used; for this purpose, the Ln (Deff) vs. 1/T was plotted (Figure S3). The results showed Eo values of around 28.05 kJ/mol. The pre-exponential coefficient D o with a value of 2.04x10⁻⁵ m2/s was also determined. Activation energy has been widely used to analyze the drying kinetics of various types of biomasses, such as stevia leaves 52, tea 53, fructus aurantii (dried fruit of Citrus aurantium L.) 54, pomegranate arils 55, wood 56. These studies have reported activation energy values ranging from 13.5 kJ/mol for tea to 41.5 kJ/mol for wood, indicating that different types of biomasses have different activation energies due to variations in their internal structure and composition. In contrast, the Eo value obtained in this study for BSG was 28.05 kJ/mol, which is relatively low compared to other biomass studies. This difference in Eo values between BSG and other biomass is due to the unique structure and composition of BSG.
3.3. Analysis of the kinetic models
For kinetics analysis, four mathematical models were used to fit the experimental data: the model of Newton, Page, Logarithmic, and Midilli-Kucuk. With these models, it was desired to obtain the most suitable equation to estimate the moisture ratio (MR) of bagasse drying at different temperatures. Kinetic models are represented by the following Eq. (11-14):
Newton model (11)
(11)
Page model (12)
(12)
Logarithmic model (13)
(13)
Midilli-Kucuk model  (14)
(14)
where K is the kinetic constant of each model, n is a power constant, a and b are parameters of the corresponding equation.
Figures 3 and 4 show the different models adjusted to the experimental data to facilitate the graphical analysis. The figures were grouped between the best-adjusted models (Figure 3) and those with more significant deviation (Figure 4).
Figure 3 shows the kinetic models that best fit the experimental data, the Page and Midilli-Kucuk models. In part, this is because the Midilli-Kucuk model contains a greater number of parameters with respect to the Page model; it was found that an equation with two parameters allows to adequately describe the drying kinetics of the BSG, in addition to being used to estimate the moisture ratio. Figure 4 shows the two kinetic models that had greater deviation when adjusting to the experimental data, Newton and the Logarithmic; observing that despite not adjusting as well as the Page and Midilli-Kucuk models, they could be used cautiously to have an estimated value of moisture during the drying process.
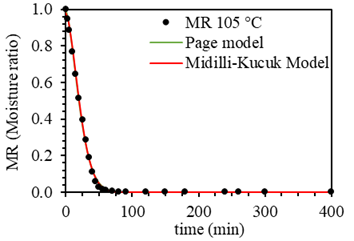
Figure 3 Page and Midilli-Kucuk kinetic models adjusted to experimental drying curve data at different temperatures (50 °C, 60 °C, 70 °C, 80 °C, 90 °C, and 105 °C).
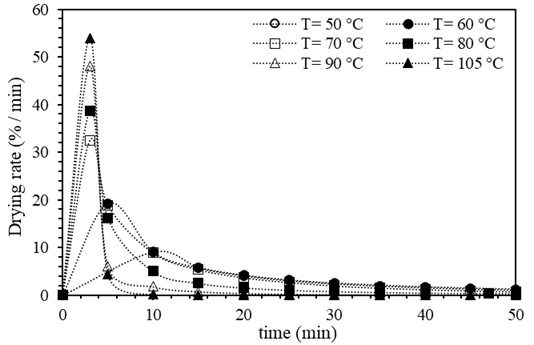

Figure 4 Newton and logarithmic kinetic models adjusted to experimental drying curve data at different temperatures (50 °C, 60 °C, 70 °C, 80 °C, 90 °C, and 105 °C).
Table 2 presents the parameters of the different kinetic models adjusted to the experimental data. All parameter values from the kinetic models used are in the order of those found in the literature (29, 33, 51). The Page model was the one that best fit the experimental data; this can be deduced because this model obtained the values of R 2 higher, lower SD, lower CV, and better graphic fit (Figure 3, Table 2). This model contains relevant information to drying kinetics from the two parameters that fit the Page equation. The kinetic constant K and n grew slightly as the drying temperature increased. The growth of K was in line with the above results; as the temperature increased, the slope became larger. From the above, we concluded that a kinetic model with two parameters was sufficient to describe the drying kinetics of BSG adequately. The Page model allowed to have a robust model for predicting the drying kinetics of the precursor without the need to use a more complex equation using a greater number of parameters.
Table 2 Kinetics models parameters
| Model | Temperature | Parameters | Statistics | |||||
|---|---|---|---|---|---|---|---|---|
| (°C) | a | B | n | K (s n ) | r 2 | SD | CV | |
| Newton | 50 | - | - | - | 0.0094 | 0.9897 | 0.038 | 0.085 |
| 60 | - | - | - | 0.0137 | 0.9791 | 0.050 | 0.110 | |
| 70 | - | - | - | 0.0201 | 0.9724 | 0.055 | 0.112 | |
| 80 | - | - | - | 0.0229 | 0.9710 | 0.060 | 0.142 | |
| 90 | - | - | - | 0.0229 | 0.8964 | 0.108 | 0.344 | |
| 105 | - | - | - | 0.0229 | 0.7347 | 0.065 | 0.222 | |
| Page | 50 | - | - | 1.2024 | 0.0038 | 0.9968 | 0.021 | 0.046 |
| 60 | - | - | 1.3462 | 0.0033 | 0.9976 | 0.016 | 0.036 | |
| 70 | - | - | 1.3870 | 0.0046 | 0.9985 | 0.012 | 0.025 | |
| 80 | - | - | 1.4586 | 0.0042 | 0.9983 | 0.014 | 0.033 | |
| 90 | - | - | 1.5158 | 0.0049 | 0.9978 | 0.015 | 0.048 | |
| 105 | - | - | 1.5728 | 0.0063 | 0.9975 | 0.017 | 0.057 | |
| Logarítmico | 50 | 1.00E-03 | 1.1000 | - | 0.0150 | 0.9281 | 0.095 | 0.213 |
| 60 | 3.00E-07 | 1.0687 | - | 0.0150 | 0.9838 | 0.042 | 0.092 | |
| 70 | 6.00E-07 | 1.0721 | - | 0.0219 | 0.9792 | 0.045 | 0.091 | |
| 80 | 3.00E-07 | 1.0863 | - | 0.0252 | 0.9774 | 0.048 | 0.114 | |
| 90 | 6.00E-07 | 1.0863 | - | 0.0252 | 0.8906 | 0.102 | 0.326 | |
| 105 | 5.00E-07 | 1.0863 | - | 0.0252 | 0.6951 | 0.056 | 0.190 | |
| Midilli-Kucuk | 50 | 0.9583 | 0.00E+00 | 1.3223 | 0.0021 | 0.9976 | 0.016 | 0.036 |
| 60 | 1.0691 | 5.00E-07 | 1.0246 | 0.0137 | 0.9847 | 0.039 | 0.087 | |
| 70 | 0.9863 | 6.00E-07 | 1.4262 | 0.0039 | 0.9985 | 0.011 | 0.023 | |
| 80 | 0.9934 | 6.00E-06 | 1.5006 | 0.0037 | 0.9990 | 0.010 | 0.023 | |
| 90 | 0.9786 | 4.00E-07 | 1.5753 | 0.0039 | 0.9978 | 0.014 | 0.044 | |
| 105 | 0.9711 | 5.00E-07 | 1.6678 | 0.0044 | 0.9979 | 0.014 | 0.048 | |
Figure S4 shows the kinetic models adjusted to the drying curves at a temperature of 105 °C using different masses of BSG. The parameters of the kinetic models were reported in Table S1. From Figure S4 and Table S1, the Page and Midilli-Kucuk models presented the best adjustments to the experimental data. In contrast, the Newton and Logarithmic models presented the greatest deviation. This behavior was similar to those illustrated in Figures 3 and 4.
3.4. Analysis of moisture and water activity
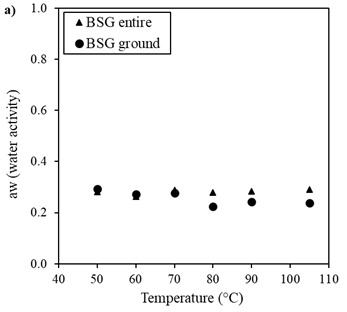
The effect of drying temperature on moisture content, water activity, and color of BSG after drying was analyzed. In addition, it was explored whether the BSG milling process affected the characteristics mentioned above after the drying process. These characteristics were compared in dry and whole BSG with dry and ground BSG.
Figure 5 shows the behavior of the water activity (aw) and the moisture of BSG as a function of the drying temperature. It was observed that the moisture and the water activity of BSG did not vary significantly, regardless of the temperature used in the drying. Besides, the whole and ground BSG samples showed moisture values of around 4.8% (±1.614) and 4.0% (±0.366), respectively, while similar aw values were obtained for both samples (aw (0.26-0.28) (Figure 5a). This result is an advantage from an application point of view since a material with low water activity and low moisture could stay longer in storage without affecting its shelf life, reducing the deterioration risk of BSG.
3.5. Color
Figure S5 shows images of the whole and ground BSG samples, while the corresponding ΔE values are shown in Table S2. It was observed that the different temperatures studied did not cause significant changes in the appearance of the samples nor in their color attributes. This behavior was probably due to the relatively low temperatures used, which were insufficient to alter the pigments present in both whole and ground BSG. Some studies reported that high drying temperatures can lead to a decrease in brightness and chroma of biomass samples, indicating a color change (53, 54, 57, 58). Therefore, it could be suggested that the effect of drying temperature on color stability varies depending on the specific type of biomass and the drying conditions used.
3.6. Analysis of the total phenolic content and DPPH radical scavenging activity
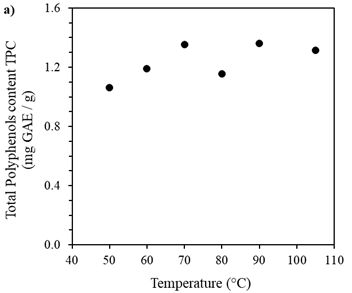
Figure 6 shows the behavior of the total polyphenol content and the DPPH radical scavenging activity of the BSG samples as a function of drying temperature.
The different drying temperature studied did not significantly influence the TPC (Figure 6a) or the DPPH radical scavenging activity (Figure 6b). The average phenolic content and DPPH scavenging activity were 1.27±0.120 mg GAE/g BSG and 0.21±0.015 mg GAE/g BSG, respectively. Yan et al. reported that the drying temperature had an impact on TPC and DPPH radical scavenging activity in both hot-air-dried and sunlight-dried orange black tea. Specifically, an increase in the drying temperature of orange black tea led to a decrease in TPC and antioxidant activity of the extract, with a more pronounced effect when hot-air was used as the drying method 53. Conversely, a previous study on microwave drying of lemon peel demonstrated an increased TPC when the applied power was augmented. This behavior was attributed to the generation of high vapor pressure and temperature inside the plant tissue caused by the intense heat produced by microwaves, leading to the disruption of plant cell wall polymers. As a result, bound or cell wall phenolics may be released, potentially resulting in an increased extraction of phenolic compounds 41.
4.Conclusions
Drying kinetics of Brewer´s spent grain at different temperatures (50 °C, 60 °C, 70 °C, 80 °C, 90 °C, and 105 °C), and the effect of the drying temperature on the physical properties and the content of bioactive compounds were studied. It was observed that the internal diffusion of moisture limited the drying speed; the internal resistance is the governing mechanism for moisture transfer. The effective diffusivity values determined ranged from 5.23x10⁻¹⁰ (m2/s) to 2.49x10-09 (m2/s), and the activation energy value was 28.05 kJ/mol. The Page and Midilli-Kucuk models showed the best fit for the experimental data. In particular, a kinetic model with two parameters, such as the Page model, was sufficient to adequately describe the drying kinetics of BSG without the need to use a more complex equation using a greater number of parameters. Regardless of the drying temperature, the obtained BSG presented a low water activity and low intrinsic humidity that favors, in principle, greater storage and conservation times. It could be observed that the total phenolic content of 1.27 (±0.120) mg EAG/g BSG and DPPH radical scavenging activity 0.21 (±0.015) mg EAG/g BSG, present in the extract obtained from BSG, was not affected by temperature variation in the studied range. Therefore, phenolic compounds have antioxidant properties and can be used as animal food supplements. From an operational point of view, it is possible to conclude that the most suitable temperature for the drying process of BSG was 105 °C since it allowed shorter drying times. The latter would result in lower energy and operating costs. Studies are recommended to extract polyphenols utilizing Ultrasound-assisted extraction (UAE) on a larger scale (pilot or industrial) to determine the feasibility of reusing BSG as a source of antioxidant substances by evaluating economic aspects, energy, and operations.

