


 English (pdf)
 Article in xml format
 Article references
 Send this article by e-mail
 Cited by SciELO
  Cited by Google
  Similars in
SciELO
Similars in
SciELO  Similars in Google
 Permalink
Introduction
The Highway Safety Manual (HSM) provides a predictive method and analytical procedures to support road projects in various phases, including planning, preliminary design, final design, and construction 1. The HSM procedure aids in identifying locations with a potential for reducing crashes or their severity, diagnosing issues, selecting countermeasures, conducting economic appraisals, prioritizing projects, and evaluating safety effectiveness 2. The HSM primarily describes the predictive method and crash modification factors (CMF). The predictive model includes the safety performance functions (SPFs) used to forecast crash counts at different roadway elements 3. These SPFs should be adjusted to local conditions for optimal results 4. Calibration is essential because the overall crash frequencies can vary significantly from one location to another due to various factors, such as crash reporting thresholds and crash reporting system procedures 1. To adapt the predictive model or SPF to local conditions, there are two options: calibrating the SPF or developing a new one.
The choice between calibration and development depends on the resources available to the institution and its objectives. The FHWA (Federal Highway Administration) issued report FHWA-SA-14-004, which evaluates these two options 5. Calibration maintains the structure of the original equations, allowing to compare the results across different areas. On the other hand, during development, the equations are more likely to change, leading to differences in the comparisons. SPF calibration can be achieved by either calculating the calibration factor or estimating the calibration function.
The calibration factor procedure involves adjusting the original model proposed by the HSM to fit the local conditions. The calibration factor is calculated as the ratio of the total number of observed crashes to the total number of predicted crashes. At times, the model may either overpredict or underpredict the number of accidents. For instance, in Ecuador, the calibration factor for two-lane rural roads was reported to range between 0,12 and 0,25 6. In this case, the model overpredicted the crash frequency. Here, it is important to note that rural roads are typically susceptible to more severe accidents due to topographical limitations. Similar studies have been conducted in numerous countries and for various types of roads.
Other works have concentrated on the calibration of SPFs, which are models used to predict the number of crashes. In the HSM, SPFs are negative binomial regression models that establish a log-linear relationship between crash frequency and various site characteristics 7. These models invariably include traffic volume (AADT) and can also incorporate site-specific factors such as section length and lane width, among others. It is important to note that the calibration of SPFs should be conducted separately for different crash types 8 rather than combining all crash types into one model. Models specific to crash types tend to provide a better fit in comparison with using a single model that estimates the total crashes together with the overall proportion of each crash type 9.
There is a substantial amount of research worldwide that involves calibrating SPFs for two- lane rural roads. For instance, the original HSM model consistently underpredicts crashes on two-lane rural roads in Utah 10 and Illinois 4. In Pennsylvania, the findings suggest significant variations in safety performance across engineering districts, a factor that should be considered by other state transportation agencies 11. Similar results have been identified in research conducted in Virginia 12, Oregon, and Georgia 13. The performance of SPFs may also differ depending on the type of pavement, as indicated by results obtained in Michigan 14. Additionally, in flat terrain in Spain, the HSM model exhibits both underprediction and overprediction tendencies in response to variations in AADT 15. Note that it is necessary to adjust SPF models to local conditions in order to achieve more accurate results. These equations are widely used worldwide because they are fundamental for road safety analysis. However, in Ecuador, there has been limited progress on this issue. Hence, the primary objective of this study is to calibrate SPFs for two-lane rural highways in the mountainous regions of Ecuador, considering various types of accidents and different traffic volume ranges. 25 roads in the Andes mountains were selected for evaluation, totaling approximately 630 km in length. Geometric and operational data were collected for each of these roads and compared to recorded road crashes.
To present this calibration, this document is structured as follows. Firstly, it describes the predictive model of the HSM. Secondly, it provides detailed information on the materials and methods employed, including an analysis of the data collection process, calibration procedure, and validation phase. Subsequently, it presents the results obtained from the models and an analysis of prediction errors. Finally, the document highlights the main findings and conclusions.
Safety performance functions
El HSM 1 states that, for rural two-lane and two-way roadway segments, the predictive model
takes the form of Eq. (1).

Where:
N predicted: predicted average crash frequency for an individual roadway segment and a specific year (crashes/year)
N spf-rs: predicted average crash frequency under base conditions for an individual roadway segment (crashes/year)
C r : calibration factor for roadway segments of a specific type developed for a particular jurisdiction or geographical area (dimensionless)
CMF 1r . . . CMF 12r : crash modification factors for rural two-lane, two-way roadway segments
Eq. (1) in the model predicts either the total average crash frequency or that of specific crash severity or collision types. This model addresses the regression-to-the-mean bias by focusing on the long-term expected average crash frequency, rather than relying solely on the short-term observed crash frequency 1. To account for variations in segment characteristics when compared to base conditions, Crash Modification Factors (CMFs) are employed with the aim of adjusting the number of crashes. While the HSM provides these CMFs, there is also a website known as the Crash Modification Factors Clearinghouse16, which compiles CMFs from various studies, categorized by country or region. In Eq. (1), the model incorporates the safety performance function, the expression of which can be found in Eq. (2).

Where:
N spf-rs: predicted average crash frequency for base conditions using a statistical regression model (crashes/year)
AADT: average annual daily traffic (vehicles per day)
L: length of the road segment (miles)
Eq. (2) is based on a negative binomial distribution, which is better suited for modeling the high natural variability of crash data compared to traditional modeling techniques 1. Moreover, this equation involves only two variables, i.e., the average annual daily traffic and the segment length, making it easier to calibrate the model in comparison to other SPFs with more variables. The SPF results can be calculated with a high level of accuracy even when there are only 1-3 years of recorded crashes for the studied site 17. SPFs are developed using statistical multiple regression techniques, employing historical crash data collected over several years at sites with similar characteristics and encompassing a wide range of AADT values 1. These SPFs provide estimates for the average number of crashes when the segments meet the base conditions outlined in Table I. When a segment does not meet the base conditions, it should be adjusted using the CMFs proposed by the HSM model.
Table I Base conditions for roadway segments on rural two-lane, two-way roads
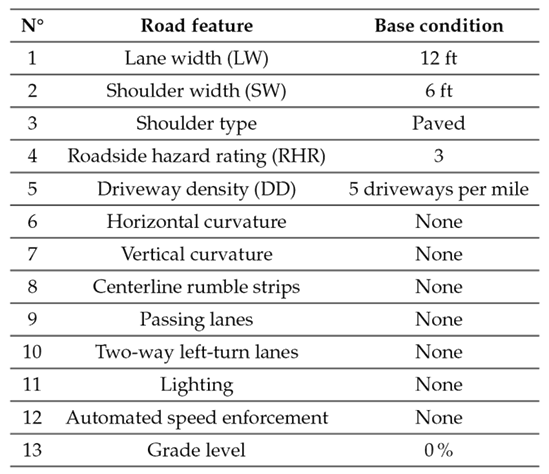
Source: Highway Safety Manual (1).
The base conditions shown in Table I may not necessarily be directly applicable or valid in the context of Ecuador. The suitability of these factors for calibration in the country would depend on several factors, namely.
Local conditions: Ecuador has different road infrastructures, traffic patterns, and environmental factors in comparison with the United States. Therefore, the relevance and impact of these factors on road safety could vary.
Regulatory and design standards: Ecuador has its own set of design standards, regulations, and guidelines for road construction and safety. However, its standards are similar to those of the United States.
Data availability: The availability and quality of data related to these factors may vary between countries. Ecuador lacks some comprehensive data on certain factors, which affects the calibration process.
Geographical and environmental differences: Ecuador’s diverse geography, including mountainous regions, coastal areas, and urban centers, may pose unique challenges and considerations not found in the United States. In this context, it is essential to conduct a thorough assessment and potentially adapt the factors used for SPF calibration to align with the specific conditions and requirements of Ecuador
Materials and methods
To calibrate SPFs, it is essential to gather data on the AADT, the length of the segment, and the number of crashes recorded in it. This section provides an overview of the materials and methods employed for data collection and processing. Additionally, it outlines the procedures for calibrating and validating the models.
Segment selection
Initially, 25 two-lane roads were selected, with lengths ranging from 7,4 to 40 miles, as indicated in Table II. The AADT values, calculated or measured in 2017, have been included in this table. It is worth noting that the AADT estimation process was primarily carried out by students participating in the Road Projects course at Universidad Técnica Particular de Loja, along with the OSEVI-UTPL traffic counter 18.
Table II Selected two-lane rural roads in this study
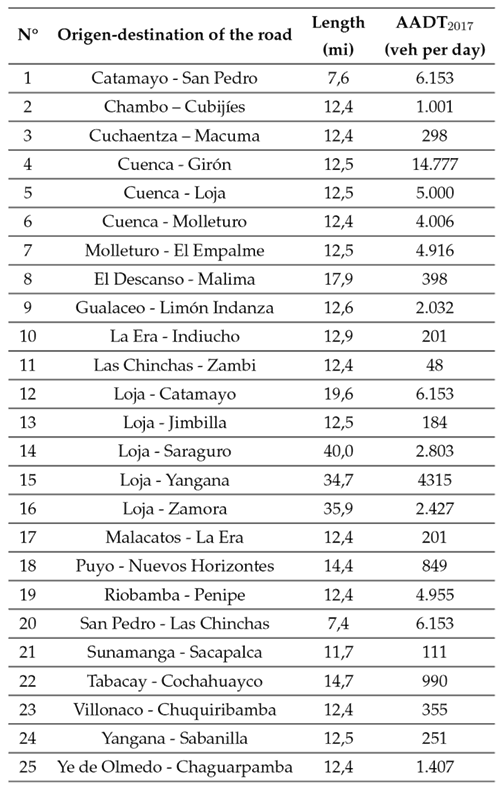
Source: Master’s students of the Road Projects course at Universidad Técnica Particular de Loja and the OSEVI-UTPL traffic counter 18
The features of every road listed in Table II were analyzed. These roads have a width between 11 and 12 ft, which is similar to the base condition. Additionally, these roads have a shoulder width between 2 and 4 ft, which is less than the base condition. However, it is important to note that these roads were constructed using older standards, where the shoulder width was narrower. The entire shoulder is paved, in accordance with national guidelines and base conditions. The roadside hazard rating (RHR) ranged between 3 and 7, as these are mountain roads. It is common for Ecuadorian mountain roads to have this level of risk, and it can be challenging to find RHR values equal to 3, which is the base condition. The driveway density was less than 5 driveways per mile, which is also common in mountain roads. Despite these differences, the remaining road features were consistent with the base conditions. Even though it may not be possible to meet all base conditions, efforts were made to align with the majority of them.
Crash data
Crash data were sourced from the National Transport Agency of Ecuador’s website 19. For each segment listed in Table II, three types of data were collected: total crashes (T), fatal and injury crashes (FI), and property damage only (PDO). It is important to note that these data were not directly available on the website and had to be estimated based on the causes of the accidents. The HSM recommends certain guidelines for data collection. It suggests a minimum sample size of 30-50 sites, with the entire group of calibration sites representing at least 100 crashes per year. It may take one to three years to accumulate a sufficient number of crash events to meet these crash frequency criteria 1.
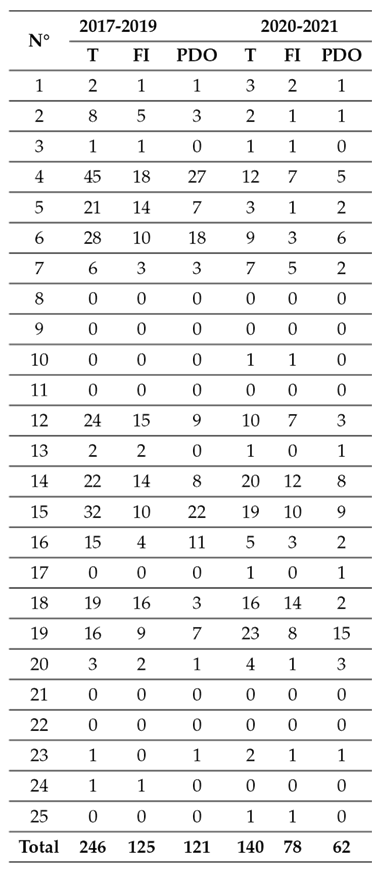
The road segments were associated with the closest crash record. Subsequently, the database was organized into two time periods: 2017-2019 and 2020-2021. This non-probability sampling division allowed calibrating predictive models via the crash data from the earlier period (2017-2019) and validating them using the more recent data (2020-2021). Initially, an analysis was conducted on individual segments, where 50 sites were randomly selected from those available. Between 2017 and 2019, 1.042 sites had no accidents, while 197 did. In total, 246 crashes were recorded during this period. Due to the low number of records and the high number of sites with no accidents, the random selection did not yield 100 crashes, despite a three-year analysis period. Consequently, we decided to use all 25 road sections as if they were individual segments, as shown in Table III.
The data from 2019-2021 were then used for model calibration. It is worth noting that, if more than three years of data were available, they could be useful for assessing potential time trends in anual calibration factor estimates 17.
Table III shows that the highest number of observed accidents took place on road No. 4, which also has the highest AADT. Surprisingly, the longest road 14 does not have the highest number of accidents, possibly due to its low AADT value. This pattern is consistent with previously estimated SPFs. Interestingly, several roads had no recorded accidents in the analyzed period, while others had no records in the first period but did in the second. It is worth noting that the total crashes (T) value is approximately double that of fatal and injury crashes (FI) or property damage only (PDO). However, this is coincidental, as this pattern does not hold when analyzing each site separately. These variations and trends suggest that the selected sites may be representative since they encompass various situations encountered in engineering practice.
Calibration of the models
The calibration methodology employed in this study aims to refine the SPFs for two-lane rural highways in mountainous environments in Ecuador. Calibration is a crucial step in developing accurate predictive models for road safety, ensuring that the models align with local conditions and offer enhanced predictive accuracy. The specific methods and approaches for calibrating SPFs can vary, but they generally follow a systematic process. Here are the methods and considerations used in this calibration:
Data collection. The calibration process relied on crash data from the National Transport Agency of Ecuador, covering the period from 2017 to 2019. This dataset included information from 25 distinct road sections, allowing for a comprehensive analysis.
Data preprocessing. Before calibration, the crash data underwent preprocessing, which involved categorizing crashes by severity (fatal, injury, property damage only), cleaning the data to remove duplicates or errors, and geocoding crash locations.
Selection of predictive variables. SPFs are typically developed as regression models that relate crash frequency to various roadway and traffic characteristics. The key variables used in the calibration process include AADT and segment length. In instances where no crashes were recorded, an exponent value of zero was assumed.
Cluster analysis. Subsequently, a cluster analysis was performed to categorize data points based on AADT ranges. This analysis helped to identify groups of data points with similar characteristics, aiding in the calibration process. The clustering approach allowed for a more tailored calibration process based on traffic volume.
Model formulation. A negative binomial or Poisson regression model was selected for formulating the model, whose form determines the relationship between crash frequency and the selected predictive variables.
Exponent estimation. The model was then fitted to the data, including the estimation of model parameters and the exponent for each predictive variable. The exponent values indicate how each variable affects crash frequency. An average of all exponents was calculated for each type of accident and for all accidents combined.
Calibration. This process involved modifying the exponent values to account for factors specific to the study area. It aimed to ensure that the model accurately predicts crash frequency in the local context. To establish a baseline for calibration, an initial analysis was conducted using data from all the road sections.
Model validation
The calibrated models were put to the test using crash data from 2020-2021. However, due to mobility restrictions resulting from the COVID-19 pandemic, the AADT figures for the sites in Table II needed adjustment. To address this issue, adjustment factors were estimated based on data from the UTPL Road Safety Observatory 18. Specifically, OSEVI-UTPL recorded the number of vehicles circulating on four two-lane roads in mountainous regions in southern Ecuador. The proportion between the traffic volume in 2017 and that in 2020-2021 was calculated for each road, and the adjustment factors were determined as their average. Consequently, the AADT for 2020 was 0,60 when compared to 2017, and for 2021, it was 0,79 compared to 2017. These factors were applied to adjust the AADT values in Table II.
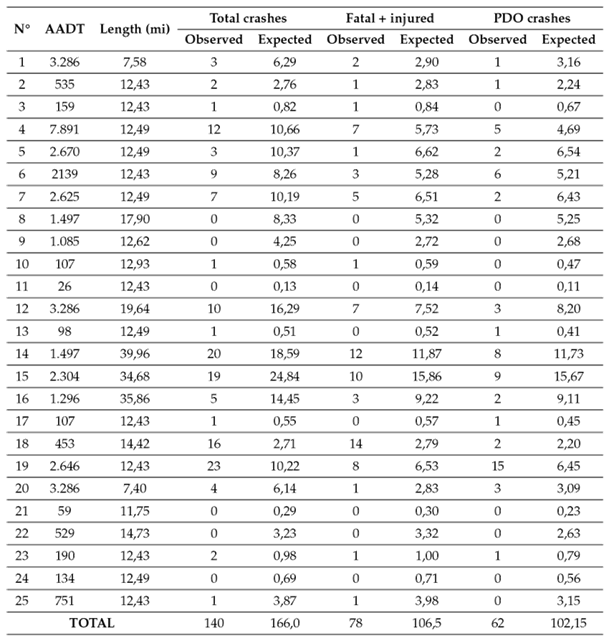
Subsequently, the calibrated models were employed to predict the number of accidents for 2020-2021. These predicted values were compared with the actual recorded values for the same period, as displayed in Table III. Finally, the errors of the calibrated models were analyzed for further refinement. The prediction errors considered for analysis included the Mean Squared Prediction Error (MSPE), Mean Absolute Deviation (MAD), Mean Prediction Bias (MPB), and Mean Absolute Percentage Error (MAPE).
Results and discusión
Continuing with the procedure outlined in the previous section, the results of the calibration and validation of the SPFs are presented.
Model calibration
Table IVpresents the calibration results, beginning with the general model for all traffic, and then the AADT ranges resulting from the cluster analysis, which achieved a 95 % similarity. The histogram in Fig. 1 confirms the ranges obtained in the cluster analysis. However, special attention must be paid to the last range, as there is a lack of AADT values until reaching nearly 15.000 vehicles/day. This stratification of AADT for the calibration of the SPF equations is in line with previous findings (15, 20).
Table IV Safety performance function proposed by this study
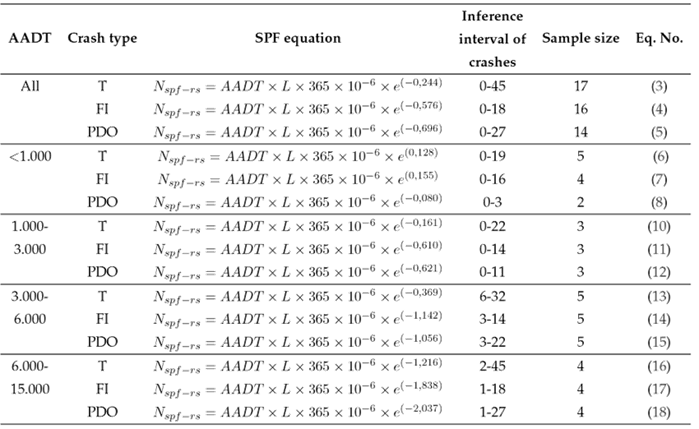
T: total crashes; FI: fatal and injury crashes; PDO: property damage only; N spf-rs: predicted average crash frequency for base conditions using a statistical regression model (crashes/year); AADT: average annual daily traffic (vehicles per day); L: length of the road segment (miles).
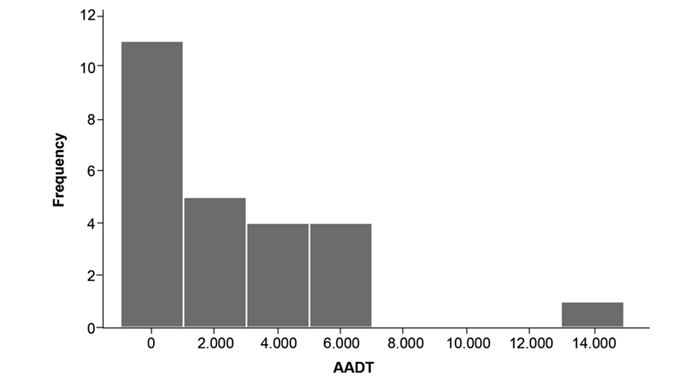
Table IVshows that the exponents for total crashes are lower than those for fatal and injury crashes, while the exponents for the latter are very similar to those for property damage only. Additionally, as the number of vehicles increases, the absolute value of these exponents increases, and this trend applies to all three categories of accidents. Only in the range of up to 1.000 vehicles per day do positive exponents appear, whereas, in the other models, the exponents are negative, as seen in the original equation.
Given these observed trends, using a single model, such as Eqs. (3), (4), and (5), would likely result in higher prediction errors when compared to using Eqs. (6) through (18). In light of this, the general model will not undergo validation in the following section.
Validation of the models
For validation purposes, we utilized the adjusted AADT, segment length, and crash data from 2020-2021. Eqs. (6)-(18) in Table IV were employed to predict the number of crashes for 2020-2021, as summarized in Table V. The selection of specific equations was based on the corresponding AADT values for each road segment. Table V shows that the total number of observed crashes in the period was 140, while the predicted count was 166,00. For fatal and injury crashes (F+I), there were 78 observed crashes, compared to a predicted count of 106,50. Property damage only (PDO) crashes had 62 observed crashes, with a predicted count of 102,15.
The scatterplot of values from Table V is presented in Fig. 2 . In an ideal scenario, all the points would closely align around a 45° reference line. However, it is essential to remember that SPFs provide ‘long-term average results, not ‘short-term average’ ones 17. Although there are points where the equations overestimate or underestimate the observed crashes, it is necessary to conduct an error analysis to determine the validity of the equations.
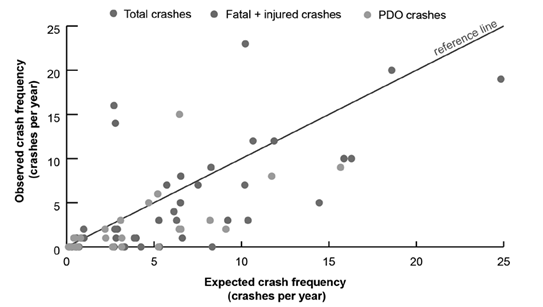
Table VI presents the prediction errors for the crashes predicted using Eqs. (6)-(18). Regarding the MSPE, lower values are preferable, as they indicate a better fit of the model to the data. In this case, the values could be deemed acceptable, with the highest value being 27,8.
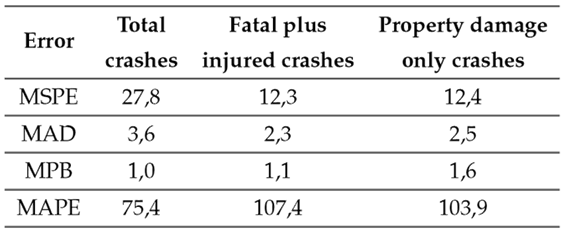
The MAD provides a measure of the average magnitude of prediction variability, and smaller values are preferred over larger ones. In this case, the maximum value was 3,6, which was deemed acceptable.
The MPB offers insights into whether the equations overpredict or underpredict. A positive value suggests underprediction, while a negative one implies overprediction. As observed in Fig. 2 , the equations are slightly underpredicting, consistent with the calculated positive values of MPB.
Lastly, the MAPE calculates the average error percentage between the observed and predicted values, relative to the former. Lower MAPE values indicate better predictions.
However, in this case, the values are relatively high due to their close relationship with the total recorded crash values.
Despite the higher MAPE values, the rest of the error metrics constitute noteworthy results, suggesting that the models can be regarded as validated.
The presented and validated models represent significant progress in the field of road safety for two-lane roads. Using separate equations for different types of accidents, as demonstrated here, addresses the limitation of a single equation, such as the one proposed by the HSM, which can lead to errors when applied without distinction among accident types. This finding is consistent with previous research 9. Furthermore, the utilization of models based on traffic ranges, as shown in this study, has also been recognized in previous studies, and it is confirmed to provide improved results 17. These advancements contribute to a more nuanced and accurate understanding of road safety, ultimately aiding in the development of more effective safety measures and policies for two-lane roads.
Conclusions
The objective of this study was to propose Safety Performance Functions (SPFs) for two- lane rural highways in mountainous environments in Ecuador. After analyzing 25 road sections and accident data from 2017 to 2021, the following conclusions can be drawn: It was possible to successfully calibrate and validate 12 SPFs for two-lane roads. Unlike the Highway Safety Manual (HSM), which provides a single model for all accident types and Average Annual Daily Traffic (AADT) ranges, this study offers four models for total crashes, four for fatal and injury accidents, and four for property damage only. These models cover various AADT ranges, thus enhancing their applicability.
The base conditions, as defined in the HSM, are primarily derived from road characteristics commonly found in the United States. Our study area in Ecuador includes roads that may have different characteristics, such as narrower shoulder widths, variations in roadside hazard ratings, and mountainous terrain, which are not fully aligned with the HSM’s base conditions. To address this limitation, we conducted our calibration and validation efforts using the available data, which reflect the local conditions of Ecuadorian mountain roads. While our approach provided valuable insights into road safety in our specific context, we recognize that it may have introduced variations compared to a strict adherence to HSM base conditions.
This study underscores the importance of calibrating models developed elsewhere before applying them to local conditions. The calibrated equations can be used for existing roads, alternative designs for existing ones, or new road projects, ultimately contributing to improved road safety for two-lane rural roads in Ecuador.
However, it is important to acknowledge the study’s limitations. Firstly, it focused exclusively on two-lane roads in mountainous environments, which may not fully represent all road types in the country. Additionally, there was limited representation of high-traffic sites, which could lead to inconsistencies in the models for the highest AADT range. Furthermore, the study could not verify whether all road accidents were accurately collected and categorized, relying solely on data provided by the National Transport Agency (ANT).
Despite these limitations, the study significantly contributes by introducing various SPF equations for three types of road accidents and several traffic volume ranges that were previously lacking in the country. These models serve as a valuable starting point for analyzing accident rates in Ecuador and other regions with similar road characteristics

