Introduction
In addition to the natural variability of the hydrological cycle variables, it is necessary to consider climate change associated with human activities, which refers to changes in the composition of the global atmosphere and the long-term average state of the climatic characteristics due to anthropic 1,2. The observed changes in the hydrometeorological data, such as air temperature and precipitation 3, the significative increase of the peak flows and the frequency of extreme events (e.g. storms and droughts) are present in study area (the South part of the Aburrá River valley (also known as Medellín River), located in Medellin, Colombia). There is a significant increase in the flows of the Medellín River 3,4, which in recent years has caused overflows at different points along its channel, which presents a challenge for the communities and public administration in its area of influence and river flood area.
The processes associated with climate change can affect the shape of the intensity-frequency-duration (IFD) curves and the rainfall - runoff processes for the estimation of maximum flows 4, which establishes the need of considering climate variability scenarios in the estimation of extreme events. The previous issue can have a great impact in the relationship between water with climate change, crises related to energy, food supply and price, population growth, changes in economic activities and land use and with social and financial market problems. Therefore, it is time that these relationships to be included in the compromise solutions by decision makers 5,6.
Due to the increase in the intensity and frequency of precipitation in the Aburrá Valley (Antioquia, Colombia) 7,8, the continuous anthropization of the basin, changes in land use, factors associated with climate change and the intensification of the effects of the ENSO phases 9,10, the characterization and modeling of peak flows with stationary and non-stationary conditions are required by the government entities in the upper basin of the Medellín River. This study shows the peak flow modeling for different return periods and stationary and non-stationary conditions with different soil moisture conditions. This study captures both current conditions and future conditions of hydrological behavior of the basin. The results of this study can serve the input for planning, risk management and water resources management. Also, for the public administration have a better understanding of the behavior of hydrological processes for a good decision making.
This work shows the hydrological study carried out in the upper basin of the Medellín River (Colombia), which is divided into three groups of activities. First, the characterization of the study basin was carried out, which consists of the analysis of the relief, coverage and land uses and the calculation of geomorphological parameters and infiltration behavior in the sub-basins. Then, the hydrological characterization was carried out, which consists of the analysis of data from the existing rainfall stations in the basin, and the data of levels and flows measured in the main channel of the river. The data used in this study comes from precipitation gauges installed by the Public Services of Medellín (in Spanish, Empresas Públicas de Medellín, EPM)) and precipitation and stream level gauges of the Early Warnings System of the Aburrá Valley (in Spanish, Sistema de Alerta Temprana del Valle de Aburrá, SIATA). Through the analysis of the precipitation data, the design precipitation and the precipitation events were obtained and used as input data for the modeling.
Finally, hydrological modeling activities were implemented, which were carried out using the HEC-HMS of system of the United States Army Corps of Engineers 11. These activities include calibration and validation tests using information measured in the study area (level stations), as well as sensitivity to some parameters such as lag time or antecedent moisture conditions for the hydrological loss model and the rainfall-runoff models to be used.
Methodology
The Aburrá River Valley or Medellín River is located in the Central Mountain range of the Colombian Andes, between latitudes 6°00'N and 6°30'N and longitudes 75°15'W and 75°45'W, with an approximate length of 100 km and a variable width of 30 km in the widest sector and 10 km in the narrowest sector. It comprises an area of approximately 1240 km2 (12. The area under study corresponds to the upper part of the Medellín River basin, which contains the municipalities of Caldas, La Estrella, Sabaneta, Itagüí and Envigado. These belong to the Metropolitan Area of the Aburrá Valley in the department of Antioquia, Colombia. Figure 1 shows the basin of study and its location in the Colombian national territory. The basin of the Medellín River was delimited from its source, in the sector known as La Clara in the municipality of Caldas, to the mouth of the La Presidenta stream, one of the main tributaries of the Medellín River, located in the El Poblado neighborhood of the municipality of Medellín. The basin delineated for this study has a total drainage area of 306 km2.
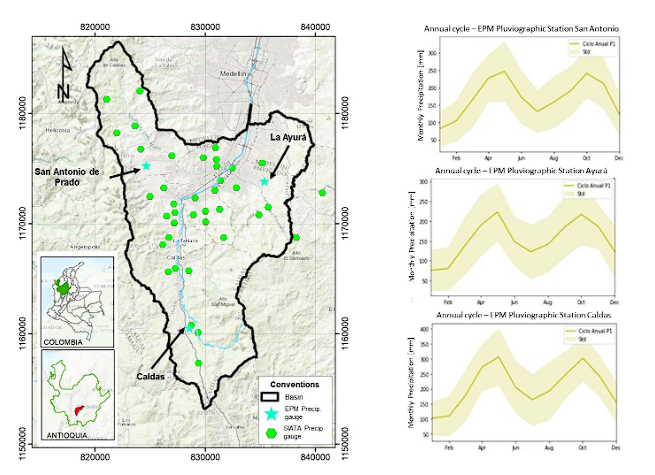
Figure 1 Study zone: Upper Basin the of Medellin River. The left panel shows the localization of the basin and of the precipitation gauges used in this study (both EPM and SIATA). On the right panel is shown the annual cycle of precipitation from historical data in the EPM gauges San Antonio de Prado, Ayurá and Caldas.
The region in which this basin is located is characterized by high climatic variability, which is reflected in variables such as precipitation, largely influenced by features such as the orographic configuration of the area (the Andes Mountain Range) and different macroclimatic phenomena such as ENSO, the Chocó Jet, Madden-Julian oscillations and latitudinal migration of the Intertropical Confluence Zone (ITCZ; 9,10,13). The effect of this last process can be seen in the annual cycle of precipitation (Figure 1), which present a bimodal behavior with two annual maximums (around the trimesters of March - May and September - November) and two annual minimums (around the trimesters of June - September and December - February).
As it was said before, this hydrological study is divided into three parts. Firstly, the characterization of the basin, in which the characteristics related to the shape and relief of the basins within the area of influence of the project are studied. Likewise, the relationships and parameters that allow us to understand the hydrological behavior of each of the basins and the network of canals that make them up are analyzed. Secondly, there is the hydrological characterization, where the data from measurements of hydrological variables, in this case precipitation, levels and streamflow are analyzed to establish the historical behavior of the surface hydrological processes in the area. This permits to make calculations of projections of the probable behavior of these processes. Finally, there are hydrological modeling activities, which are based on the results obtained in the characterization of the basin and hydrological characterization. For these activities, semi-distributed hydrological modeling strategies were implemented, using the HEC-HMS software developed by the United States Army Corps of Engineers 11.
Basin characteristics
For the morphometric analysis, the cartography data used were processed via Geographic Information systems, supported by digital hydrography produced by the Agustín Codazzi Geographic Institute - IGAC 12 and geospatial data provided by the Aburrá Valley Metropolitan Area (AMVA; 14,15. To estimate the morphometric parameters, the digital terrain model provided by the SIATA team was used, which has a spatial resolution of 2.0 x 2.0 m. The Medellín River basin was divided into 37 sub-basins (with areas greater than 0.6 km2) and 4 drainage zones lateral to the main channel of the Medellín River (which group together the areas not included in the larger sub-basins, closer to the river). This delineation of the sub-basins can be seen in the left panel of Figure 2. There are some sub-basins with a large area, such as the Doña María stream (78.84 km2), La Ayurá (33.89 km2), La Presidenta (29.51 km2) and La Doctora (11.3 km2), which amount to around 50% of the total area of the basin of study.
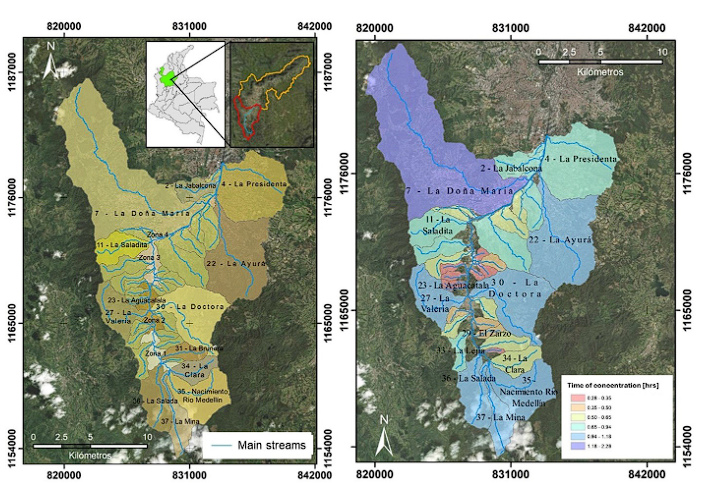
Figure 2 Sub-basins of the Upper Basin of the Medellín River (left panel) and their times of concentration (in hours; right panel).
Besides the area of the sub-basins, other morphological parameters such as the average channel and sub-basin slope, the difference between the maximum and minimum height of the sub-basin, were used to calculate the times of concentration of every sub-basin considered. The time of concentration is an important input parameter for the hydrological analysis and twelve calculation methods were used to calculate it, including Témez (1978), Kirpich (1990), California Culverts Practice (1942), SCS - Ranser (1958), Williams (1922), Johnstone and Cross (1949), Linsey, Snyder, Ventura-Heron (1978) 16. The value of the time of concentration for each subbasin was defined as the average value (removing outliers) of the results obtained by applying of all the methods mentioned. The values obtained for each sub-basin can be observed graphically in the right panel of Figure 2. The results show values up to 2.28 hrs. as is the case of the Doña María sub-basin.
To estimate hydrological losses for each subbasin, the Curve Number methodology of the SCS - Soil Conservation Services 15 was used. This was done using maps of soil cover and type from the IGAC 12 and the cover and land use maps of the Planning and Management Plan for the Hydrographic Basin of the Aburrá River - POMCA 17, which is based on the Corinne Land Cover methodology proposed by the Institute of Hydrology, Meteorology and Environmental Studies - IDEAM 18. According to the IGAC information, one part of the Aburrá Valley basins is composed of heterogeneous soils with good or excellent drainage and were classified in group A. The other part is composed of soils with fine to medium textures and these were classified as type B. The urban areas present in the basin have an unfavorable drainage condition and these are classified in group D. The calculated curve number for a sub-basin is derived by relating the soil group to the specific cover types and land uses within each sub-basin. Each combination of soil group and land cover use is assigned a curve number based on the Corine Land Cover methodology tables. This process is applied to every soil group-land use and cover polygon, resulting in a list of curve numbers for each sub-basin. Then, an area-weighted average is computed to determine the curve numbers for the entire sub-basin. These are showed in Table 1.
Table 1 Sub-basins curve number estimations.
| Sub-basins | CN II | CNIII | Imp* [%] | Sub-basins | CN II | CNIII | Imp* [%] |
|---|---|---|---|---|---|---|---|
| 1 | 98.00 | 99 | 100% | 2 - La Jabalcona | 89.81 | 96 | 83% |
| 3 | 98.00 | 99 | 100% | 4 - La Presidenta | 79.61 | 90 | 65% |
| 5 | 98.00 | 99 | 100% | 6 | 94.16 | 98 | 100% |
| 7 - Doña María | 60.58 | 78 | 25% | 8 - La Sucia | 91.12 | 96 | 88% |
| 9 - La Heliodora | 88.84 | 95 | 84% | 10 - La Honda | 86.17 | 94 | 80% |
| 11 - La Grande | 49.60 | 70 | 14% | 12 - La Tablacita | 73.55 | 87 | 47% |
| 13 - La Bermejala | 51.61 | 72 | 12% | 14 - Miraflores | 65.96 | 82 | 37% |
| 15 - La Doctora | 65.14 | 82 | 40% | 16 - Palosanto | 60.89 | 79 | 33% |
| 17 - La Polvosa | 59.54 | 78 | 30% | 18 - La Culebra | 55.06 | 74 | 32% |
| 19 | 71.28 | 86 | 52% | 20 - La Raya/La Manuela | 55.88 | 75 | 29% |
| 21 - La Cano | 50.99 | 71 | 8% | 22 - La Zúñiga/Ayurá | 56.76 | 76 | 29% |
| 23-La Aguacatala | 64.02 | 81 | 32% | 24 - La Corrala | 70.27 | 85 | 50% |
| 25 - La Chuscala | 63.55 | 81 | 34% | 26 | 39.45 | 60 | 2% |
| 27 - La Valeria | 49.56 | 70 | 4% | 28 - La Loca/La Piedrahita | 53.43 | 73 | 8% |
| 29 - El Zarzo | 46.45 | 67 | 0% | 30 - La Miel | 47.39 | 68 | 8% |
| 31 - La Brunera | 40.30 | 61 | 0% | 32 - La Chapola | 46.39 | 67 | 0% |
| 33 - La Lejía | 52.37 | 72 | 20% | 34 - La Clara | 40.65 | 62 | 0% |
| 35 - Nacimiento rio Medellín | 42.1 | 63 | 0% | 36 - La Salada | 51.11 | 71 | 8% |
| 37 - La Mina | 45.6 | 66 | 2% | ||||
| Zona 1 | 59.86 | 78 | 23% | Zona 2 | 74.82 | 88 | 57% |
| Zona 3 | 86.07 | 94 | 79% | Zona 4 | 98.22 | 99 | 89% |
*: Imp: percentage of impervious soil
Hydrological characterization
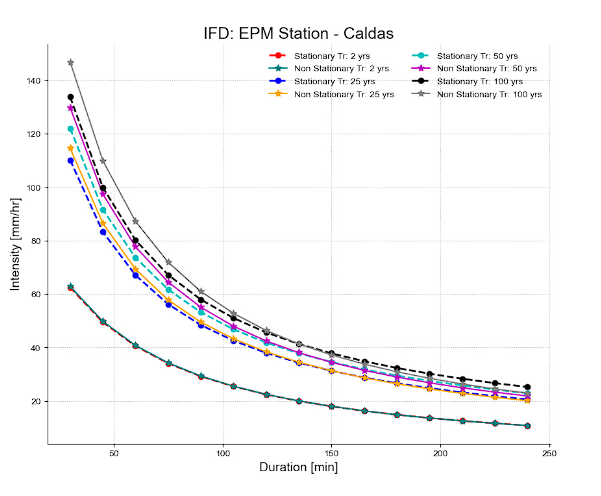
The hydrological characterization was done using two groups of information: rainfall and level data from measurements in stations located within the basin and the IFD curves (stationary and non-stationary) of the area obtained by Grajales 7,8. The design rainfall estimation was done for return periods from 2 to 100 years. EPM has 3 stations with daily resolution (Ayurá, Caldas, San Antonio de Prado) and a record spanning from 1972 to 2020. The IFD curves were estimated in these sites. SIATA has 39 precipitation stations and 6 stream level measurement stations within the study area. Record for these variables is available from 2015 to 2021, with a time step of 1 minute. In the Figure 1 the spatial distribution of the rainfall stations used in the analysis is shown for both EPM and SIATA. Figure 3 shows, in its left panel, the SIATA level and surface velocity stations along the Medellín River. Also, it is shown the behavior of the maximum and average flows in one of the stations used in this study, the La Aguacatala station. An historical analysis of precipitation and stream flows was done to select events for the calibration and validation processes in the hydrological modeling phase, as well as for the estimation of the parameters required for the evaluation of flood transit in the Medellín River channel. For these analyses, flow rate curves were estimated.
The quality and quantity of Aburrá valley basin data help to do the simultaneous analysis of events (rainfall-flow hydrographs) at the different streamflow stations installed along the river. To do this, three stations were selected from the six available stations: La Clara, Tres Aguas and La Aguacatala stations to characterize the main channel of the Medellín River in its upper, middle, and lower course. for modeling activities and estimations of floodings.
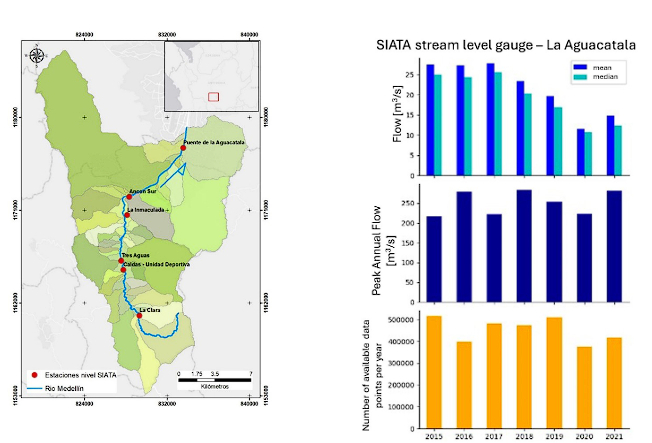
Figure 3 Location of the stream level and surface velocity gauges along the Medellín River (SIATA) (left pane) and the flow rate data (annual peak, mean and median) in one of these gauges (La Aguacatala; right pane).
To do the hydrological transit along river and their tributaries the Muskingum method was chosen as it is available in the HEC-HMS system, and it is an easy method to implement, and it also gives good results. The Muskingum method represents flow-storage relationships within channel. Figure 4 shows as an example, a flooding event recorded in the month of October 2021 at the Aguacatala and Tres Aguas stations, with their hyetographs recorded in the surrounding precipitation gauges. As expected, the hydrograph recorded at the downstream stations (Aguacatala station) presents flow values that are significantly higher than those recorded at the upstream station (Tres Aguas station). This is due to the accumulation area and the lateral contributions that take place in the study basin.
The traditional Muskingum method is not designed to take into account lateral contributions, so the three-parameter Muskingum method presented in O'Donnell 19 was used, which assumes that the lateral flow varies linearly along the reach of analysis and can be represented as a factor of the inflow, as follows:
As defined by O’Donnell 19, S represents the storage of water in the river reach during the flood event, I and Q are, respectively, the inflow and outflow in the reach, K is storage coefficient of the reach and can be thought of as the time of travel of the pulse of the flood and X is a weighting factor (dimensionless), associated with relative importance of both the inflow and outflow in determining the storage on the reach. In the basic method it is assumed there is no lateral inflow to the reach, but following O’Donnell, with the α coefficient that can be accounted for.
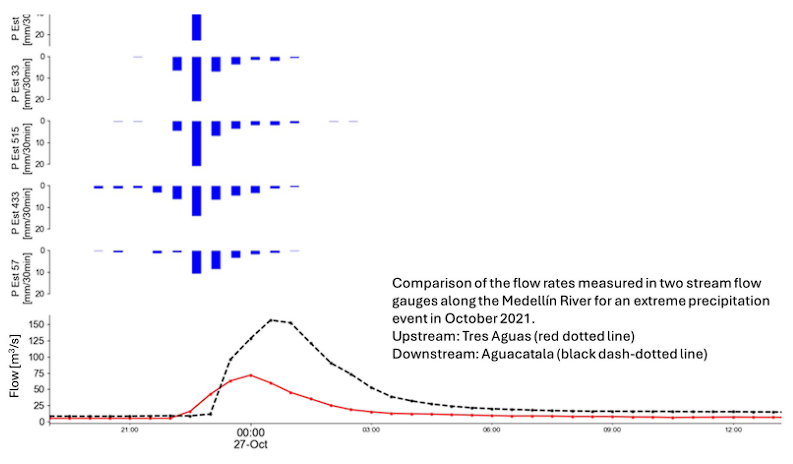
Figure 4 Flood hydrograph of October 27th, 2021, recorded at the Aguacatala and Tres Aguas stream flow measuring stations and the rainfall hyetographs measured in several nearby precipitation gauges (SIATA).
In the calibration step for the application of the O’Donnell method, the average values of relative differences of 7% for the section between Tres Aguas and Aguacatala and 10% for the river section between La Clara and Tres Aguas were obtained. So, it can be considered that the method gives useful results for hydrological modeling, using these results as input. Table 2 shows the parameter values of the Muskingum method that serve as input values in the HEC-HMS.
Table 2 Values of parameters to modified Muskingum method for the two reaches of the Medellín River considered in this study
| River reach | K (hrs) | X | α |
|---|---|---|---|
| La Clara (169)- Tres Aguas (106) | 1.36 | 0.36 | 1.36 |
| Tres Aguas (106)- La Aguacatala (94) | 1.92 | 0.25 | 1.68 |
Stationary IFD curves generated by EPM were used for its measurement stations and the non-stationary IFD curves were taken from the study carried out by Grajales 7,8 based on historical series at a resolution of 15 minutes in 34 rainfall stations. For the IFD curves, non-stationarity (temporal variations in the mean of the time series) is more marked in durations less than 50 minutes with insignificant differences in return periods less than 5 years (Figure 5).
Hydrological semi distributed modeling: HEC-HMS
For the transformation of direct precipitation into runoff, a semi distributed hydrological model of floods is proposed in which the study basin was divided into a series of interconnected sub-basins and channels. This conceptualization is enough to model spatiotemporal variability of the geomorphological and climatic characteristics of the basin under study and for which the HEC-HMS software is used 11. Figure 6 shows the graph of the topology of the model and its spatial distribution. The basin is represented by 41 sub-basin models (37 tributary basins and 4 lateral drainage zones), 20 confluence or discharge points and 19 river sections to transit the hydrographs.
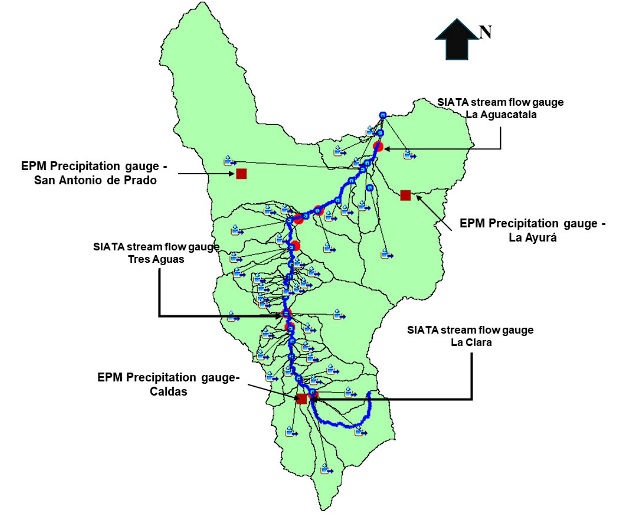
Figure 6 Topological representation of the Upper Basin of the Medellin River in the hydrological semi distributed model HEC-HMS with markers for the measurement gauges. Red wine squares: EPM precipitation gauges, red circles: SIATA stream flow gauges, blue line: main streamline of the Medellin River.
The concept of area reduction factors (ARF) by Bell 20 was introduced. This was done to include the effect of rainfall spatial variability. The ARF compares the maximum precipitation of one of the recording stations, for the different return periods with the maximum precipitation and then these are weighted using the Thiessen factors (Voronoi Polygons were drawn for the precipitation stations considered) of each of the stations. This procedure is carried out for various closure points within the study basin. This is important to analyze how the reduction factor changes according to the influence of the rainfall stations. ARF values obtained range between 0.69 and 0.74, therefore an average factor of 0.72 was used.
Results and discussions
To validate the hydrological model, five maximum monthly peak flow events from 2021 were selected: April, May, August, September, and October. These occurrences were recorded at the Aguacatala SIATA level station, the nearest stream flow gauge to the basin outlet. Additionally, rainfall stations nearby were chosen using Thiessen polygons (also referred to as Voronoi polygons). Three hydrological models were implemented and analyzed: the one from the Soil Conservation Services (SCS), Clark and Snyder 17,21, the latter of which yielded poorer results compared to the first two during the initial stages of modeling activities, which is why it was discarded early on. Figure 7 presents a summary of the validation results, for various combinations of factors, including the kind of curve number and the calculation of the lag time (either 45% or 60% of the time of concentration). For most events tested, these models were capable of adequately representing the behavior of the maximum flow regime and its hydrographs (observed minus simulated), with relative differences ranging between 1-20% in the magnitude of the peak flow and differences of less than 20 minutes in the time-to-peak. Additionally, the hydrological response of the basin is strongly associated with the saturation conditions of the basin. There are better adjustments for the CNII and CNIII conditions with a lag time equivalent to 60% of the concentration time of the subbasins. The use of CNII or CNIII will depend on the intra-annual climatic condition, e.g. if the season is rainy or dry. On the other hand, no significant differences are noted between the Clark and SCS hydrographs. The bigger attenuation to peak flows is for the Clark hydrograph.
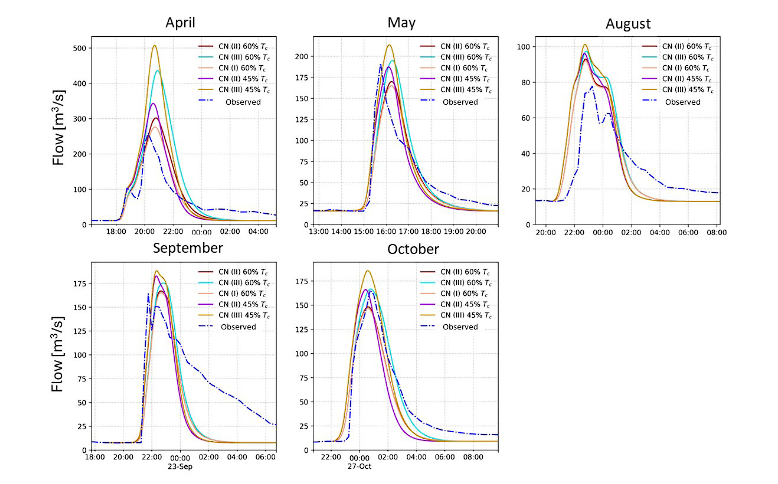
Figure 7 Validation of the hydrological model at La Aguacatala streamflow gauge (SIATA) for the five greatest peak flows recorded in year 2021, which corresponded to the months of April, May, August, September, and October.
Figure 8 shows the differences between the configurations implemented in the hydrological models considering stationary (E) and non-stationary (NE) context, antecedent soil moisture condition normal (CNII) and humid (CNIII) and the rainfall models runoff (Clark and SCS). The graph was constructed by calculating the average of the relative error between the models that have the same parameter configuration, for each of the output points. No significant differences (< 5%) are observed between the results of the models with stationary and non-stationary rainfall conditions, because, as mentioned above, the differences between rainfall become significant for return periods greater than 50 years. However, important and significant differences are observed in the magnitude of the peak flows, when the antecedent moisture conditions are changed, between normal soil and humid soil (Conditions II and III), this is due to the soil being saturated at the time of rain, generating greater effective precipitation, a situation that usually happens in the rainy seasons in the Aburrá Valley.
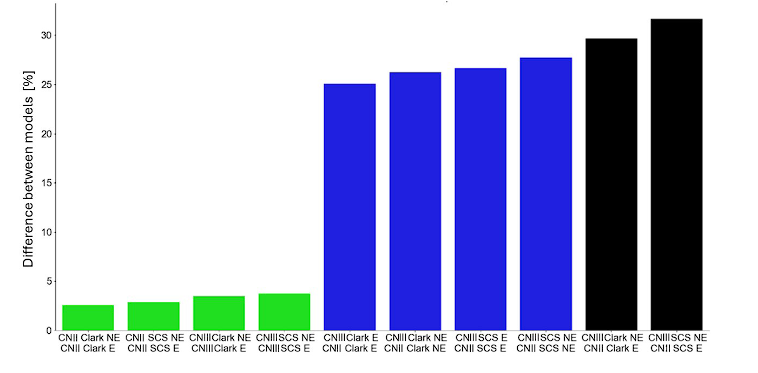
Figure 8 Relative differences (in percentage) between implemented models. On the x-axis are the two models compared with the following naming convention: Type of CN used on that model (either CN II or CNIII), Type of hydrological model (either SCS or Clark) and stationary (E) or non-stationary (NE) condition.
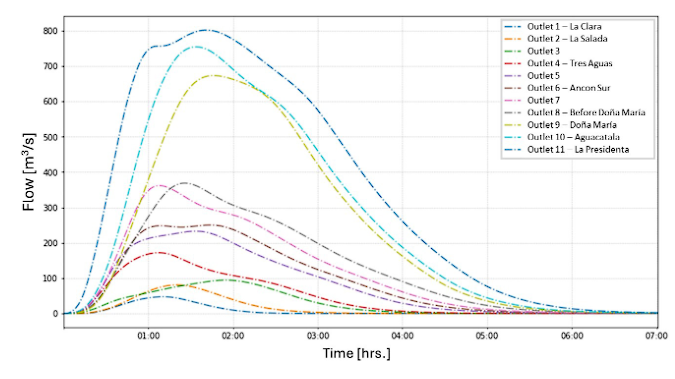
Analyzing the simulation results for the maximum events that occurred in the year 2021 in the reach between the SIATA stream flow level gauges Tres Aguas and La Aguacatala, and based on the results obtained from Figure 8, the selected conditions for the model are an antecedent moisture condition for the curve number type III and a time lag equivalent to 60% of the concentration time. In general, this combination describes the best the general behavior of the different events. Figure 9 shows the response hydrographs obtained for the 100-year return period at different outlet points along the channel of the Medellín River, with an antecedent condition of moisture III (wet soil), Clark's rainfall-runoff model and rainfall in non-stationary condition.
Conclusions
The results of this study capture the expected behavior of surface runoff in the basin of study. The comparison was made using different configurations of modeling, as well as the validation using extreme precipitation and flooding events, measured within the basin, which is a significant advance in the study area. Previous studies have not had enough records to do this type of analysis of validation. The existence of measurement networks for hydrometeorological variables (such as the ones from the SIATA and EPM), with a good density and quality data allowed validation and calibration of the hydrological model with low values of error.
To calibrate the model, five events of maximum flows that occurred in 2021 (recorded at La Aguacatala and Tres Aguas stations) were used. The results allowed to identify that the antecedent moisture conditions in the basin have a significative influence on the hydrological response. For this reason, the maximum peak recorded flow rates presented a better fit with a curve number with antecedent moisture condition type III and a lag time of 60% of the concentration time.
Stationary and non-stationary scenarios were also implemented to estimate the design rainfall events. It is important to begin considering the trends of the records on the design flows methods and to do inference of both the natural climate variability conditions and the effects of climate change.
The results show that the differences between the stationary and non-stationary cases (the latter being used as a proxy for climate change conditions) are significant on average, with percentage differences ranging between 3-5% among the cases considered, with greater magnitudes observed in non-stationary cases. However, these differences increase as the return period increase, tending to be up to around 9%, which indicates that for extreme events it is important to consider the variability in statistical parameters such as mean and variance when conducting frequency analysis for design, prevention, and mitigation of extreme events.


